Disclaimer: Information found on CryptoreNews is those of writers quoted. It does not represent the opinions of CryptoreNews on whether to sell, buy or hold any investments. You are advised to conduct your own research before making any investment decisions. Use provided information at your own risk.
CryptoreNews covers fintech, blockchain and Bitcoin bringing you the latest crypto news and analyses on the future of money.
Bitcoin breaches essential support level as the dollar and oil prices align, increasing the likelihood of a further decline.
In the last 24 hours, Bitcoin has focused on returning to significant levels on my channel map instead of continuing its breakout. It tested a boundary but was unable to convert that test into acceptance, subsequently rotating lower into the next area of support memory.
By late morning in Europe on April 2, Bitcoin’s price decreased from the upper $68,000s and low $69,000s to approximately $66,400. This 24-hour movement registered around 3%, with a peak near $69,170 and a trough near $66,218.
Over the span of 48 hours, the net change remained nearly flat, yet the trajectory within that timeframe shifted the balance of the chart downward. The price relinquished the white shelf around $66,894, rejected a retest, and left the market trading below a level that had previously maintained the local structure.
Why this matters: The change is not solely about the price movement but also the level that was breached. Bitcoin lost a support zone that had been crucial for the recent structure and failed to reclaim it on the initial retest. Concurrently, both the dollar and oil prices increased, a combination that typically exerts pressure on liquidity and risk appetite. This scenario raises the threshold for any immediate recovery and brings the next lower support zones back into consideration.
This pattern is firmly situated within the 2024 channel framework, initially outlined in Bitcoin channel predictions, aligning with market movements over the past six months. The concept was straightforward and pragmatic.
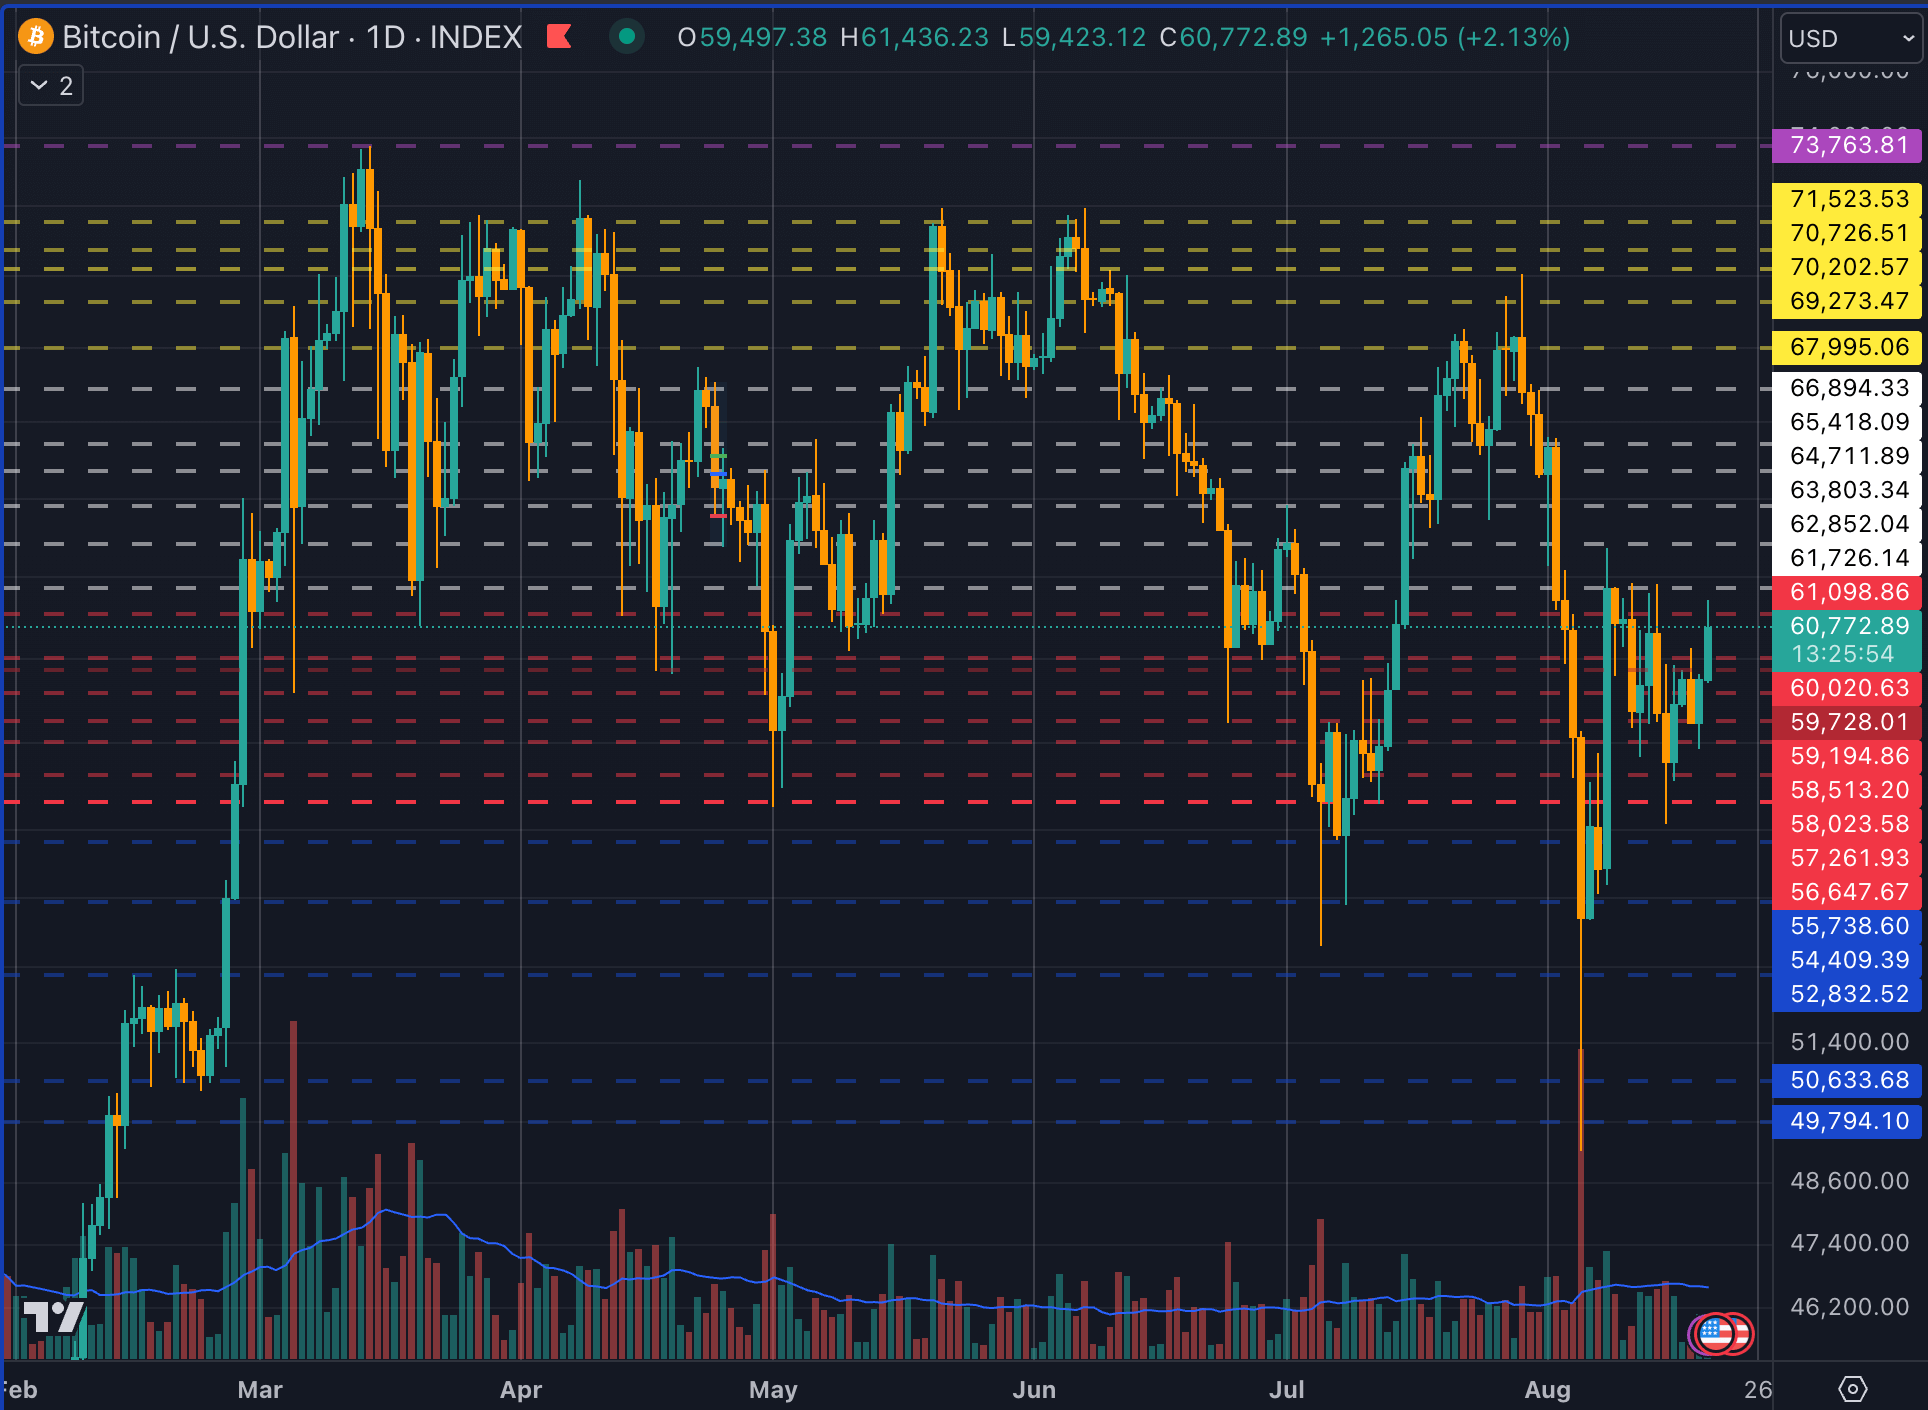 Bitcoin price chart showing repeated rejections near key resistance and support zones between roughly $49,800 and $73,800.
Identifying repeated close prices on the 30-minute chart can reveal where leverage, stop placement, and spot liquidity tend to concentrate. These shelves have consistently appeared at turning points.
They have framed recoveries, capped rallies, and guided the movement between them with greater consistency than many of the more complex narratives surrounding Bitcoin.
The last two days unfolded in three phases. Initially, Bitcoin occupied the upper half of the near-term range, pushing back toward the yellow boundary near $67,995.
Next, the movement stalled before any substantial acceptance could develop above that shelf. Finally, the chart sharply rolled over, driving the price through the white line at $66,894 before finding temporary support in the mid $66,000s.
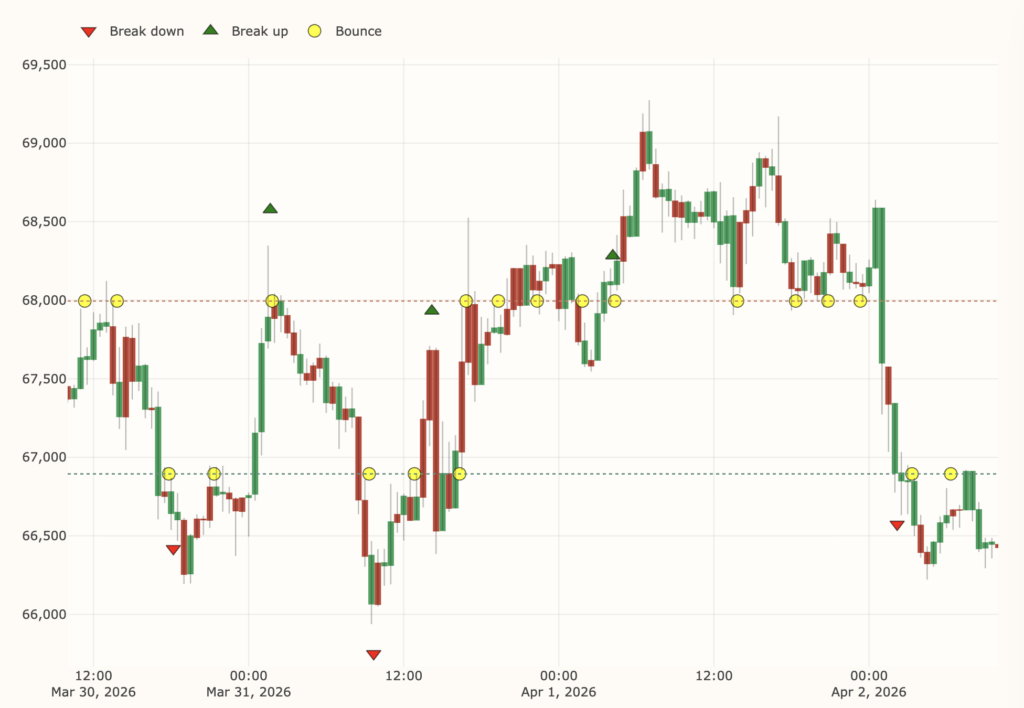 Bitcoin price chart showing a sharp breakdown from the $68,000 range to around $66,500 between March 30 and April 2, 2026.
This sequence illustrates where control currently resides. Buyers still have a pathway back into the range, although that pathway begins with repair.
The price must reclaim $66,894, followed by a push back through $67,995, before the structure appears constructive again.
Bitcoin lost the shelf it needed to maintain, and the near-term structure has turned downward
The same reasoning that caused Bitcoin to fail seven times to break $71,500 applies here. Repeated failures at a level add significance to the next test.
A ceiling becomes a barrier when sellers step in and meet the price earlier, while a floor becomes susceptible when buyers lose the urgency to defend it upon first contact. In that February analysis, the critical level was $71,500, with subsequent friction zones above around $72,000 and then $73,700 to $73,800.
Below, I highlighted the same shelves visible on the current chart: $68,000, then $66,900, with deeper support in the low $61,000s. That ladder remains intact today.
The distinction is that Bitcoin has now moved one rung lower.
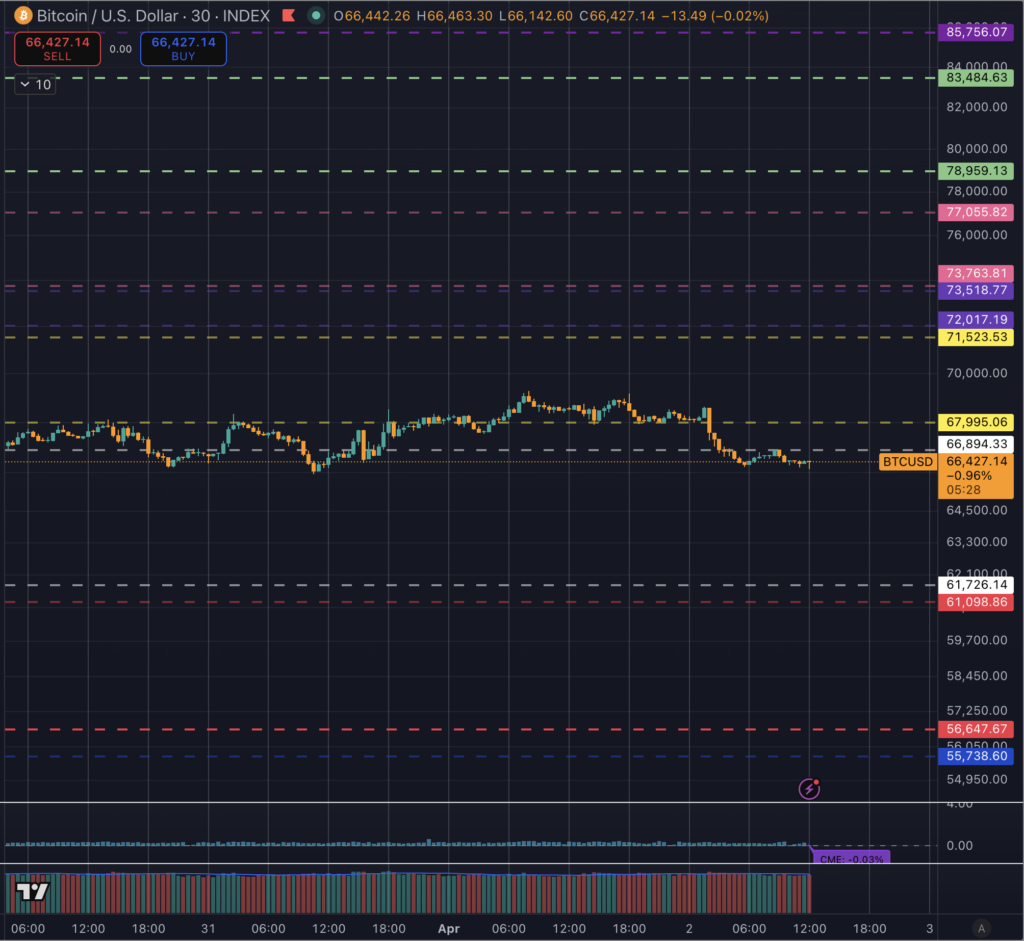 TradingView chart of Bitcoin price showing BTC/USD near $66,400 with multiple horizontal support and resistance levels marked during a recent pullback.
The practical sequence is clear. The market had the capacity to recover while it remained above the white shelf.
Once it lost that level and failed the retest, the onus shifted to buyers to demonstrate that the decline was a flush rather than a new acceptance at a lower level. Thus far, the rebound has lacked strength.
A brief surge back toward the broken shelf produced the kind of weak retest that typically accompanies a market still under pressure. The candles following the drop appear smaller, the bounce looks strained, and the range compression is occurring beneath resistance rather than above support.
The 24-hour figures support that perspective. Bitcoin declined approximately 3.02% from the previous day’s close, while the 48-hour change remained only slightly positive.
This combination often arises when a market has spent one day establishing a base and the following day relinquishing it. In other words, the chart maintained the broader range while damaging the near-term structure.
For a general audience, that distinction keeps the analysis grounded in thresholds rather than emotion. The market remains within a ladder of known shelves.
It has transitioned from one shelf to the next. The immediate task for bulls is to recover $66,894, followed by $67,995.
The immediate risk for those leaning bullish is that continued trading below those levels draws attention to the lower white boundary around $61,726.
This lower target should already be recognized from my original channel work, where the channels were designed to identify support and resistance rather than enforce a single directional call. It also aligns with the roadmap in “Bitcoin to $73k? Be prepared with the price levels to watch during a bear market,” where the key point was to treat lower shelves as historical liquidity pools.
The chart here closely fits that framework. Bitcoin is trading beneath a broken support shelf, and the next significant repair level lies above the current price.
Until that changes, the burden of proof remains on the upside.
Related Posts
Support memory continues to follow the same channel logic that shaped earlier calls
These levels have proven resilient because they are derived from where the market consistently closed, paused, and established positioning. Some zones retain memory due to extended periods spent there.
Other zones appeared dramatic during upward or downward movements but provided weaker support because Bitcoin traversed them quickly, resulting in less inventory being built there.
This distinction influenced my October 2024 analysis in “Above the all-time high of $73.7k these could be the new resistance levels to watch,” where I argued that Bitcoin was trading at the top of a core price channel between $67.9k and $71.5k, and that the area between $71.5k and $73.7k had relatively little historical price action.
The implication was clear. Above the well-traded shelf, the market entered thinner territory where movements could become more abrupt.
The same reasoning applied later on the downside. In “It’s foolish to pretend Bitcoin’s story doesn’t include $79k this year,” I described the green band around $79,000 as a more substantial region because Bitcoin had spent time consolidating there during earlier phases of the cycle.
Below that were the deeper structural supports in the red and blue channels, roughly $49,000 to $56,000, the area Bitcoin defended repeatedly before the move toward six figures. Then, in “Akiba’s medium-term $49k Bitcoin bear thesis – why this winter will be the shortest yet,” I framed $49,000 as a cyclical support case linked to miner stress, fee share, hashprice, and ETF flow elasticity.
Those longer-term calls operate on a different scale than the current 30-minute movement, though they all rely on the same discipline: identify the shelf, evaluate how well the price is holding it, and define the next level that becomes relevant when it breaks.
The current movement fits that sequence neatly. Bitcoin approached the lower yellow boundary near $67,995 and was unable to maintain it.
It then fell below the white shelf near $66,894. A 30-minute breakdown candle early on April 2 accelerated the move from the high $68,000s into the upper $67,000s, and subsequent selling pressure drove the price down toward the low $66,000s.
Once there, the market printed a small rebound and then drifted sideways beneath broken support. This behavior typically indicates a market still negotiating lower inventory rather than preparing for an immediate reversal.
Anyone following the latter channel work through the six-figure phase will recognize the same design principle in “Bull or Bear? Today’s $106k retest decided Bitcoin’s fate” and “Bitcoin price next move: $92k or $79k? Let’s break it down.” The exact prices changed as Bitcoin navigated through new territory, yet the method remained consistent.
A retest that holds opens the next band. A retest that fails hands control to the lower shelf.
The current chart falls into the latter category. Price remains below the broken shelf, which keeps the lower ladder in play.
Dollar strength and rising oil prices coincided with the breakdown, leaving reclaim levels above and deeper support below
The broader market context over the past 24 to 48 hours adds another dimension to the chart. Alongside Bitcoin’s decline, the comparative view indicated the U.S. Dollar Index rebounding above 100 while Brent crude approached $108.
This combination tightens conditions around risk assets. A stronger dollar typically weighs on global liquidity at the margin, and higher oil prices can heighten inflation concerns, rate sensitivity, and geopolitical caution.
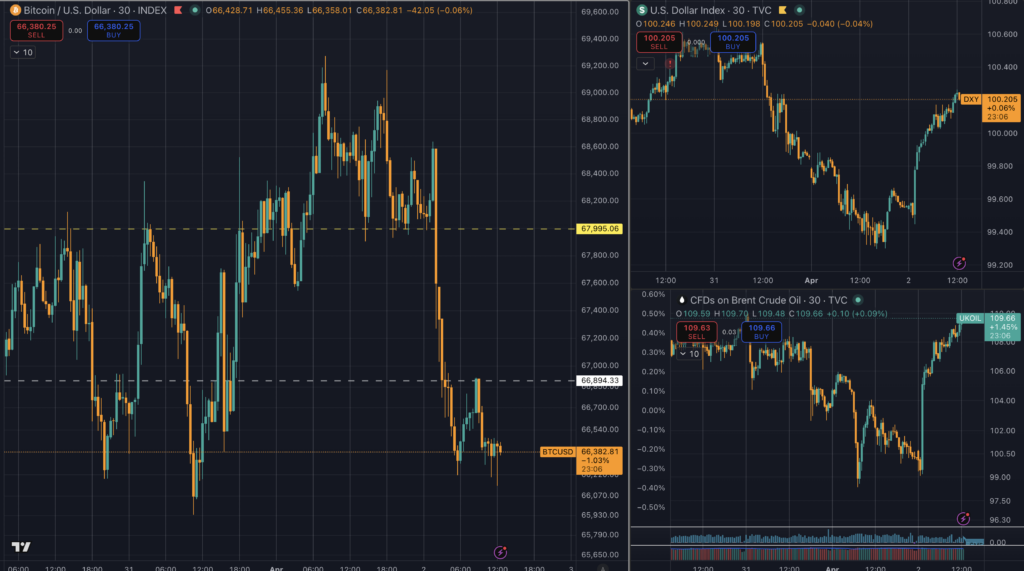 Composite chart showing Bitcoin breaking below support while the U.S. dollar index and Brent crude oil rise, highlighting tighter macro conditions.
Bitcoin tends to experience greater friction when both markets are moving in the same direction against a softer risk backdrop.
This setting aligns well with the framework of the later channel pieces. In the $79k analysis, I noted that liquidity could become an issue if ETF outflows intensified and risk appetite diminished.
In the $49k bear thesis, I argued that negative 20-day ETF flows, coupled with weaker miner economics, would increase the likelihood of sharper downside movements. In the analysis of the seven failures at $71,500, I highlighted a macro environment where yields remained sufficiently high to maintain tight conditions.
The current movement reflects that same type of pressure from a shorter timeframe; a structurally significant shelf has given way while the macro backdrop provided little relief.
For the practical map, the levels now perform the heavy lifting. Resistance begins with $66,894, then extends to $67,995.
If Bitcoin regains both and spends time above them, the near-term damage begins to heal, and the next higher levels come back into view: $71,523, then $72,017, followed by the pair around $73,519 and $73,764, and finally the upper extension near $77,056. Those higher levels are already familiar from the price discovery work above the previous all-time high.
Support starts with the intraday low in the low $66,000s, although the stronger structural memory lies much lower, near $61,726. This places Bitcoin in a narrow yet significant condition.
It is close enough to reclaim broken support if buyers return with urgency, and close enough to invite a deeper sweep if they do not.
The conclusion remains consistent with what the chart has been indicating since these channels were first drawn in early 2024. Bitcoin respects shelves until one gives way, and when one breaks, the next shelf typically becomes the target.
In the past 24 hours, Bitcoin lost the shelf it needed to maintain to keep the bounce credible. Over the last 48 hours, it preserved the broader range while shifting the short-term structure downward.
The next movement now depends on whether the price can rise back above $66,894 and $67,995 swiftly enough to alter the chart’s dynamics. If not, the lower white boundary near $61,726 becomes the next serious test on the ladder.
The post Bitcoin breaks critical support as dollar and oil move together, raising risk of a deeper drop appeared first on CryptoSlate.