Disclaimer: Information found on CryptoreNews is those of writers quoted. It does not represent the opinions of CryptoreNews on whether to sell, buy or hold any investments. You are advised to conduct your own research before making any investment decisions. Use provided information at your own risk.
CryptoreNews covers fintech, blockchain and Bitcoin bringing you the latest crypto news and analyses on the future of money.
Bitcoin (BTC) has been trading within a limited range this week and is poised to create the third consecutive Doji candlestick pattern on the weekly chart. The cryptocurrency markets did not gain any traction from the U.S. equities markets, which concluded the week negatively. The S&P 500 Index fell by 1.3%, while the Nasdaq ended down by 1.9%.
The weakness in Bitcoin has caused several altcoins to decline, with many testing multi-week lows. This suggests that the overall crypto market is firmly under bearish control. Adverse market conditions hinder buyers from spotting short-term bullish opportunities, as rallies tend to be short-lived. Nevertheless, this may present a favorable moment for long-term investors to expand their portfolios.
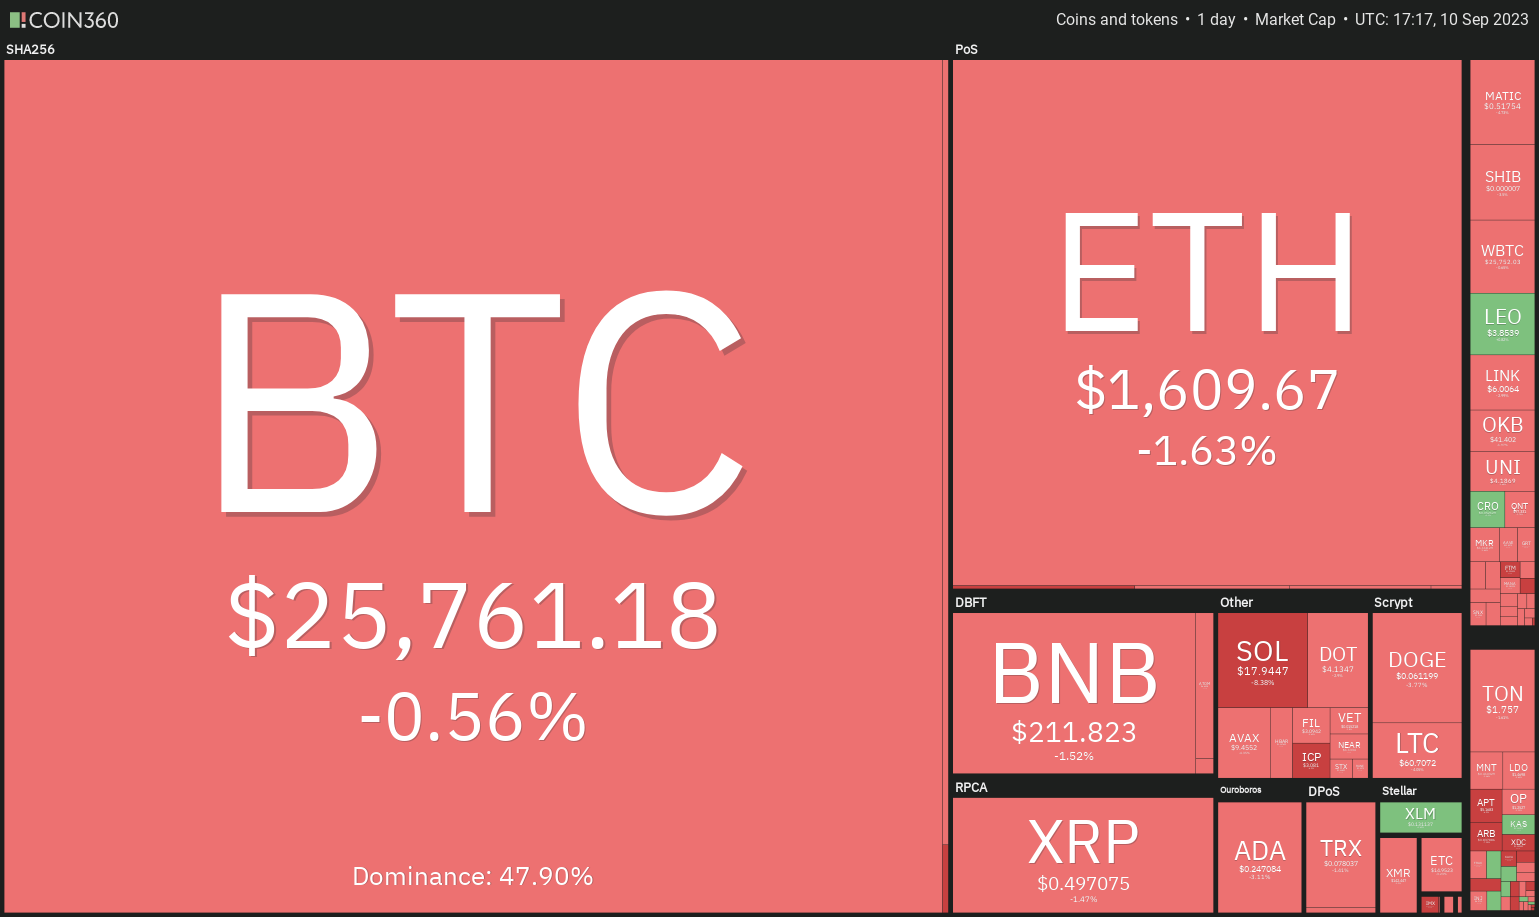 Crypto market data daily view. Source:Coin360
A recent report from Amberdata indicates that 24% of asset management firms are appointing senior executives focused on implementing digital strategies. Additionally, 13% more firms intend to adopt a digital assets strategy in the future. This reflects a “seriousness about implementation as well as senior management buy-in,” according to the report.
Could Bitcoin experience an upward breakout, increasing interest in altcoins? Let’s analyze the charts of the top five cryptocurrencies that are showing potential in the near term.
Bitcoin price analysis
Bitcoin has been hovering around the $26,000 mark for the past few days, indicating a struggle between buyers and sellers.
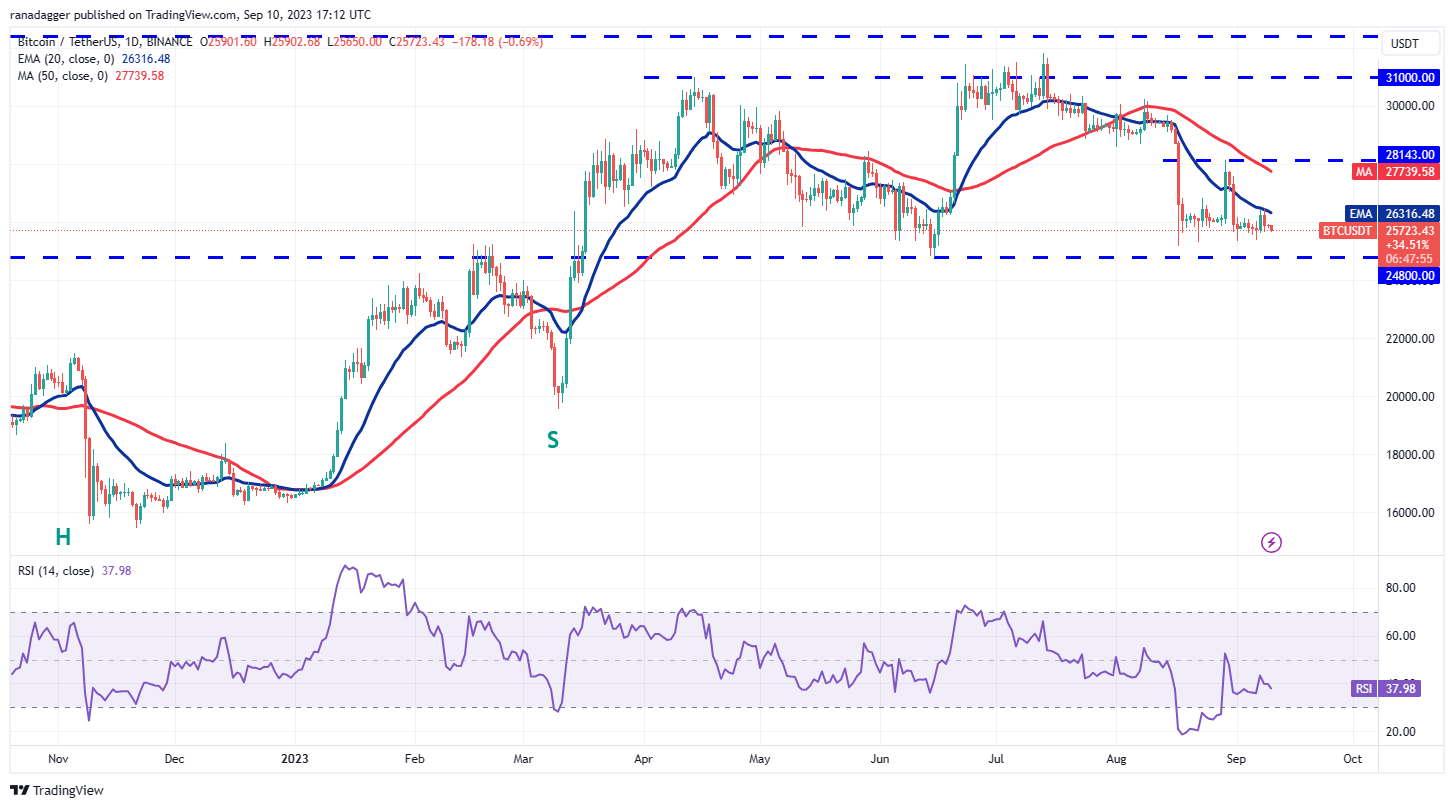 BTC/USDT daily chart. Source: TradingView
The descending moving averages suggest a bearish advantage, yet the positive divergence on the relative strength index indicates that selling pressure is easing. The indicators do not provide a definitive advantage to either buyers or sellers.
Thus, it is advisable to wait for the price to either maintain above $26,500 or drop below $24,800 before making significant investments.
If buyers manage to surpass the resistance at $26,500, the BTC/USDT pair could rise to the overhead resistance at $28,143. Conversely, a decline below $24,800 could pave the way for a drop to $20,000.
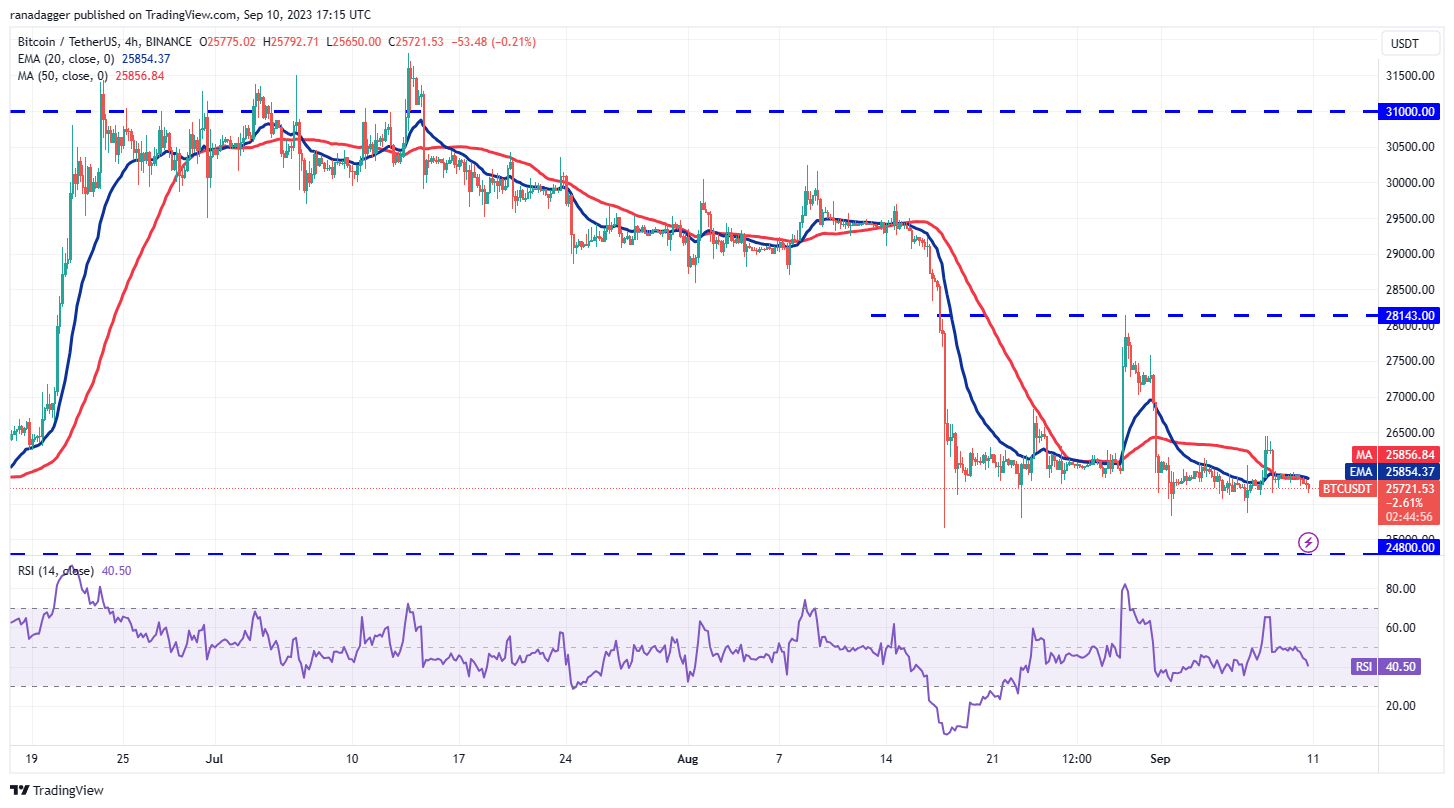 BTC/USDT 4-hour chart. Source: TradingView
The price has been trading close to the moving averages on the 4-hour chart, indicating a lack of interest from both buyers and sellers. This tight-range trading is unlikely to persist for long and may result in a range expansion in the coming days.
On the upside, a breakout above $26,500 will suggest that buyers have gained the upper hand. This could initiate a move towards $27,600 and eventually to $28,143.
Alternatively, if the price falls below $25,300, selling pressure could increase, and the pair may retest the intraday low of $25,166 from August 17.
Toncoin price analysis
Toncoin (TON) has retraced to the 20-day exponential moving average ($1.69). In an uptrend, a pullback to the 20-day EMA typically presents a low-risk entry point.
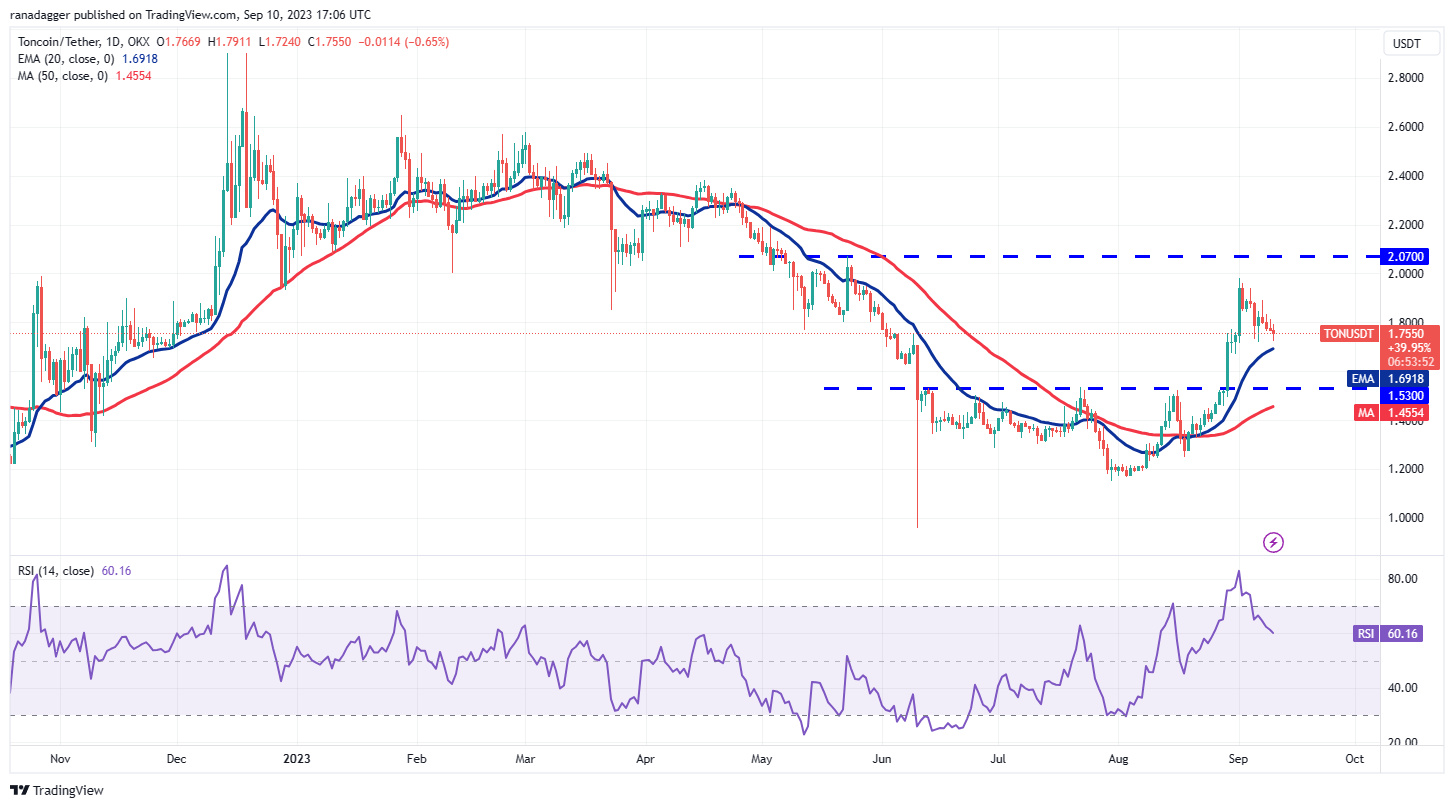 TON/USDT daily chart. Source: TradingView
The 20-day EMA is expected to serve as a strong support level. If the price rebounds from the 20-day EMA, it will indicate a positive shift in sentiment, with traders buying on dips. The TON/USDT pair could initially rise to $1.89 and subsequently attempt a rally to $2.07.
Conversely, if the price continues to decline and falls below the 20-day EMA, it will suggest that buyers are exiting their positions. This could open the door for a potential drop to $1.53 and then to the 50-day simple moving average ($1.45).
 TON/USDT 4-hour chart. Source: TradingView
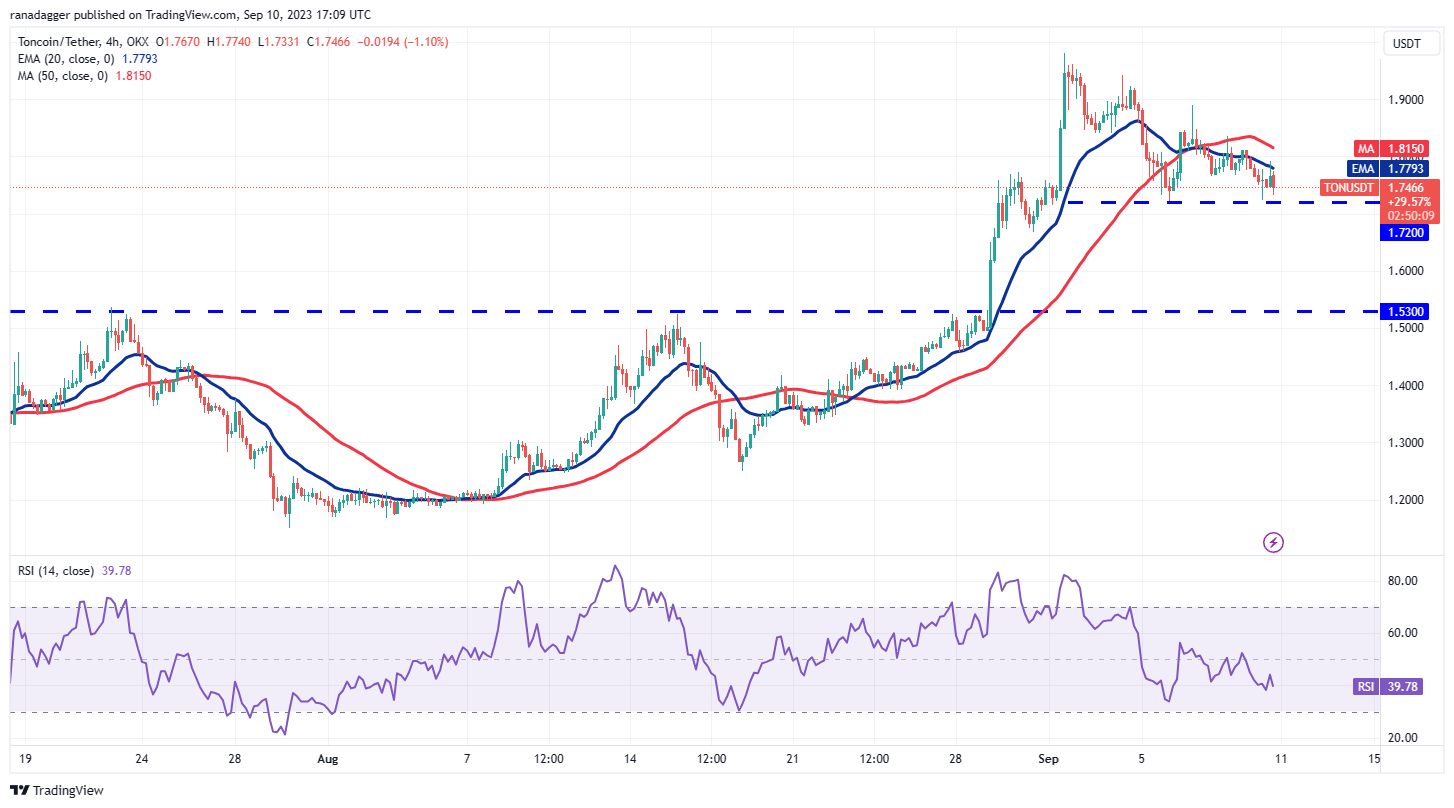
The 4-hour chart indicates that sellers are attempting to push the price below the immediate support at $1.72, but buyers have maintained their position. The descending 20-EMA and the RSI in negative territory heighten the risk of a downside breakdown.
If the $1.72 support fails, the pair could decline to $1.66 and later drop to the strong support at $1.53. Conversely, if buyers drive the price above the moving averages, it will suggest the beginning of a stronger recovery to $1.90 and subsequently to $2.
Stellar price analysis
Stellar (XLM) has shown a notable recovery in recent days, indicating that buyers are making an effort to regain control.
Related Posts
 XLM/USDT daily chart. Source: TradingView
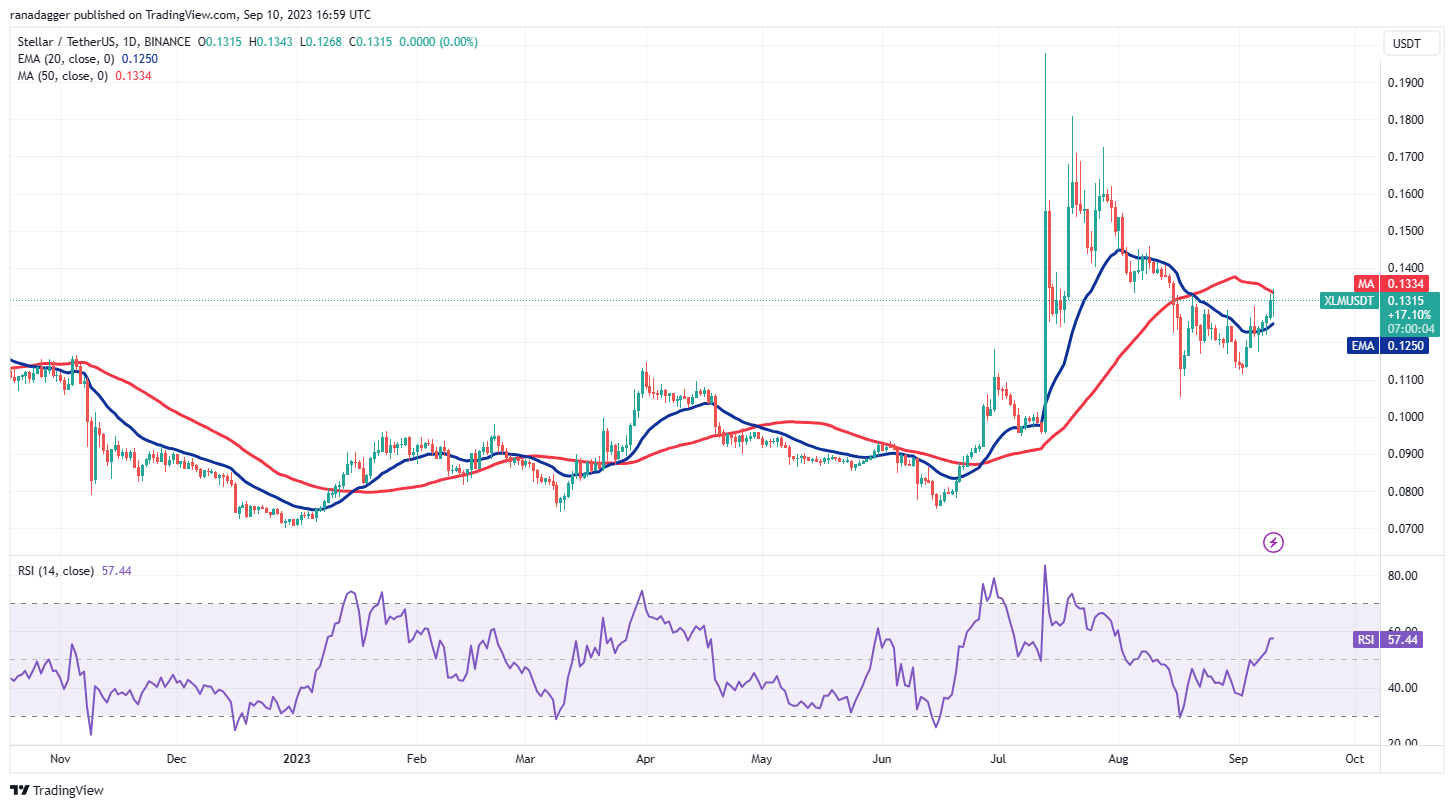
The XLM/USDT pair broke above the 20-day EMA ($0.12) on September 4, and buyers successfully prevented sellers from pulling the price back below it on September 5 and 6. This suggests that buyers are attempting to convert the 20-day EMA into support.
The price has reached the 50-day SMA ($0.13), which is acting as a barrier. A slight positive for buyers is that they have not surrendered much ground, indicating that they are not rushing to exit. If the price breaks above the 50-day SMA, the pair could surge to $0.15 and later to $0.17.
This optimistic outlook will be invalidated in the near term if the price declines and falls below the 20-day EMA.
 XLM/USDT 4-hour chart. Source: TradingView
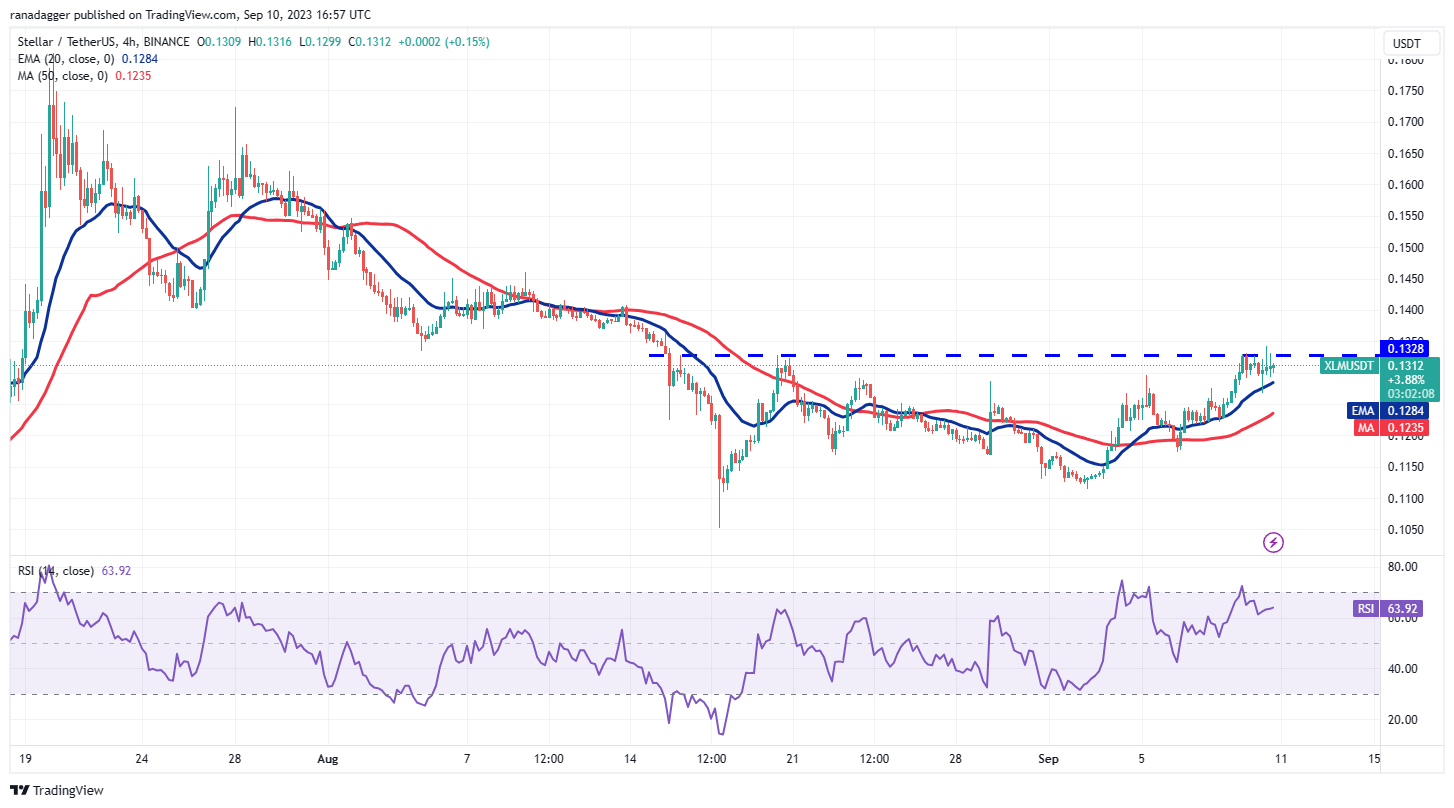
Sellers are attempting to halt the recovery at the overhead resistance of $0.13, but buyers have not given up much ground. The rebound from the 20-EMA indicates that lower levels continue to attract buyers. If the price remains above the overhead resistance, the pair could initiate an upward move to $0.15.
If sellers wish to prevent this upward movement, they must quickly pull the price below the 20-EMA. This could accelerate selling and drive the price down to the 50-SMA.
Related: 3 reasons why Pepe price will continue to fall in September
Monero price analysis
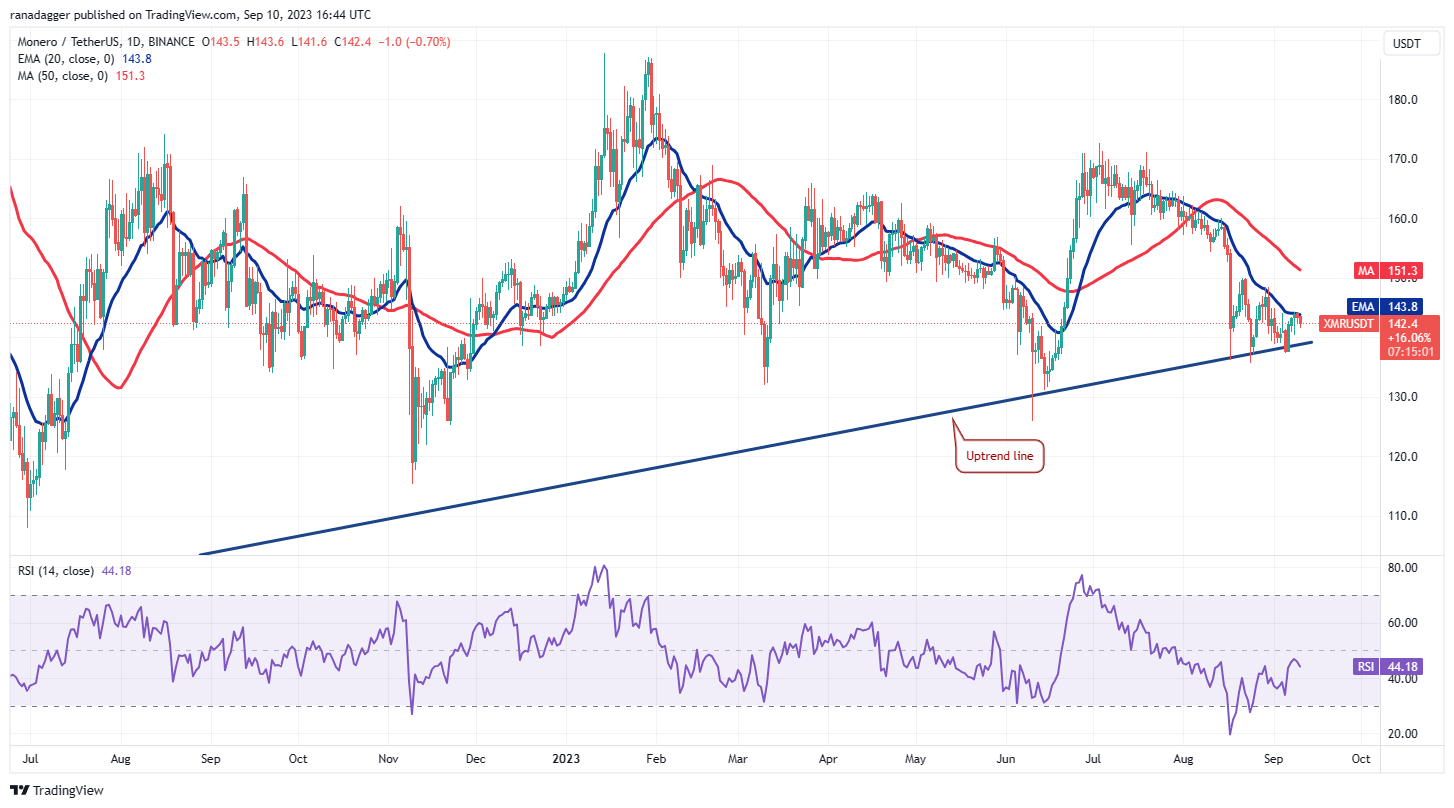
Monero (XMR) has maintained the uptrend line support for several days, indicating buying interest at lower levels. The price has reached the 20-day EMA ($143), which is a crucial level to monitor.
 XMR/USDT daily chart. Source: TradingView
If buyers push the price above the 20-day EMA, it will indicate the beginning of a sustained recovery. The XMR/USDT pair could then rise to the 50-day SMA ($151), where sellers may mount a strong defense. If this resistance is overcome, the pair could surge to $160.
Sellers are likely to have alternative plans. They will attempt to defend the 20-day EMA and pull the price below the uptrend line. If they succeed, several stops may be triggered, potentially sinking the pair to $130.
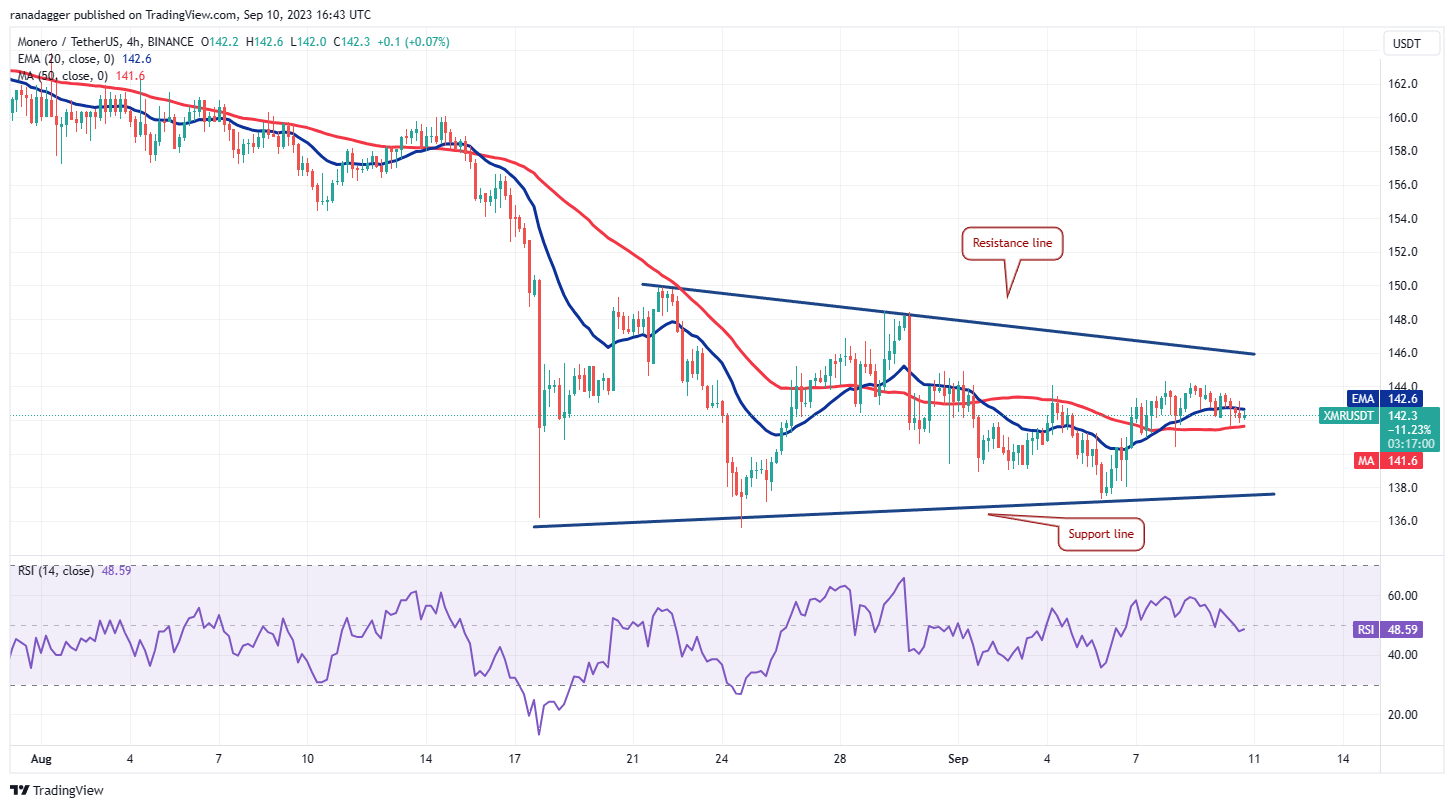 XMR/USDT 4-hour chart. Source: TradingView
The price action on the 4-hour chart reveals the formation of a symmetrical triangle pattern. The flat moving averages and the RSI near the midpoint do not provide a clear advantage to either buyers or sellers.
If the price drops below the 50-SMA, sellers will aim to pull the pair to the triangle’s support line. Conversely, if the price rises above the 20-EMA, the pair could reach the resistance line. A breakout above or below the triangle could signal the onset of a trending move.
Maker price analysis
Maker (MKR) has been caught between the moving averages, reflecting indecision among buyers and sellers. A minor positive for buyers is that the price has been trading above the downtrend line.
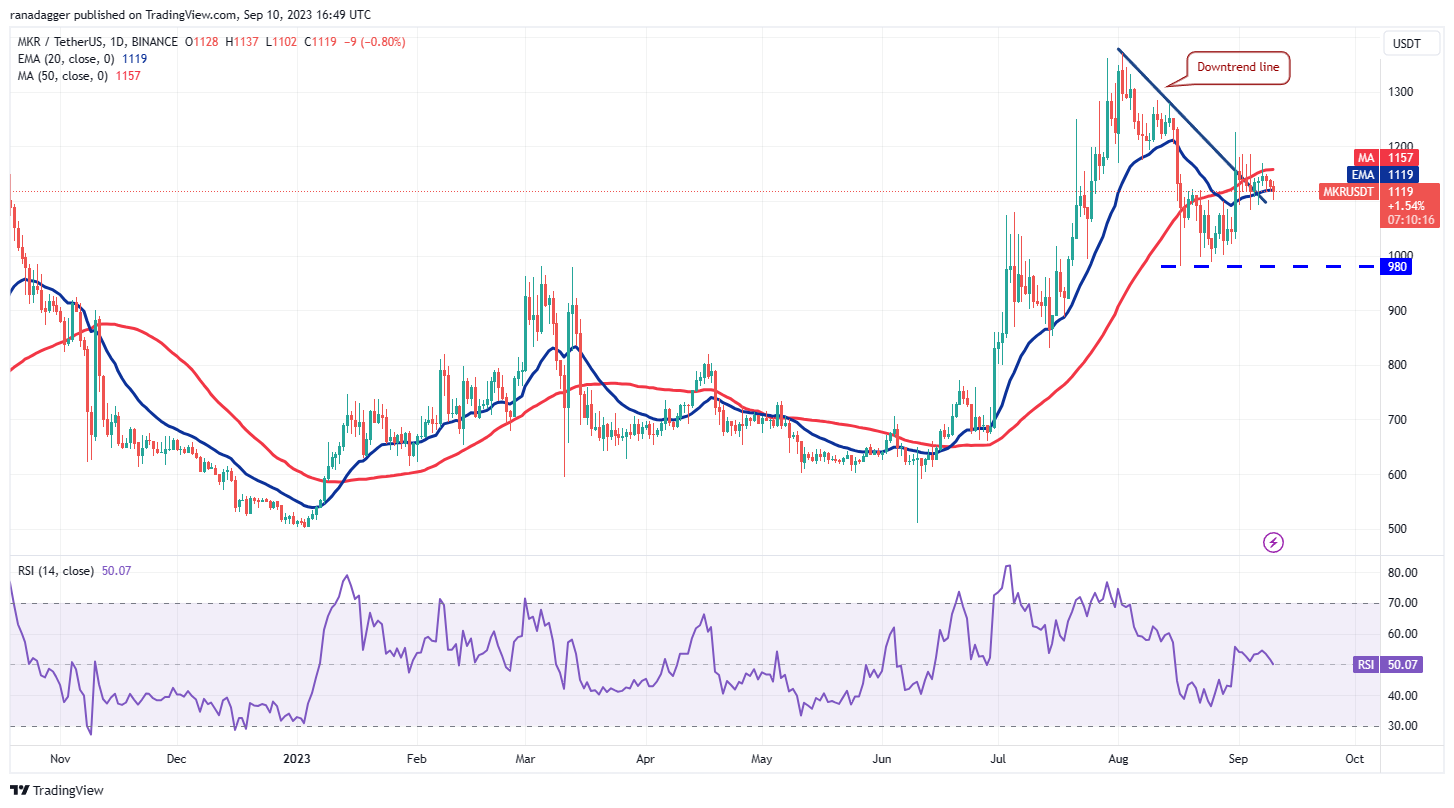 MKR/USDT daily chart. Source: TradingView
The 20-day EMA ($1,119) is gradually rising, but the RSI near the midpoint indicates a lack of bullish momentum. Buyers need to push and maintain the price above the 50-day SMA ($1,157) to signal the beginning of an upward move to $1,227.
This positive outlook could be invalidated in the near term if the price falls back into the downtrend line. The MKR/USDT pair could then decline to the strong support at $980, which is likely to see significant buying from bulls.
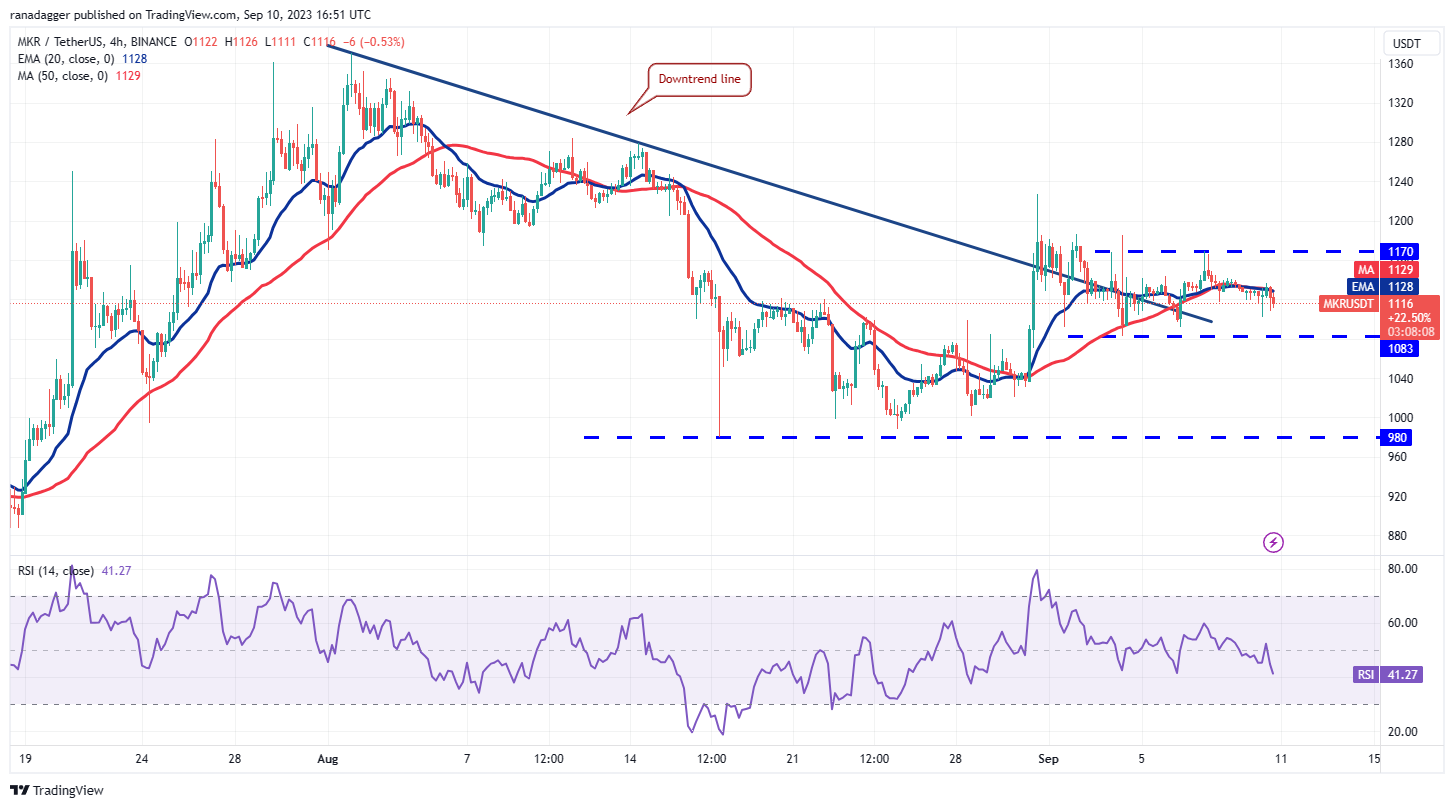 MKR/USDT 4-hour chart. Source: TradingView
The 4-hour chart shows that the price has been fluctuating between $1,083 and $1,170 for a while. The flat moving averages and the RSI in the negative zone suggest a slight advantage for sellers.
On the downside, the key support to monitor is $1,102 and then $1,083. Conversely, if the price rebounds from the current level and breaks above the moving averages, it will indicate that buyers are making a comeback. The pair may then rally to $1,170.
This article does not contain investment advice or recommendations. Every investment and trading move involves risk, and readers should conduct their own research when making a decision.