Disclaimer: Information found on CryptoreNews is those of writers quoted. It does not represent the opinions of CryptoreNews on whether to sell, buy or hold any investments. You are advised to conduct your own research before making any investment decisions. Use provided information at your own risk.
CryptoreNews covers fintech, blockchain and Bitcoin bringing you the latest crypto news and analyses on the future of money.

- SHIB experiences a rise as $1.7B worth of tokens are burned to reduce supply.
- Ongoing SHIB price fluctuations indicate it is moving beyond being a meme currency.
- The golden cross signal on the SHIB/USD chart offers a bullish buying indication.
In the past day, an impressive $1,695,572,371 ($17,000) of SHIB has been incinerated to decrease the circulating supply and enhance its value. This action has significantly lowered the circulating supply of SHIB, resulting in a substantial increase in its value.
BREAKING
An astonishing 1.69B ($17,000) $SHIB was just burned in a single transaction.https://t.co/qyEG2xaPEm
— SHIB HODLER (@ShibaInuHodler) May 5, 2023

As a result of this action, bullish sentiment has prevailed in the SHIB market over the last 24 hours. Prices have risen from an intra-day low of $0.000009848 to a 24-hour high of $0.00001003. Bullish momentum remained evident at the time of reporting, leading to a 1.10% increase to $0.00001001.
Despite approximately $3,978,227,706 tokens being burned in the last week, the SHIB price has remained relatively stable, oscillating between a 7-day high of $0.00001036 and a low of $0.000009809. This stability indicates that SHIB is evolving beyond a meme currency and is aligning more closely with broader crypto market trends.
During the bullish phase, market capitalization and 24-hour trading volume rose by 1.06% and 57.12%, respectively, reaching $5,897,207,439 and $136,225,915. The token burning, which was positively received by investors who viewed it as a commitment from the team to enhance the value of their holdings, contributed to this increase.
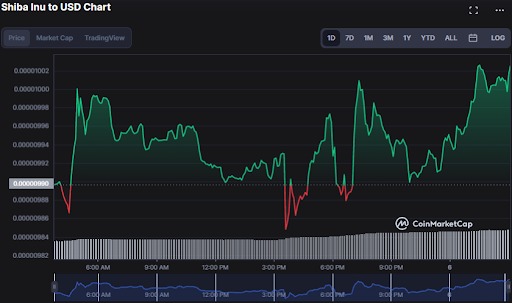 SHIB/USD 24-hour price chart (source: CoinMarketCap)
Related Posts
SHIB/USD Technical Analysis
The 5-day moving average has crossed above the 100-day moving average from below on the SHIBUSD 1-hour price chart, signaling a golden cross. The 5-day and 100-day moving averages are positioned at $0.00001001 and $0.00000998, respectively, indicating this bullish signal.
This golden cross signal serves as a bullish indicator suggesting that the price of SHIBUSD may increase. Traders and investors might interpret this as a buying opportunity and look to initiate or expand long positions.
The Relative Strength Index reading of 60.18 suggests that bullish momentum could continue, as it has not yet reached the overbought level of “80.” This potential rise heightens traders’ expectations for a continuation of the bull market, reinforcing the buy signal indicated by the golden cross.
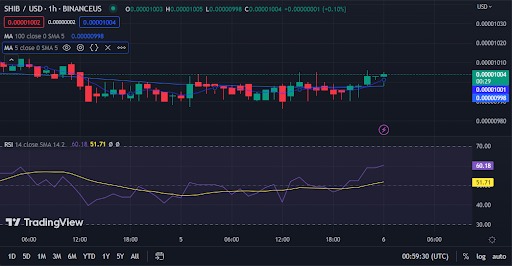 SHIB/USD 1-hour price chart (source: TradingView)
In summary, SHIB’s recent token burning has led to a price increase and a rise in market capitalization. Its resilience amid significant token burning illustrates its development beyond a meme currency.
Recommended for you
- Shiba Inu (SHIB) Price Prediction 2023