Disclaimer: Information found on CryptoreNews is those of writers quoted. It does not represent the opinions of CryptoreNews on whether to sell, buy or hold any investments. You are advised to conduct your own research before making any investment decisions. Use provided information at your own risk.
CryptoreNews covers fintech, blockchain and Bitcoin bringing you the latest crypto news and analyses on the future of money.
Rocket Pool Token Develops an Ascending Triangle Formation, Suggesting a Potential Bullish Breakout

- Rocket Pool prices have surpassed the $50.00 critical resistance, creating a bullish flag on the 4-hour chart.
- The RPL prices are encountering significant resistance at the $55.00 mark.
The analysis of the Rocket Pool (RPL) token price for May 3, 2023, shows that the token commenced the daily trading session at a low of $48.23. For the past few weeks, the token has been fluctuating between $48.23 and $52.55. The formation of higher lows suggests buying interest at elevated price levels.
The flag pattern signifies a continuation of the prior uptrend. A “bullish breakout” could propel RPL prices to reach new monthly peaks above $60.00. Conversely, if the $55.00 resistance is not overcome, prices may decline to retest the $48.23 support level.
Currently, Rocket Pool is trading at $52.23, reflecting a 6.99% increase, with a trading volume of $16,007,628. The trading volume has surged significantly over the last 24 hours, indicating an influx of buyers into the market.
Examining the daily timeframe, Rocket Pool has been achieving higher highs and higher lows, with the price remaining above the 12-day EMA and the 26-day EMA, suggesting a bullish trend.
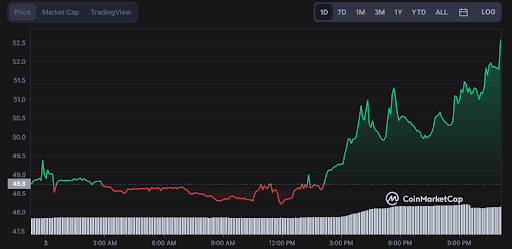 Rocket Pool price action (Source: Coinmarketcap)
The RSI stands at 66.71, indicating that the token is neither in an overbought nor oversold condition. The MACD is also positioned above the signal line, with the histogram showing increasing height, reflecting growing bullish momentum.
Related Posts
The Average Directional Index, which measures the strength of price trends, shows a reading of 38.89, indicating a robust uptrend. The ADA/USD pair may maintain its upward trajectory if the bulls sustain control.
RPL/USD Technical Analysis on a 4-hour chart: A bullish Flag pattern formed
Rocket Pool price action on the 4-hour chart reveals that the altcoin price surged past the critical resistance of $50, forming a bullish flag pattern in the process. A strong resistance at the 21-day EMA has been preventing the price from advancing for over a week.
A breakout above this level could drive RPL/USD up to $75 in the near future. The Relative Strength Index (RSI) has also stabilized above 50, indicating potential for additional bullish momentum in the short term.
On the downside, if Rocket Pool fails to surpass the 21-day EMA resistance, it may retrace to $45. Key support for this scenario will be at the 20-day SMA and the 50-day SMA, both of which have shown resilience in recent weeks.
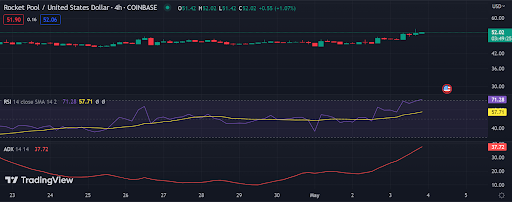 RPL/USD 4-hour chart (Source: TradingView)
Rocket Pool’s fundamental analysis indicates that whale activity frequently signals market tops and bottoms for the cryptocurrency. An increase in large transactions exceeding $100,000 worth of RPL could be interpreted as an indicator of a market peak or trough.
Moving forward, analysts are likely to keep an eye on whale activity and significant volume spikes to identify potential trend reversals for the Rocket Pool price. Recent whale transfer data reveals that 70 transactions involving more than $100k worth of RPL preceded the local price peak and subsequent decline.
Although RPL has experienced substantial growth since its launch in November 2021, the cryptocurrency remains vulnerable to whale activity and large volume fluctuations that could lead to temporary price distortions. Analysts advise monitoring on-chain data and whale transfers to gain a clearer understanding of Rocket Pool price trends and possible reversals.