Disclaimer: Information found on CryptoreNews is those of writers quoted. It does not represent the opinions of CryptoreNews on whether to sell, buy or hold any investments. You are advised to conduct your own research before making any investment decisions. Use provided information at your own risk.
CryptoreNews covers fintech, blockchain and Bitcoin bringing you the latest crypto news and analyses on the future of money.
Bitcoin (BTC) has remained within a broad range since April, reflecting uncertainty regarding its next directional shift. Attempts by bearish traders to push the price below the range’s support were countered by bullish activity on Sep. 11. Nonetheless, Bitcoin has not yet fully recovered.
Jamie Coutts, a chartered market technician and crypto market analyst at Bloomberg Intelligence, stated in an interview with Cointelegraph that if the tightening cycle continues, accompanied by “an increase in unemployment and additional strain in the banking sector, then risk assets like Bitcoin may experience further challenges.”
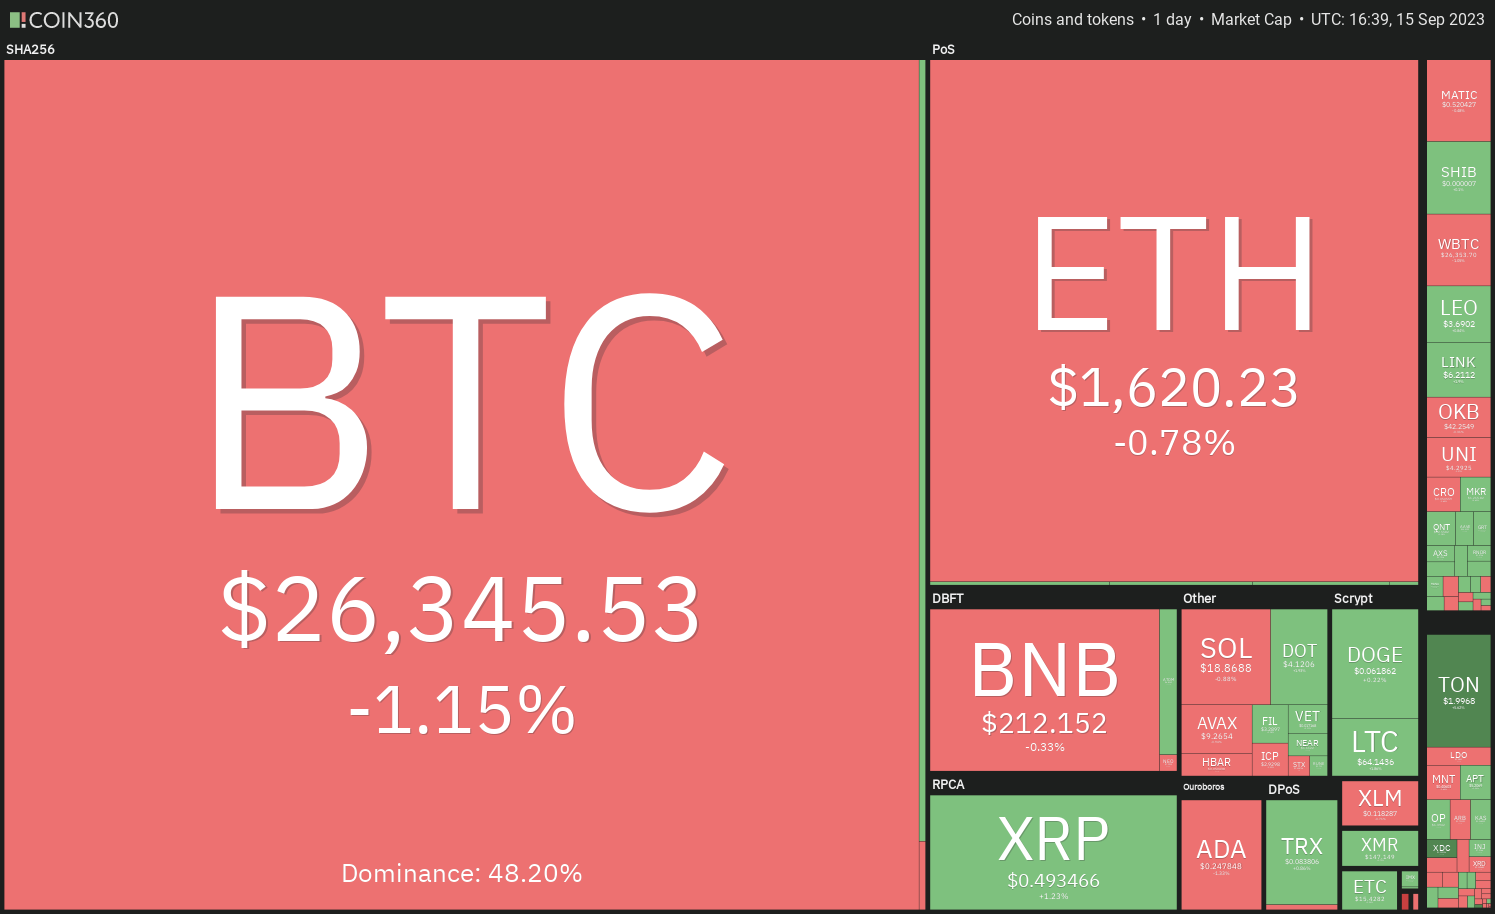 Daily cryptocurrency market performance. Source: Coin360
Traders in the cryptocurrency market have also adopted a cautious stance. A report from Bitfinex indicates that the cryptocurrency sector experienced capital outflows totaling $55 billion in August. This decline in liquidity has led to isolated events having a more pronounced effect on market fluctuations, according to the report.
Will Bitcoin decline and revisit its crucial support? Could Bitcoin’s weakness lead to increased selling pressure in altcoins? Let’s analyze the charts of the top-10 cryptocurrencies to find out.
Bitcoin price analysis
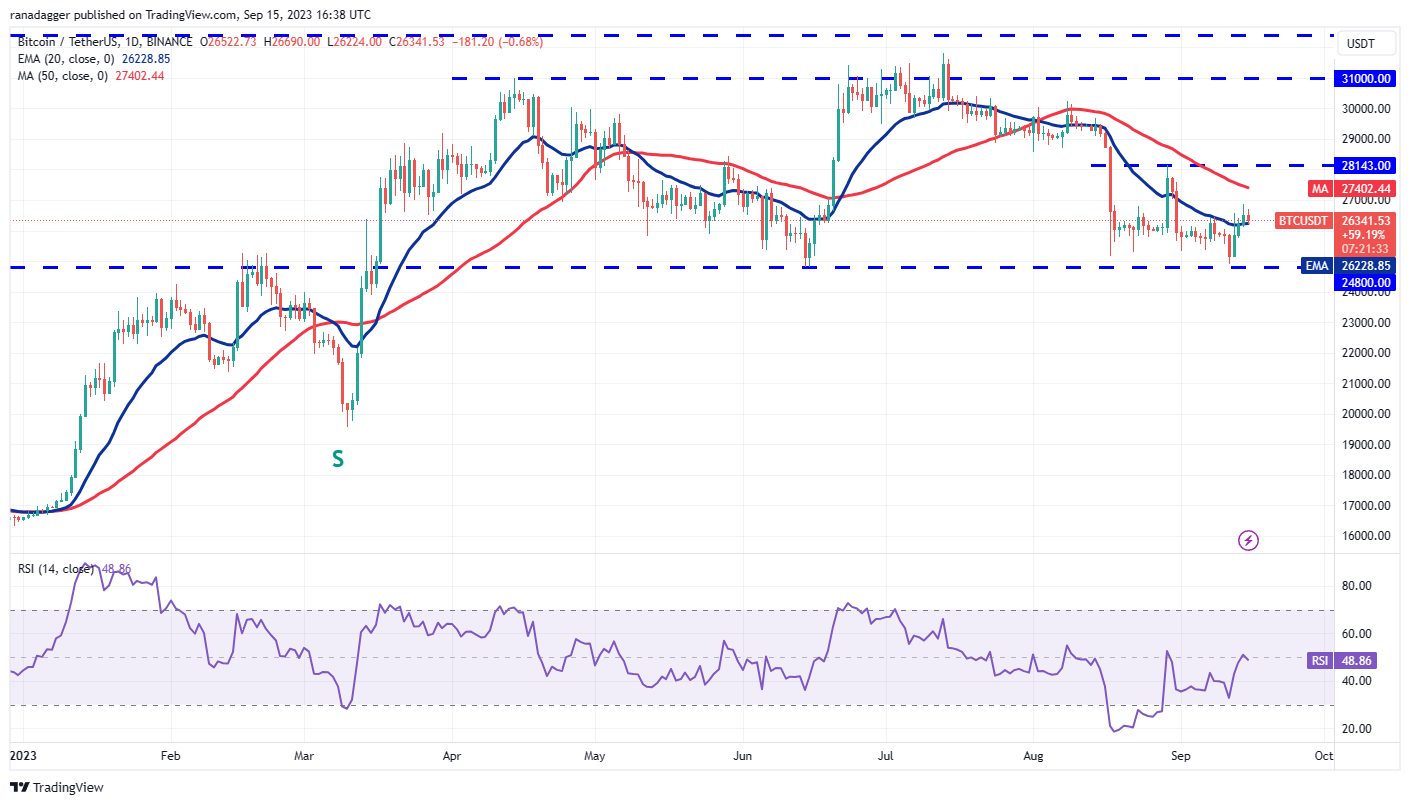
Bitcoin broke above and closed over the 20-day exponential moving average ($26,228) on Sep. 14, suggesting that the downward momentum is diminishing.
 BTC/USDT daily chart. Source: TradingView
The 20-day EMA is leveling off, and the relative strength index (RSI) is hovering near the midpoint, indicating that the BTC/USDT pair may remain range-bound between $24,800 and $28,143 for a while longer.
If bears aim to regain control, they must swiftly drive the price back below the 20-day EMA. Such a move would imply that higher levels are being sold off. This could lead to a retest of the significant support at $24,800.
Ether price analysis
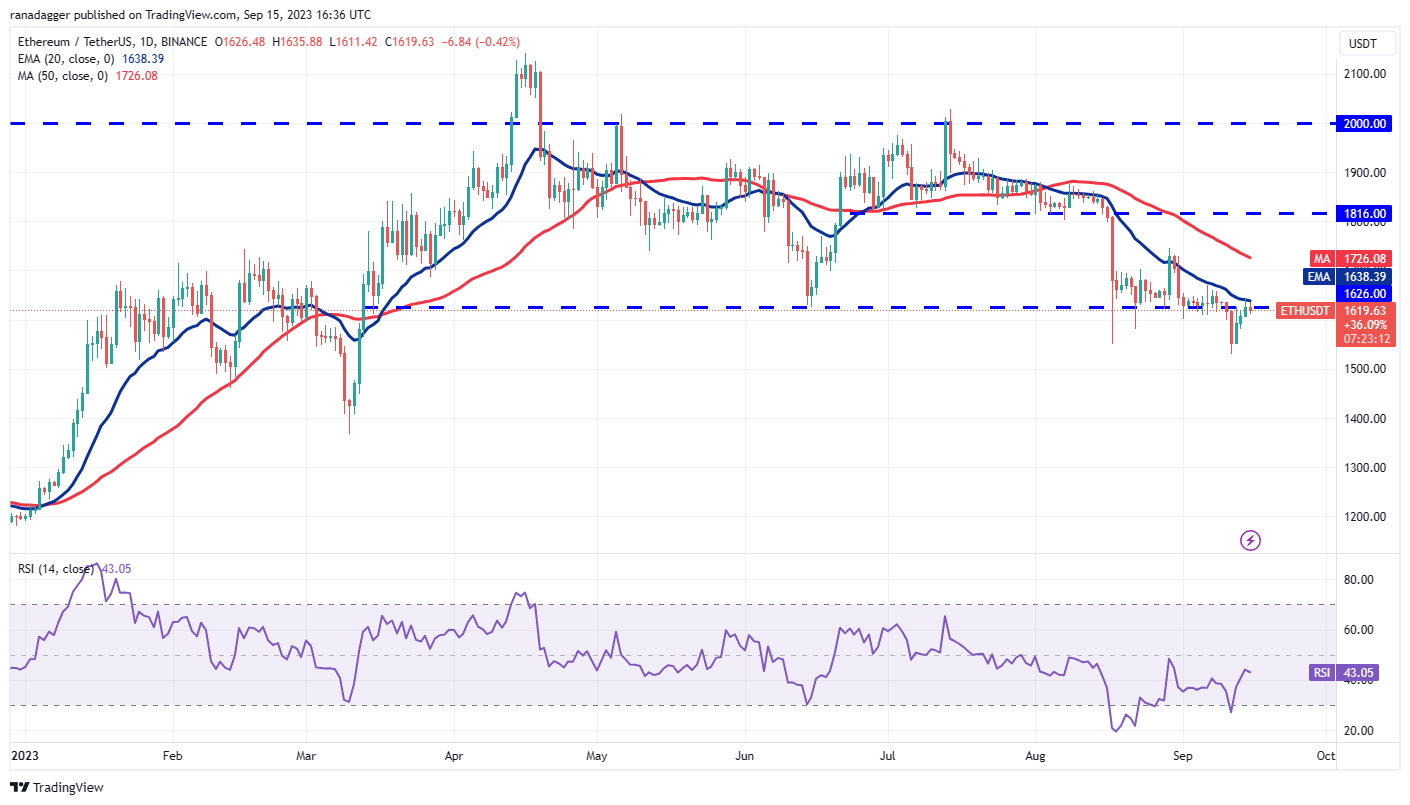
Ether (ETH) fell below the $1,550 support on Sep. 11, but the bears were unable to capitalize on this momentum. This indicates strong buying interest at lower price levels.
 ETH/USDT daily chart. Source: TradingView
The bulls then initiated a recovery, reaching the 20-day EMA ($1,638). This level is expected to see a fierce contest between the bulls and bears. A break and close above the 20-day EMA could ensnare several aggressive bears, resulting in a short squeeze. This could drive the price up to $1,745.
Conversely, if the price declines from the 20-day EMA, it will suggest that the bears are still in control. The sellers will then attempt to push the ETH/USDT pair below $1,550 and continue the downtrend.
BNB price analysis
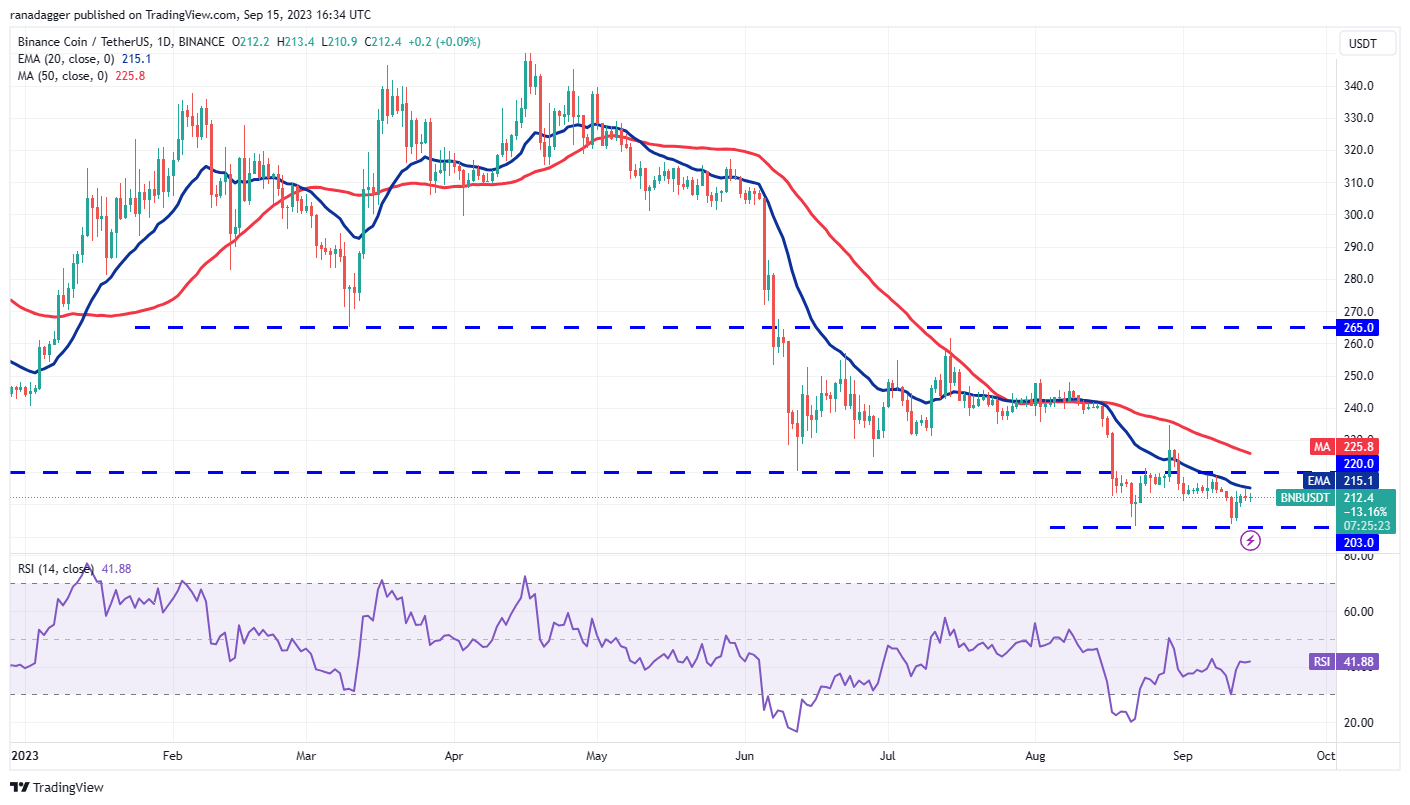
BNB (BNB) rebounded from the psychological support around $200 on Sep. 12, indicating that bulls are active at lower price levels.
 BNB/USDT daily chart. Source: TradingView
The recovery has reached the 20-day EMA ($215), which is a crucial level to monitor. If the BNB/USDT pair declines from the current level, it will suggest that sentiment remains negative and traders are selling during relief rallies. This would heighten the risk of a breakdown below $200.
On the other hand, the RSI is showing a positive divergence, indicating that selling pressure may be easing. A rise above the 20-day EMA could pave the way for a retest of the 50-day SMA ($225).
XRP price analysis
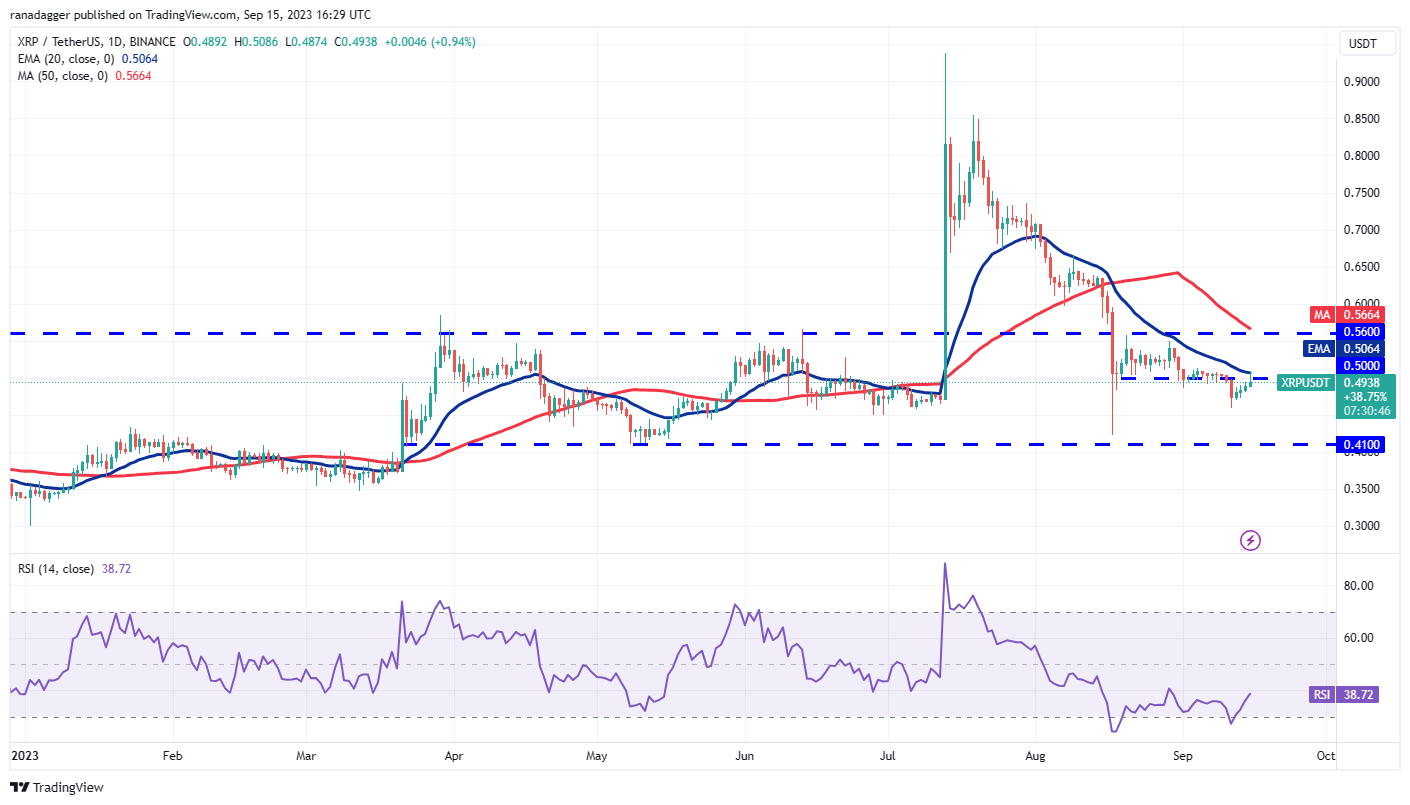
XRP (XRP) has been fluctuating between $0.41 and $0.56 for several days. The price has rebounded to the 20-day EMA ($0.50), which is a significant level to watch.
 XRP/USDT daily chart. Source: TradingView
If buyers push the price above the 20-day EMA, it will indicate that selling pressure is diminishing. This could initiate a sustained recovery toward the overhead resistance at $0.56, which may again serve as a barrier.
If the price declines from $0.56, it will suggest that the range-bound action may persist for a while longer. The next significant move is likely to commence after bulls push the price above $0.56 or bears drive the XRP/USDT pair below $0.41.
Cardano price analysis
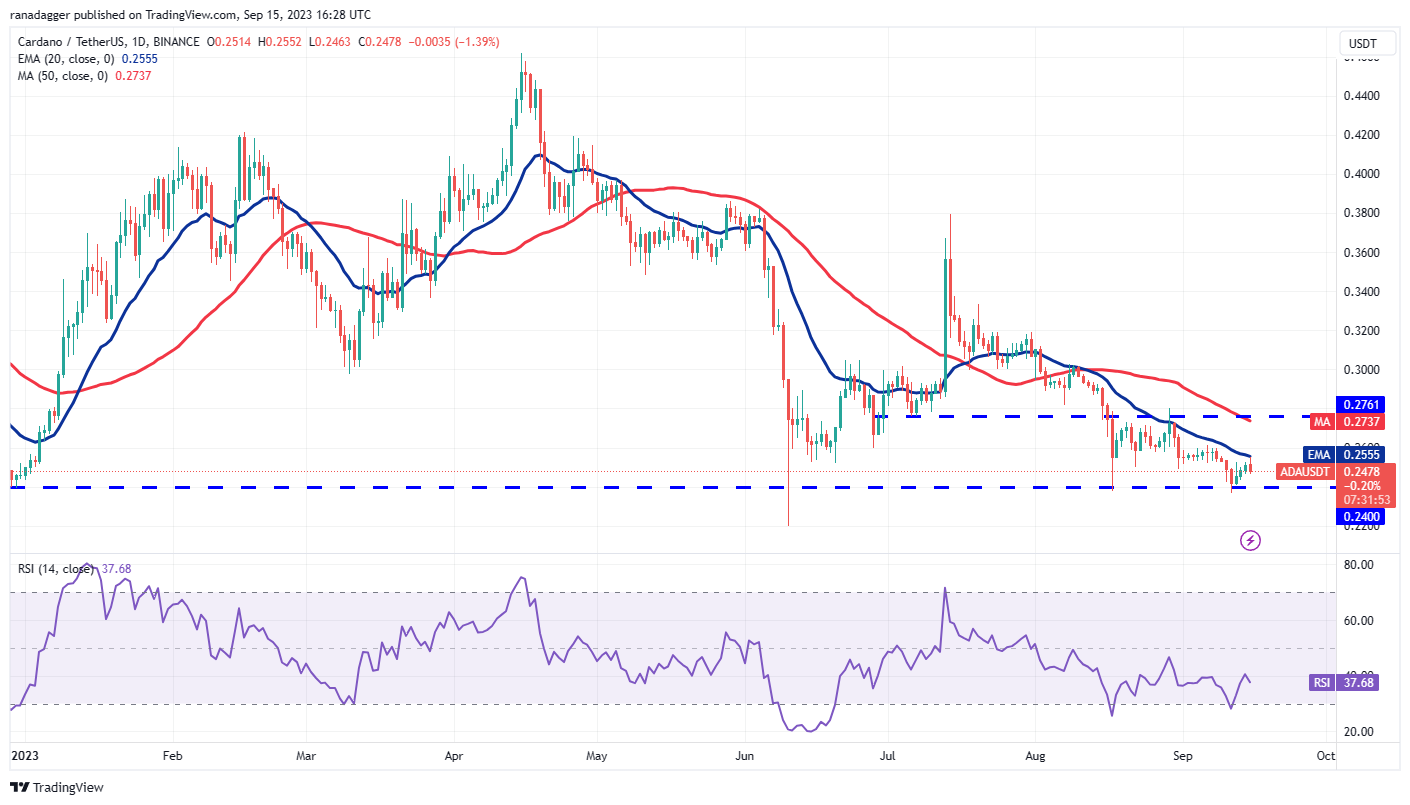
Intense selling in Cardano (ADA) drove the price down to $0.24 on Sep. 11, but the bears were unable to breach the critical support.
 ADA/USDT daily chart. Source: TradingView
Related Posts
The rebound from $0.24 on Sep. 12 reached the 20-day EMA ($0.26) on Sep. 15. This level is likely to see a struggle between buyers and sellers. If the ADA/USDT pair sharply declines from the 20-day EMA, it will indicate that every minor increase is being sold off. This could heighten the risk of a drop to $0.22.
Conversely, if buyers push the price above the 20-day EMA, it will signal the beginning of a stronger recovery toward $0.28.
Dogecoin price analysis
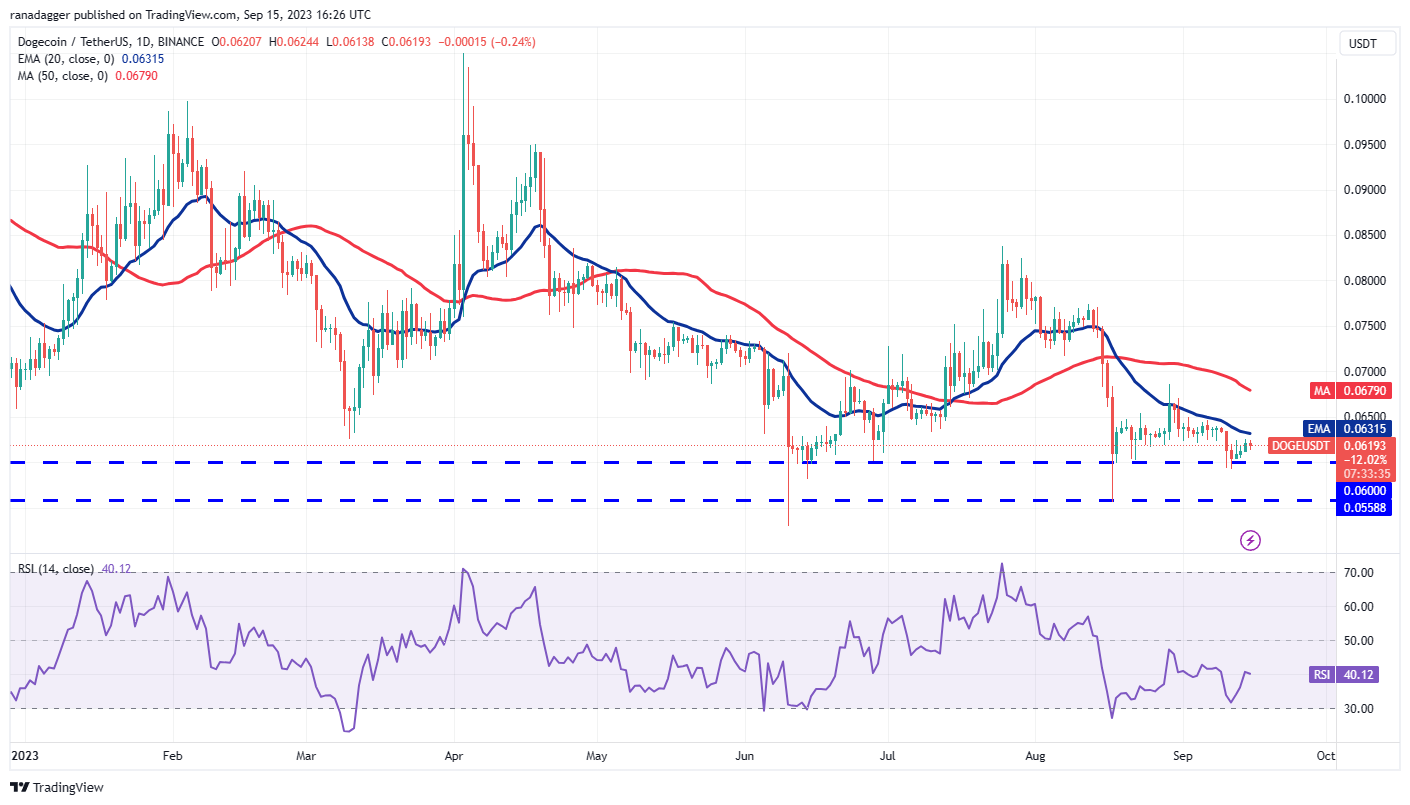
Dogecoin (DOGE) continues to trade between the 20-day EMA ($0.06) and the solid support at $0.06. This narrow-range trading is unlikely to persist for long, and a breakout may occur soon.
 DOGE/USDT daily chart. Source: TradingView
If buyers push the price above the 20-day EMA, it will suggest that sellers may be losing their grip. This could initiate a relief rally to the 50-day SMA ($0.07), where bears are expected to increase selling pressure.
In contrast, if the price sharply declines from the 20-day EMA, it will enhance the likelihood of a break below $0.06. If this support fails, the DOGE/USDT pair may drop to $0.055.
Solana price analysis
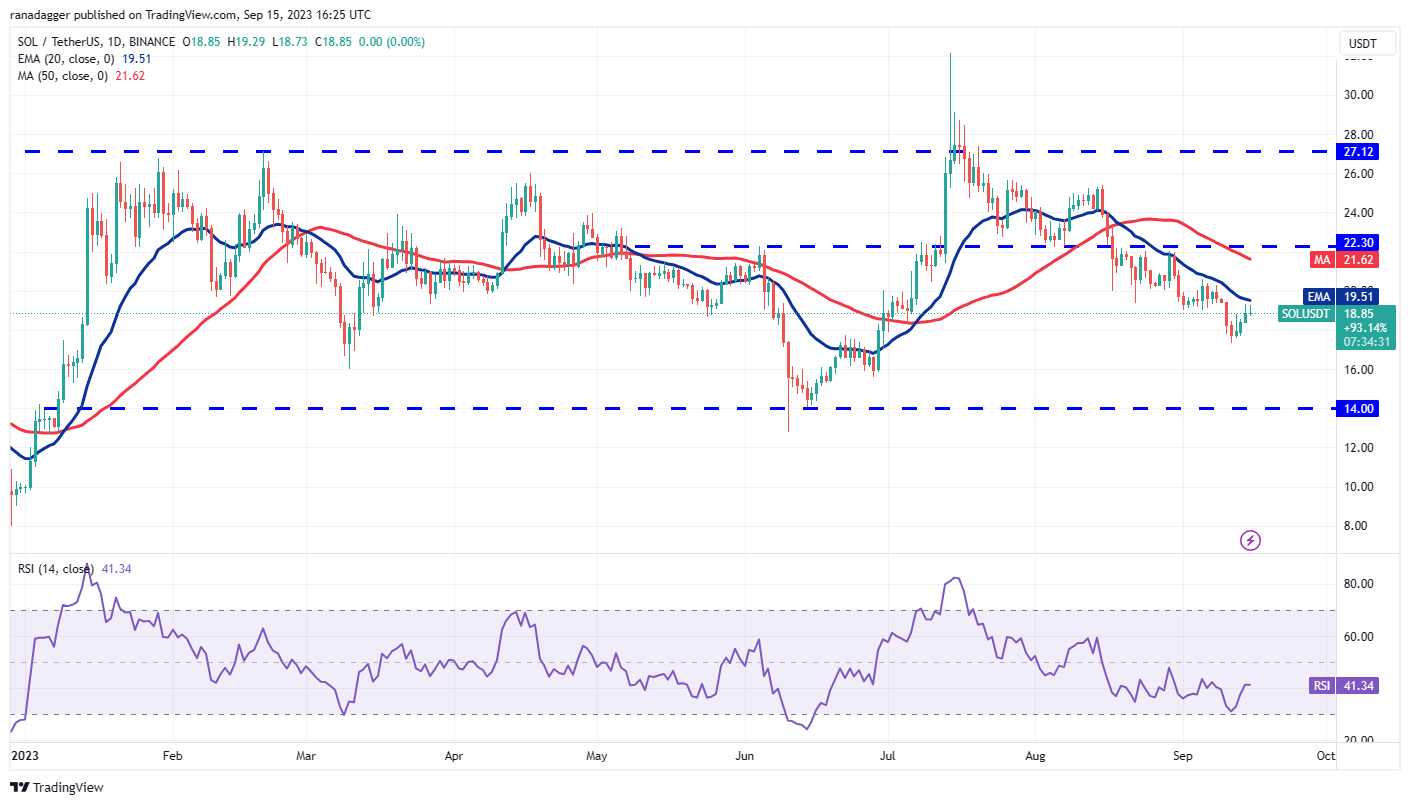
Solana (SOL) has been fluctuating between $14 and $27.12 for several months. The price has reached the 20-day EMA ($19.51), where bears are likely to present a significant challenge.
 SOL/USDT daily chart. Source: TradingView
If buyers push the price above the 20-day EMA, the SOL/USDT pair could reach the overhead resistance at $22.30. This level may again serve as a strong barrier, but if bulls surpass it, the pair could rise to $27.12.
Conversely, if the price declines from the 20-day EMA, it will indicate that demand is waning at higher levels. The bears will then attempt to resume the downtrend and pull the price down to the critical support at $14.
Related: Japan to allow startups to raise funds by issuing crypto instead of stocks: Report
Toncoin price analysis
Toncoin (TON) rebounded from the 20-day EMA ($1.75) on Sep. 12, indicating that bulls are viewing dips as buying opportunities.
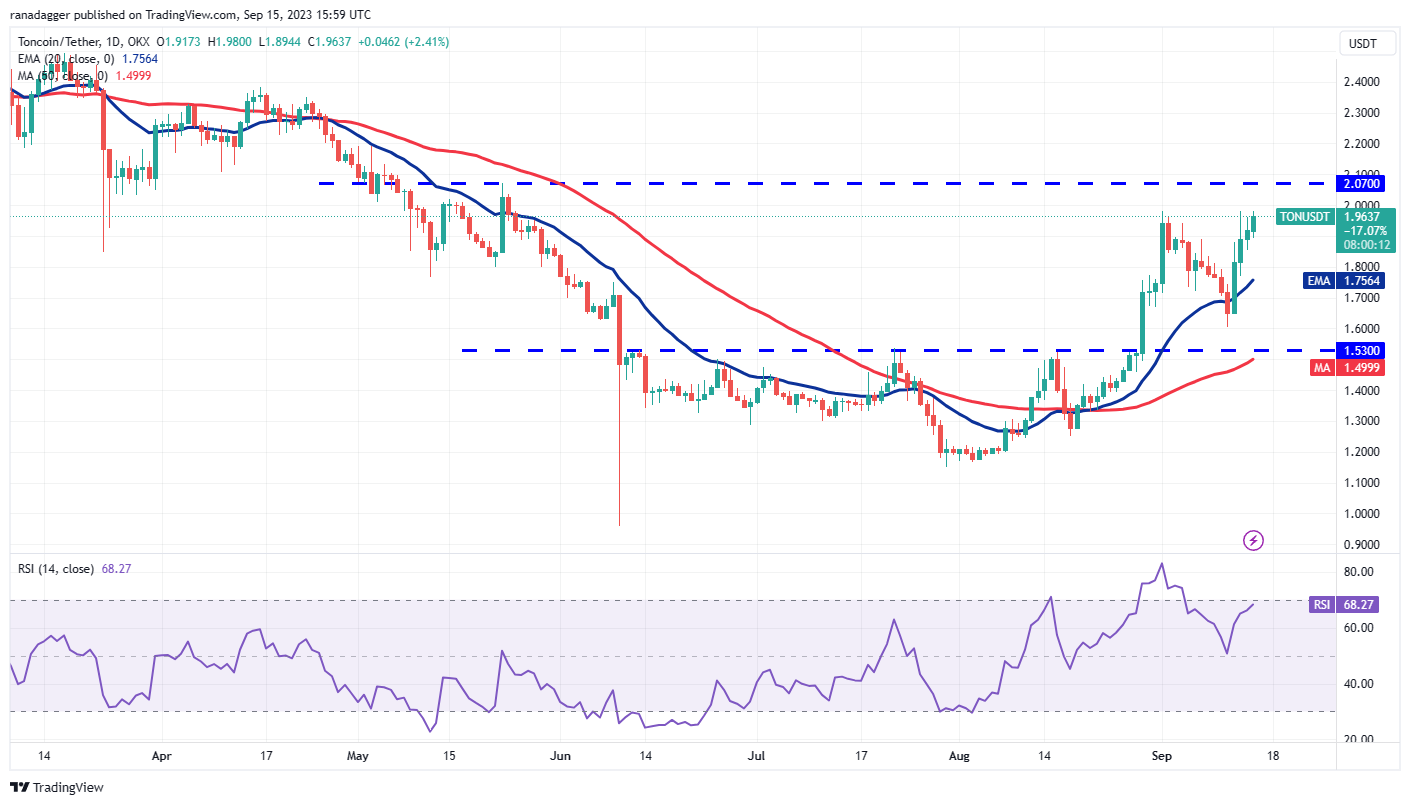 TON/USDT daily chart. Source: TradingView
The price reached the initial resistance at $1.98 on Sep. 13, where bears are attempting to halt the upward movement. A slight advantage for the bulls is that they have not yielded ground to the bears, suggesting that they are not rushing to take profits as they expect the upward trend to persist.
If the $1.98 level is surpassed, the TON/USDT pair could rise to $2.07. This is a critical level for the bears to defend, as a break above it could propel the pair to $2.40. On the downside, a drop below the 20-day EMA could shift the advantage to the bears.
Polkadot price analysis
Polkadot (DOT) has been trading below the breakdown level of $4.22 for several days, which is a negative indicator.
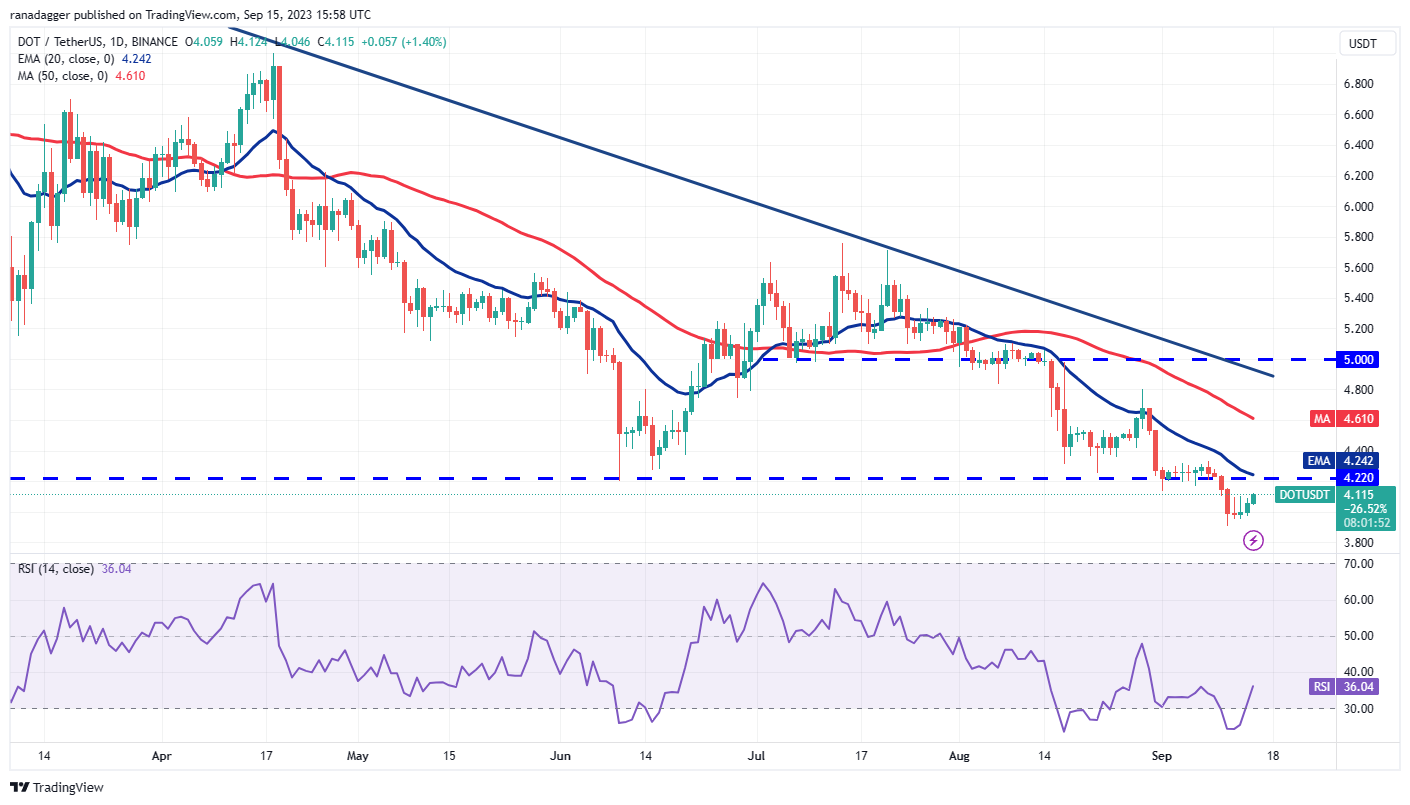 DOT/USDT daily chart. Source: TradingView
The bulls are attempting to initiate a relief rally, but this is likely to encounter strong selling at $4.22. If the price declines from this overhead resistance, it will indicate that bears remain dominant. The sellers will then try to push the DOT/USDT pair below $3.90. If successful, the pair could plummet to $3.44.
If bulls wish to avert a decline, they must push and maintain the price above $4.22. If they achieve this, it will indicate that the markets have rejected the breakdown. The pair may then attempt a rally toward the 50-day SMA ($4.61).
Polygon price analysis
Polygon (MATIC) fell below the critical support at $0.51 on Sep. 11, but the bears could not sustain the selling pressure. This initiated a rebound, which is approaching the 20-day EMA ($0.54).
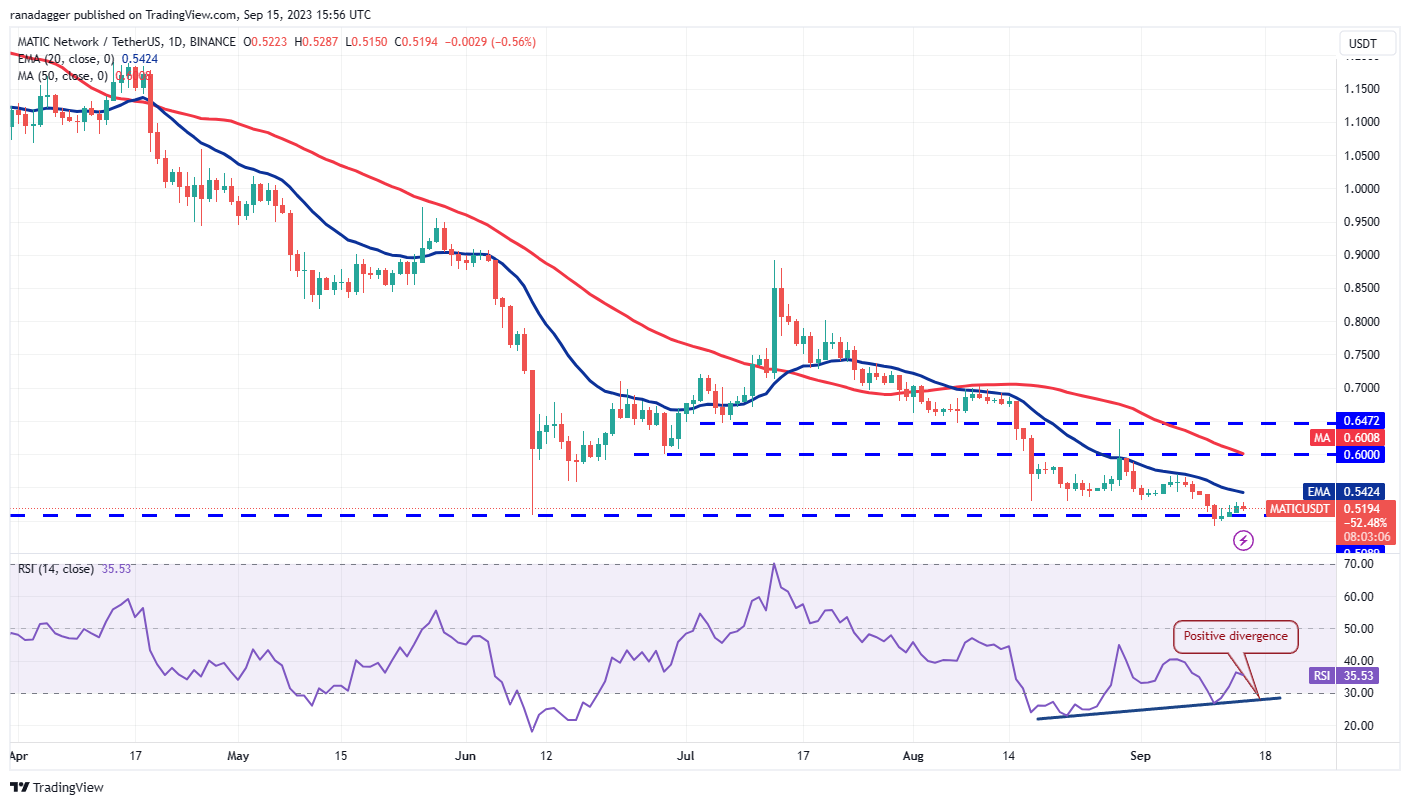 MATIC/USDT daily chart. Source: TradingView
The bears will attempt to halt the recovery at the 20-day EMA and pull the price below $0.50. If they succeed, it will signal the resumption of the downtrend. The MATIC/USDT pair could then decline to $0.45.
Although the downward-sloping moving averages suggest an advantage for bears, the positive divergence on the RSI indicates that bearish momentum may be waning. If buyers overcome the hurdle at the 20-day EMA, the pair may rise to $0.60.
This article does not contain investment advice or recommendations. Every investment and trading move involves risk, and readers should conduct their own research when making a decision.