Disclaimer: Information found on CryptoreNews is those of writers quoted. It does not represent the opinions of CryptoreNews on whether to sell, buy or hold any investments. You are advised to conduct your own research before making any investment decisions. Use provided information at your own risk.
CryptoreNews covers fintech, blockchain and Bitcoin bringing you the latest crypto news and analyses on the future of money.
Bitcoin’s bounce from $28,701 on August 7 indicates that lower price points continue to draw in buyers. This recovery has kept the price within a defined range as traders anticipate the onset of a new trend. A recent analysis by ARK Invest notes that “Bitcoin’s volatility reached a six-year low in July.”
Traders who were hoping for a significant movement in either direction have found the ongoing range-bound activity in August to be disappointing. Historically, August and September have shown average movements of 0.73% and -5.01%, respectively, suggesting they may be lackluster months.
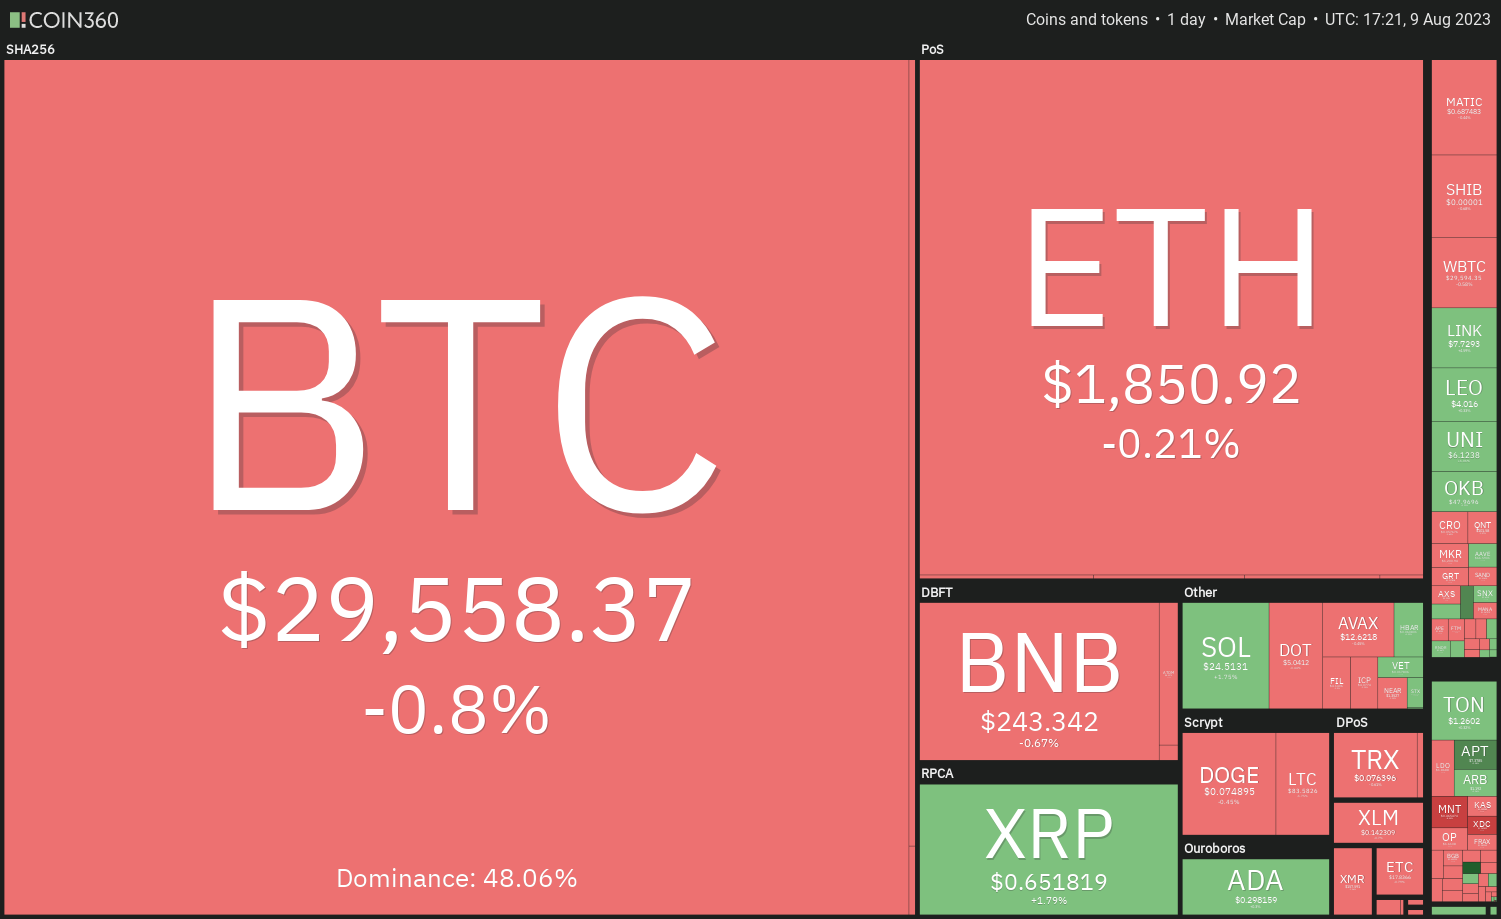 Daily cryptocurrency market performance. Source: Coin360
While the short-term outlook remains uncertain, the long-term perspective appears promising. Galaxy Digital CEO Mike Novogratz, referencing insights from BlackRock and Invesco, mentioned that the first spot Bitcoin (BTC) exchange-traded fund in the United States could receive approval from the Securities and Exchange Commission within four to six months.
This development is anticipated to have a significantly positive impact on the cryptocurrency market. Meanwhile, key resistance levels continue to influence Bitcoin and altcoins. Will bulls manage to overcome these obstacles? Let’s analyze the charts of the top 10 cryptocurrencies to find out.
Bitcoin price analysis
Bitcoin’s robust relief rally from the $28,861 support level indicates that bulls remain active and view price dips as buying opportunities.
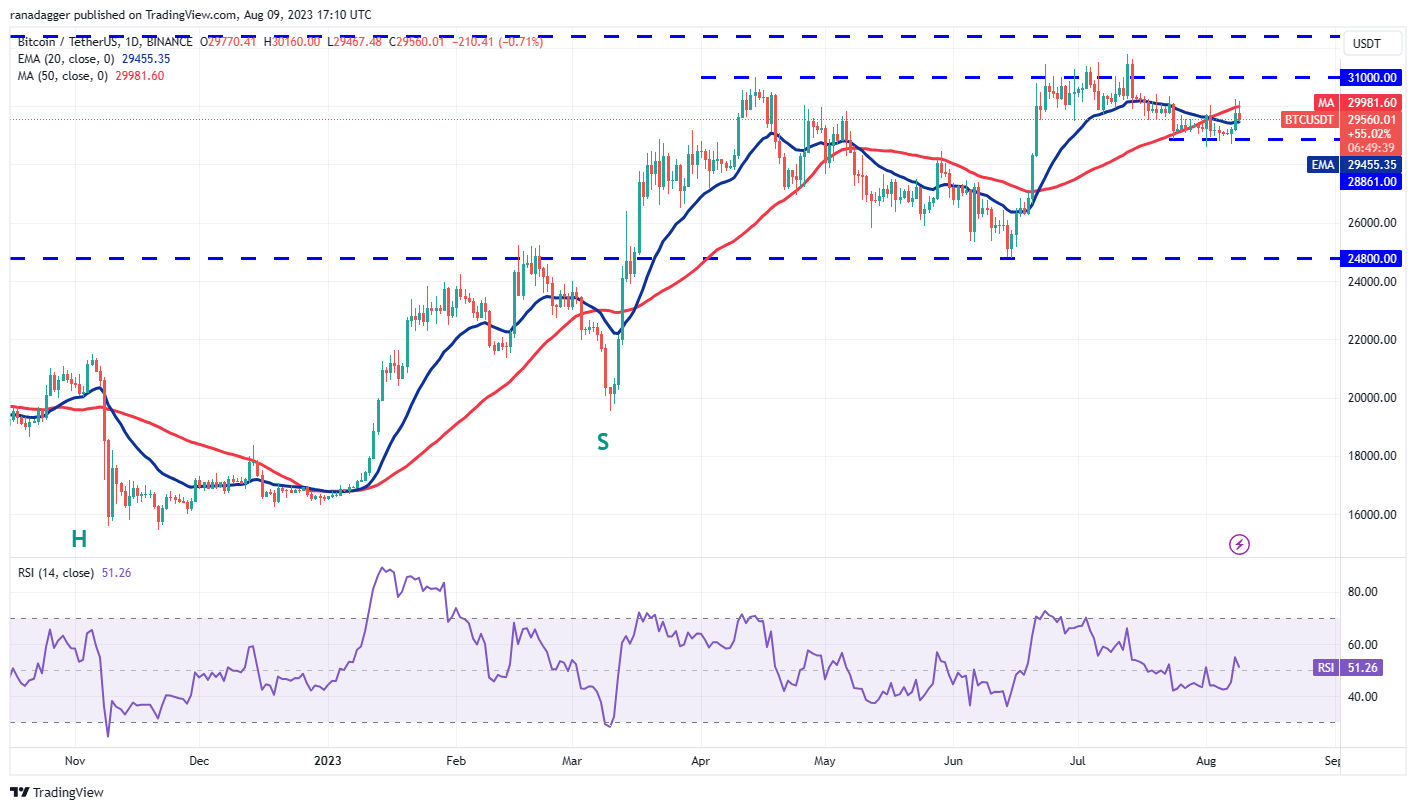 BTC/USDT daily chart. Source: TradingView
The BTC/USDT pair surpassed the 20-day exponential moving average (EMA) of $29,455 on August 8, with bulls attempting to build on this momentum by pushing the price above the 50-day simple moving average (SMA) of $29,981. If successful, the pair could gain momentum and rise toward the resistance zone between $31,804 and $32,400.
Conversely, if the price declines and falls below the 20-day EMA, it would indicate that bears are continuing to sell during rallies. This could result in the pair remaining confined within a narrow range between $28,500 and $30,500 for several days.
Ether price analysis
Buyers stepped in to purchase the dip below the $1,816 support in Ether (ETH) on August 7, followed by another strong move on August 8.
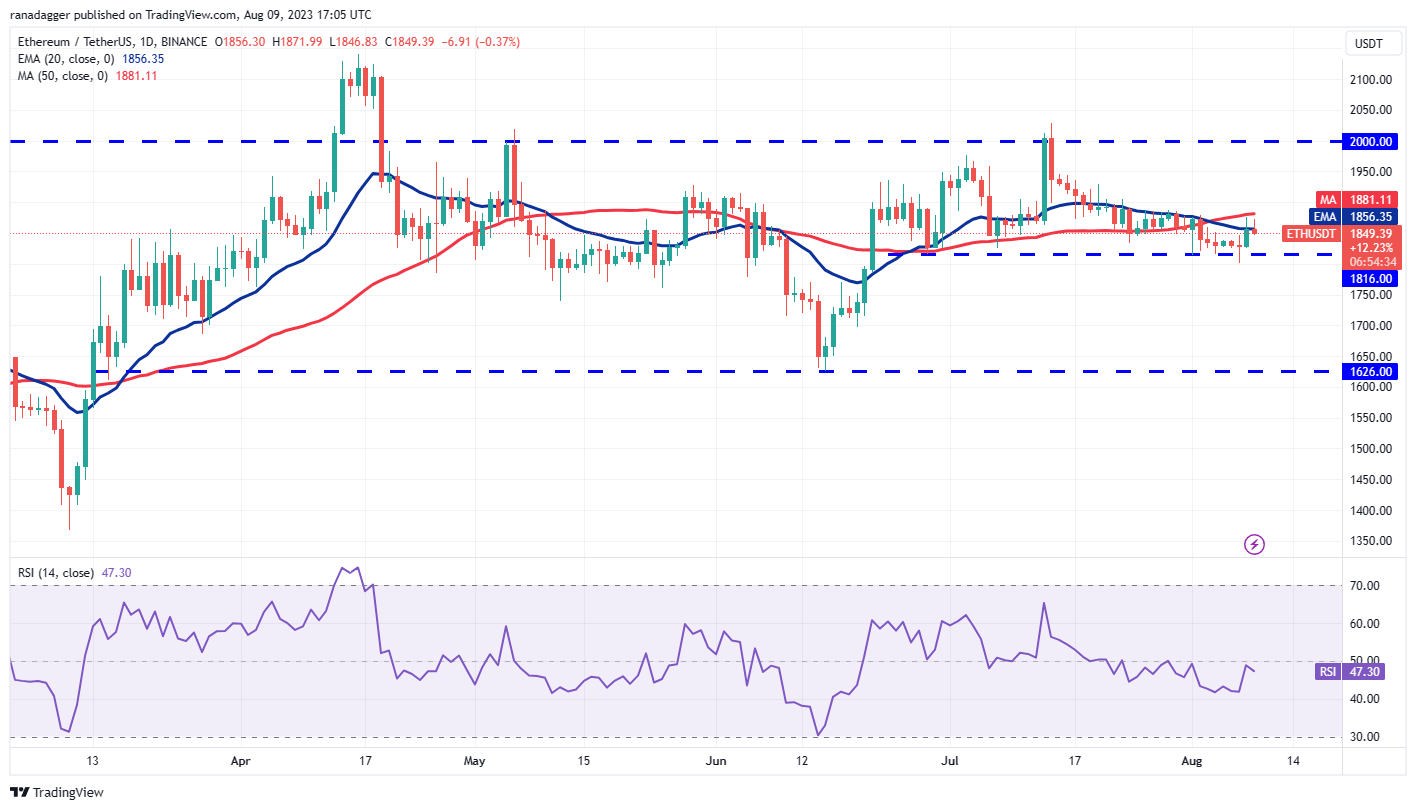 ETH/USDT daily chart. Source: TradingView
The bulls are encountering resistance at the 50-day SMA ($1,881), but a slight positive is that they are attempting to maintain the 20-day EMA. The flattening 20-day EMA and the relative strength index (RSI) near the midpoint indicate that bears may be losing their grip.
If buyers manage to push the price above the 50-day SMA, the ETH/USDT pair could rally to $1,930 and eventually reach the psychologically significant level of $2,000. The bulls will need to surpass this level to initiate the next phase of the upward movement.
The advantage could shift to the bears if they pull the price below the critical short-term support at $1,800.
BNB price analysis
BNB (BNB) rebounded from the moving averages and approached the resistance line of the symmetrical triangle pattern on August 8.
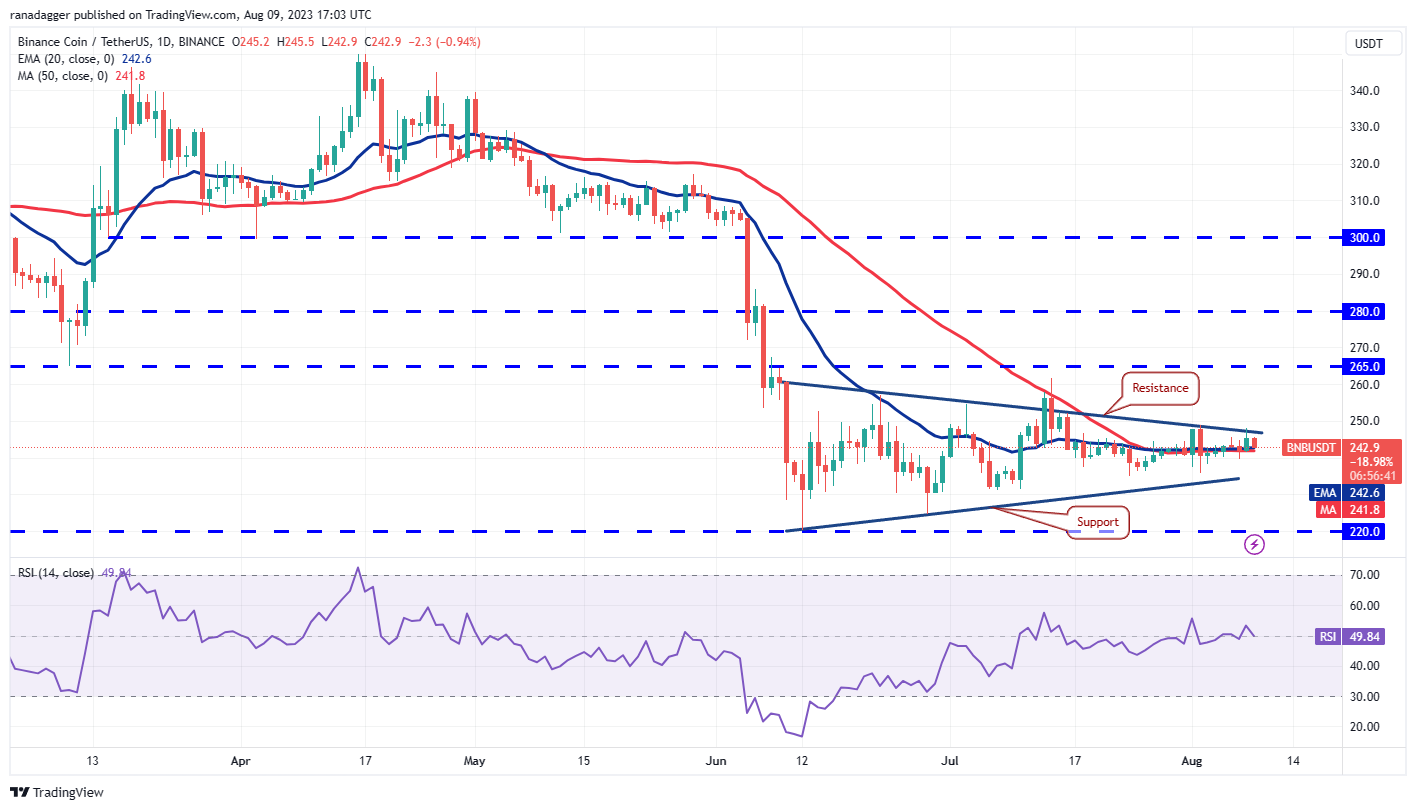 BNB/USDT daily chart. Source: TradingView
The bears are attempting to defend the resistance line, but if bulls prevent the price from sliding back below the moving averages, it will enhance the likelihood of an upside breakout. The BNB/USDT pair could initially rise to $265 and then target the pattern’s objective of $288.
On the other hand, if the price declines and falls below the moving averages, it would suggest that the pair may remain within the triangle for a longer period. A break below the triangle could shift the advantage to the bears, potentially leading to a decline to $220.
XRP price analysis
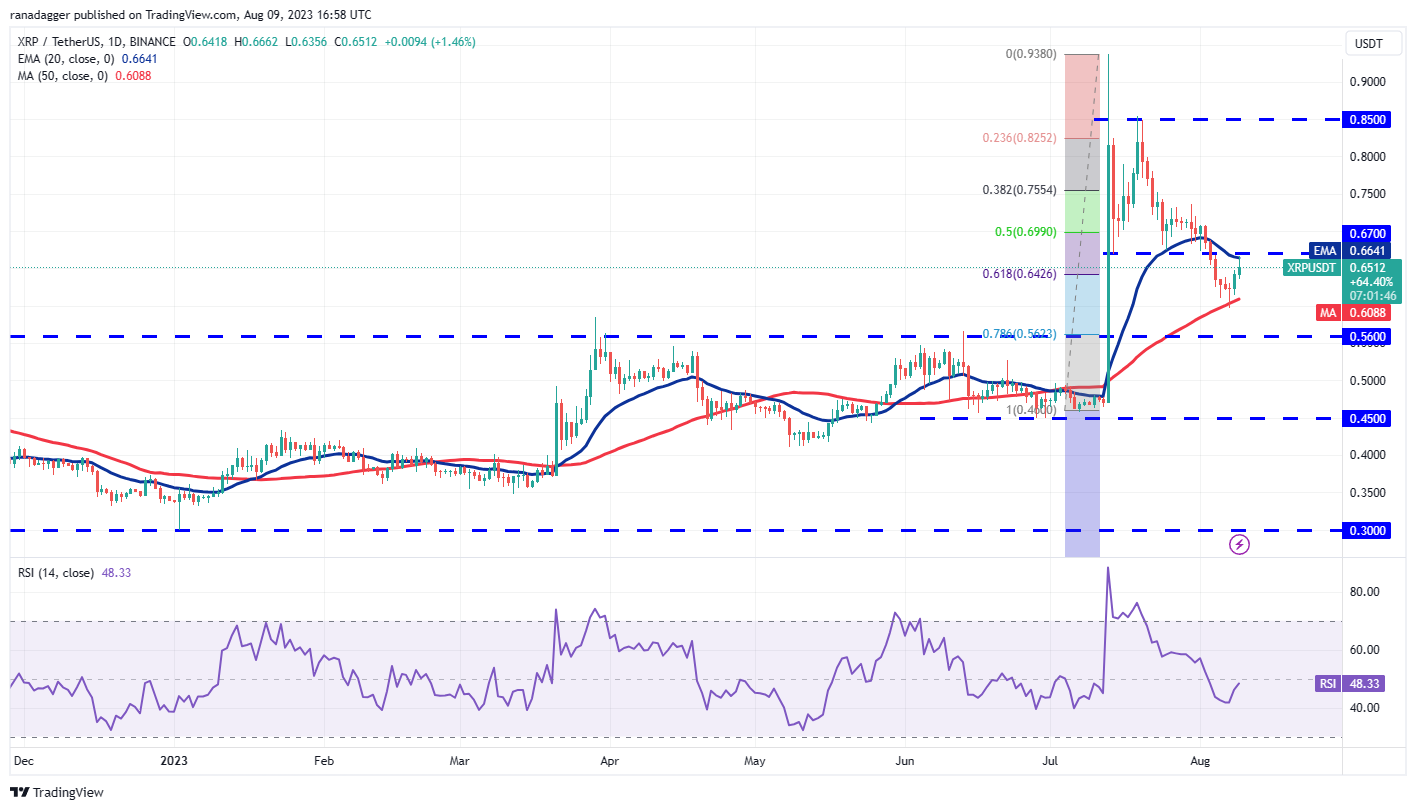
XRP (XRP) reversed from the 50-day SMA ($0.60) on August 7 and reached the 20-day EMA ($0.66) on August 9.
 XRP/USDT daily chart. Source: TradingView
If the price declines from the current level, it would indicate that sentiment has turned negative and traders are selling during rallies. This would increase the chances of a drop to the breakout level of $0.56.
Conversely, if the price rises above the 20-day EMA, it would suggest that bulls are making an effort to recover. The XRP/USDT pair could then rise to $0.73, which may present a significant challenge to overcome.
Dogecoin price analysis
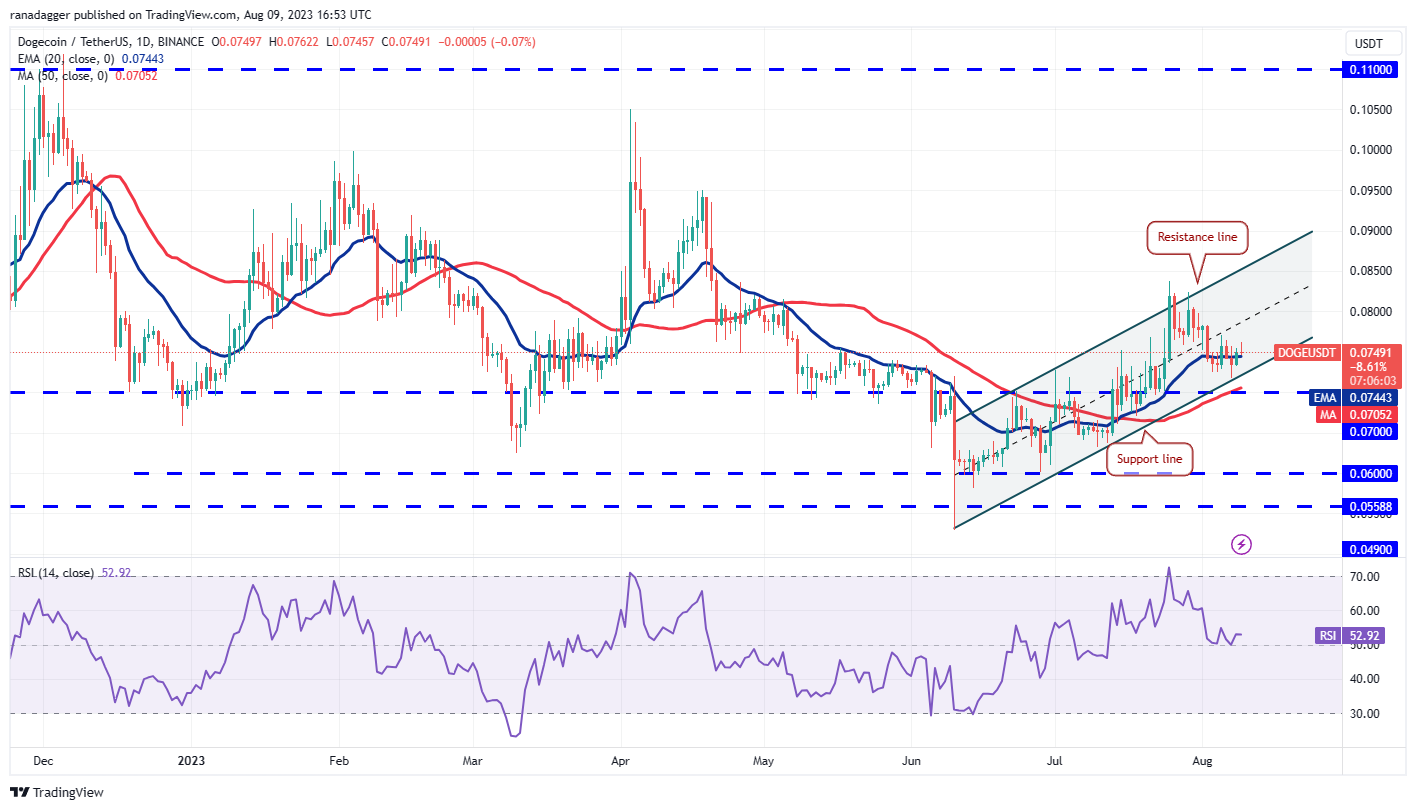
Dogecoin (DOGE) rebounded from the support line of the ascending channel on August 7, demonstrating that bulls continue to buy on dips.
 DOGE/USDT daily chart. Source: TradingView
Related Posts
Buyers pushed the price above the 20-day EMA ($0.07), paving the way for a potential rally to $0.08. This level may prove to be a challenging barrier, but if bulls surpass it, the DOGE/USDT pair could reach the resistance line of the channel.
This optimistic outlook will be negated in the short term if the price declines from the current level or the overhead resistance and falls below the channel. Such a move could drop the pair to $0.07, a critical level to monitor, as a breach could lead to a decline to $0.06.
Cardano price analysis
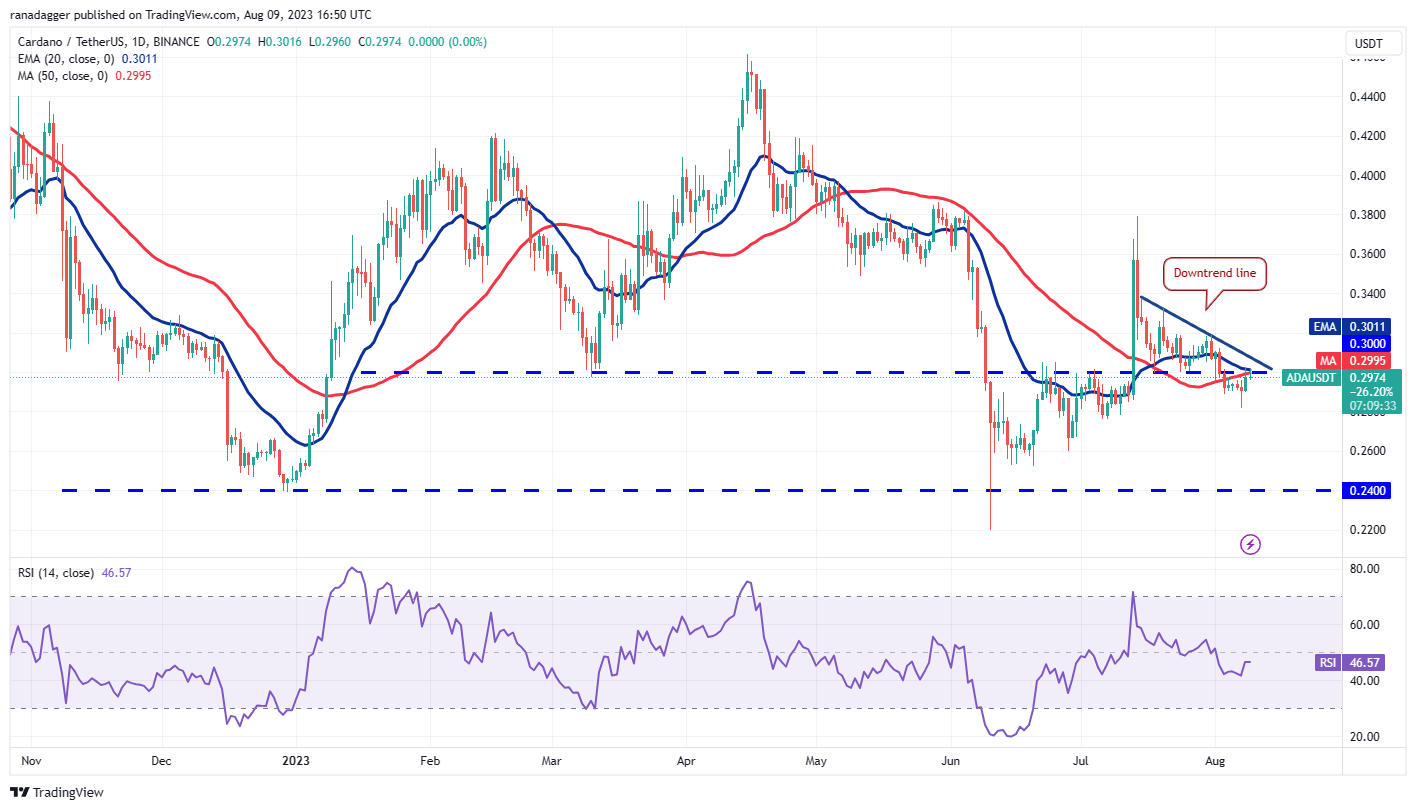
Cardano (ADA) rebounded from $0.28 on August 7, indicating buying interest at lower levels. The price has reached the moving averages, which are situated just below the downtrend line.
 ADA/USDT daily chart. Source: TradingView
Bears are likely to defend the downtrend line vigorously. If the price declines from this level, the ADA/USDT pair could retest the support at $0.28. A break and close below this level could pull the pair down to $0.26 and then to $0.24.
In contrast, if bulls clear the overhead resistance, the pair could rally to $0.34. This level may again act as a barrier, but if bulls overcome it, the pair could reach the overhead resistance at $0.38.
Solana price analysis
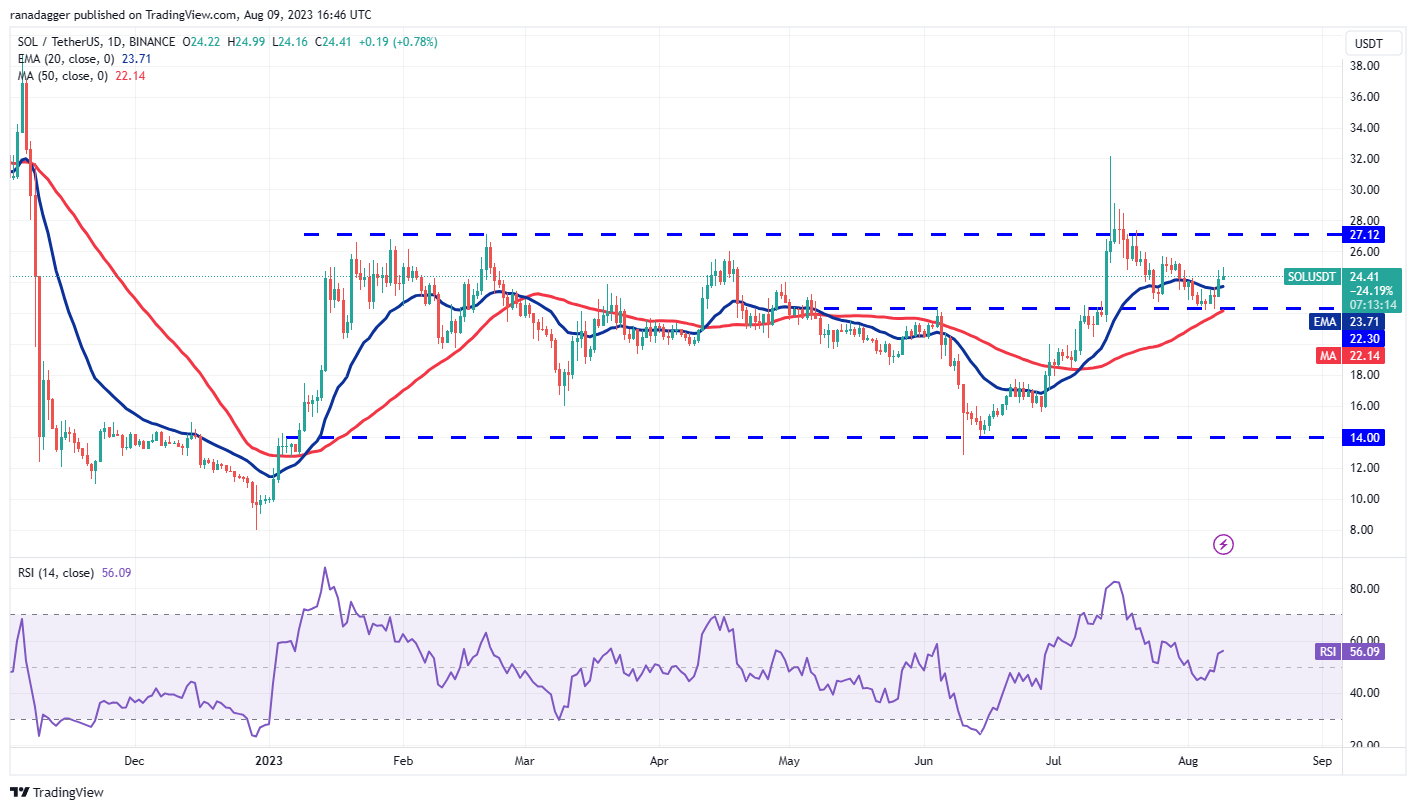
The bulls successfully maintained the support at $22.30, indicating demand at lower levels. Buyers pushed Solana (SOL) above the 20-day EMA ($23.71) on August 8, signaling a potential recovery.
 SOL/USDT daily chart. Source: TradingView
The flat 20-day EMA and the RSI in positive territory suggest a slight advantage for the bulls. The SOL/USDT pair could rise to $25.68 and then face strong resistance at $27.12. Sellers may present a significant challenge at this level.
If the price declines from the overhead resistance, it would indicate that the pair may consolidate between $27.12 and $22.30 for a period. Bears will gain the upper hand if they pull the price below $22.30.
Related: Why is Shiba Inu price up today?
Polygon price analysis
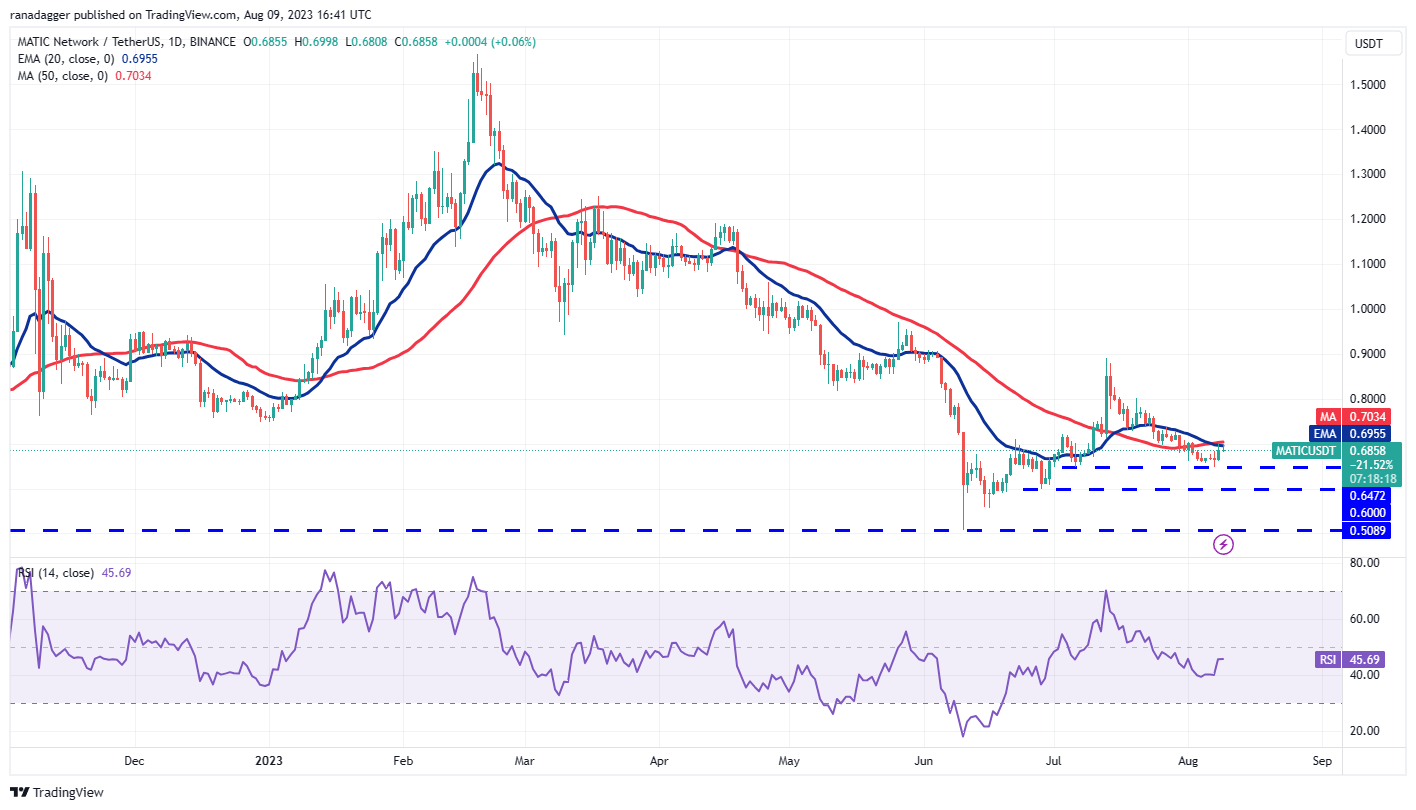
Polygon (MATIC) bounced off the strong support at $0.64 and reached the moving averages, where bears are expected to mount a strong defense.
 MATIC/USDT daily chart. Source: TradingView
If the price declines from the moving averages, the MATIC/USDT pair could once again drop to $0.64. A rebound from this level could keep the pair range-bound between $0.64 and the moving averages for a while. The flat moving averages and the RSI just below the midpoint also indicate potential range-bound activity.
Conversely, if bulls push the price above the moving averages, it would indicate the beginning of a stronger recovery to $0.74 and then to $0.80.
Litecoin price analysis
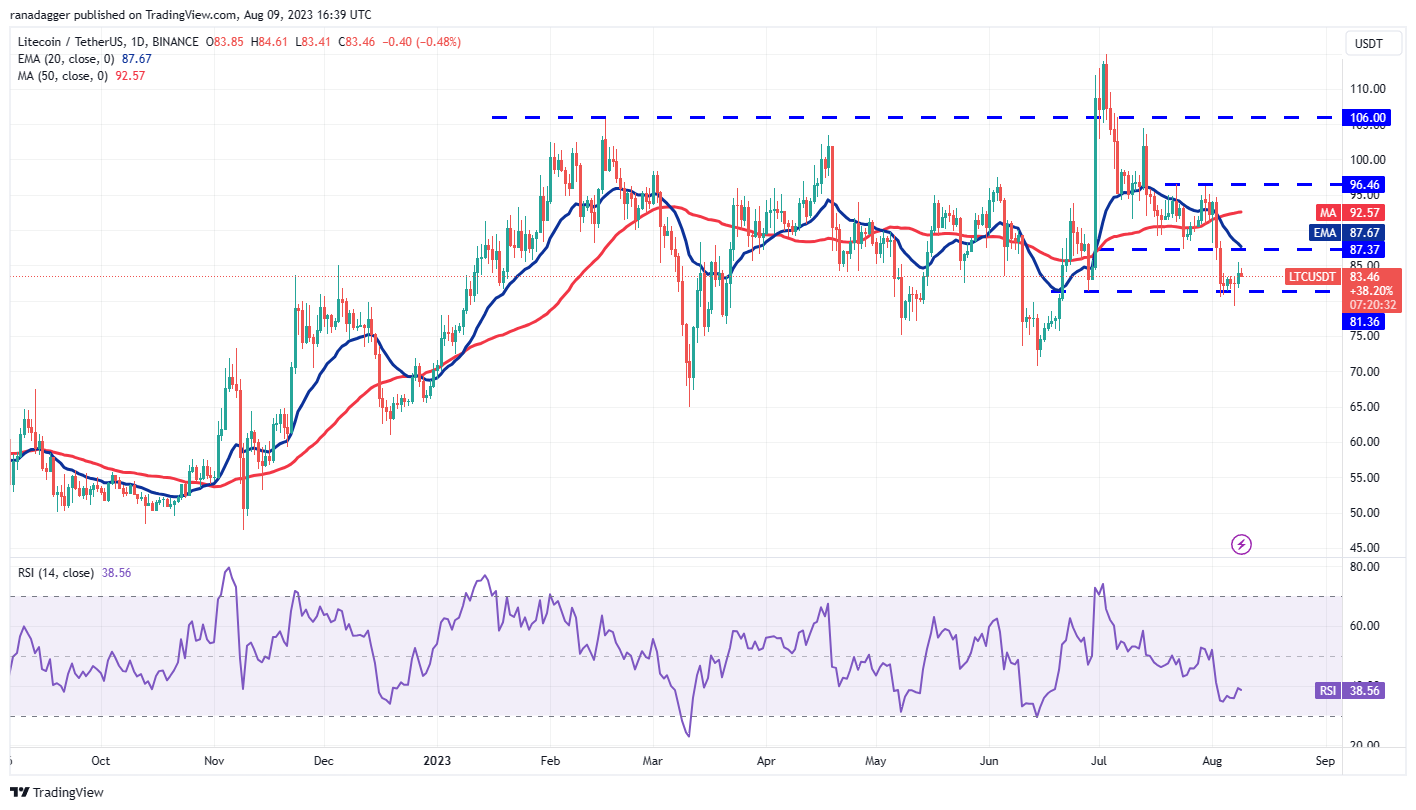
The bears attempted to push Litecoin (LTC) below the support at $81.36 on August 7, but the long tail on the candlestick indicates strong demand at lower levels.
 LTC/USDT daily chart. Source: TradingView
The bulls are attempting to initiate a recovery, which is likely to encounter significant selling pressure near the 20-day EMA ($87). If the price declines from this level, it would suggest that sentiment remains negative and traders are selling during rallies. The bears would then make another attempt to push the LTC/USDT pair below $81.36.
If bulls wish to make a comeback, they will need to push the price above the 20-day EMA. If they succeed, it could open the possibility for a rise to the 50-day SMA ($92) and subsequently to $96.46.
Polkadot price analysis
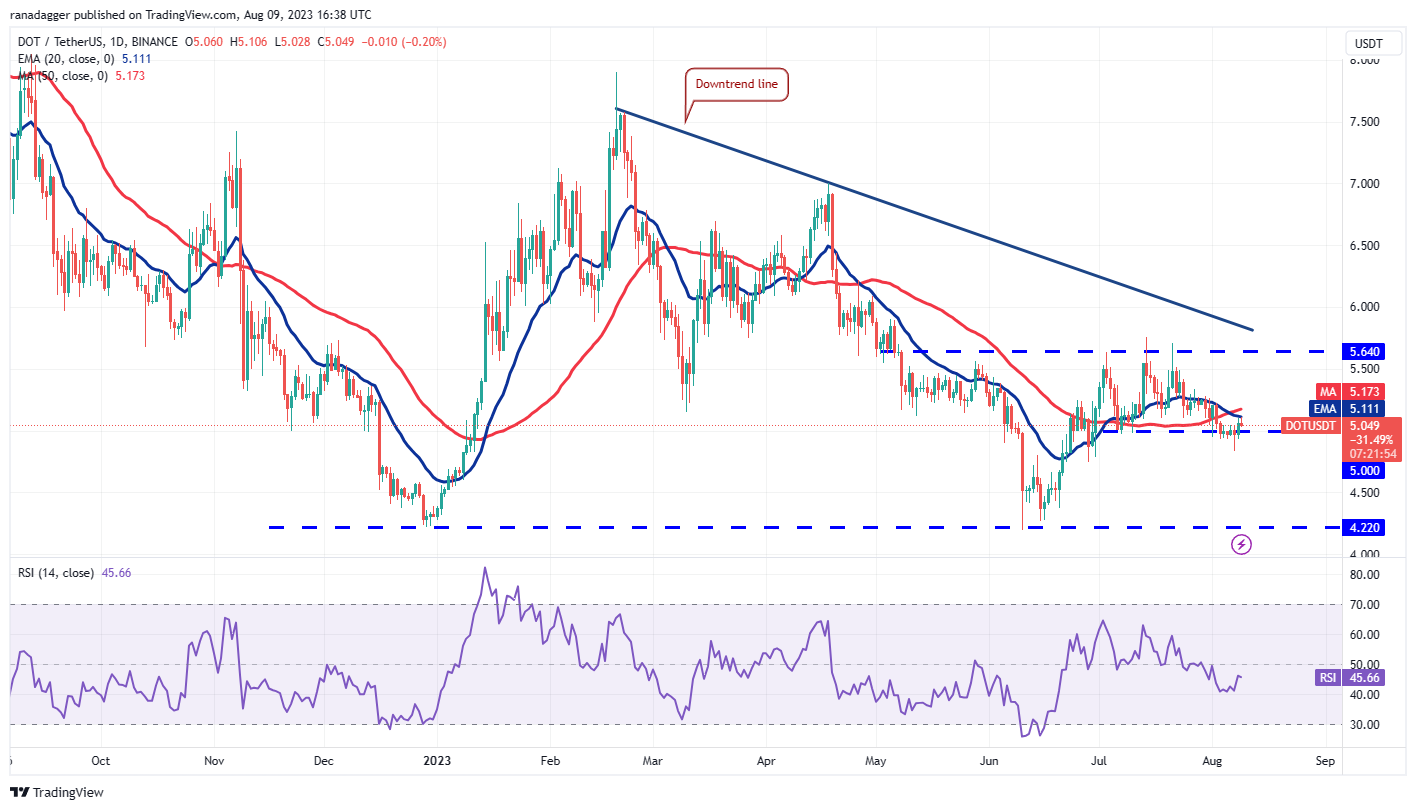
Polkadot (DOT) has been trading within the range of $5 to $5.65 for several days. Attempts to move the price above and below this range have been unsuccessful, indicating that bulls are buying the dips while bears are selling during rallies.
 DOT/USDT daily chart. Source: TradingView
The bulls are trying to push the price above the moving averages but are facing strong resistance from the bears. If the price declines from the moving averages, it would increase the likelihood of a break below $4.83. If that occurs, the DOT/USDT pair could drop to $4.60.
Alternatively, if bulls drive the price above the moving averages, it would indicate that the range remains intact. The pair could rise to $5.33 and subsequently to the overhead resistance at $5.64.
This article does not contain investment advice or recommendations. Every investment and trading move involves risk, and readers should conduct their own research when making a decision.