Disclaimer: Information found on CryptoreNews is those of writers quoted. It does not represent the opinions of CryptoreNews on whether to sell, buy or hold any investments. You are advised to conduct your own research before making any investment decisions. Use provided information at your own risk.
CryptoreNews covers fintech, blockchain and Bitcoin bringing you the latest crypto news and analyses on the future of money.
Bitcoin (BTC) has been hovering around the $29,000 mark for several days. This indicates a weak demand at elevated levels, but the only comfort for the bulls is that they have managed to keep the price above the immediate support.
The ambiguity regarding the next directional shift may have encouraged short-term traders to realize profits. CoinShares reported in its latest weekly update that Bitcoin investment products experienced $111 million in outflows, marking the largest weekly outflow since March.
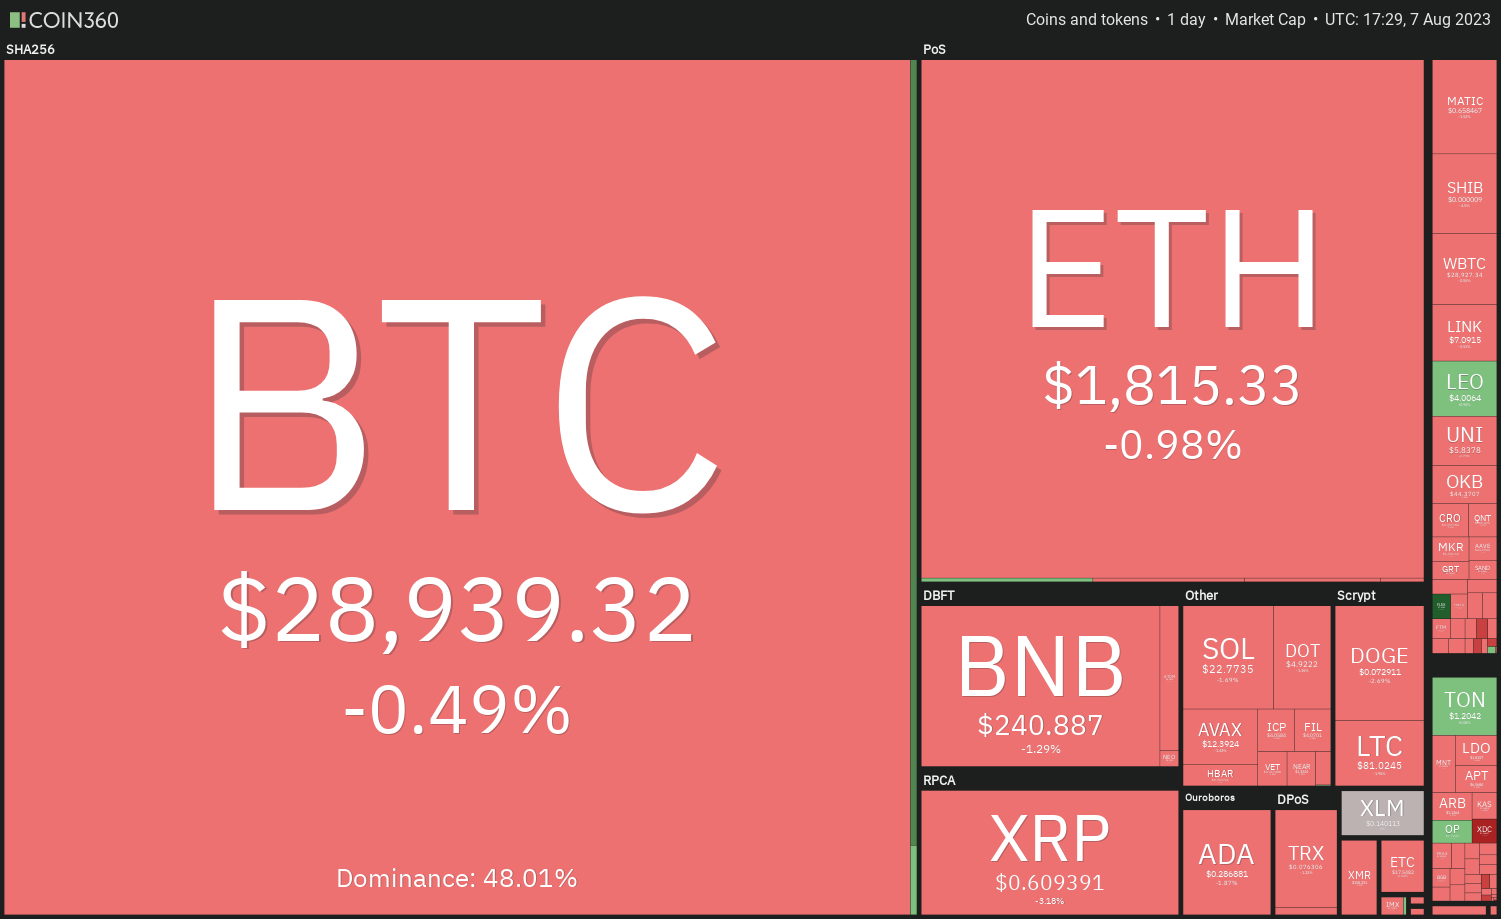 Daily cryptocurrency market performance. Source: Coin360
While the short-term price movements remain lackluster, crypto bulls maintain optimism that Bitcoin will surge ahead of its next halving in 2024. Blockstream CEO Adam Back stated in a discussion on X (formerly Twitter) that Bitcoin is expected to reach $100,000 by the end of March.
Will Bitcoin continue its downward trend in the near future, or will it reverse? Will altcoins outperform Bitcoin in the coming days? Let’s examine the charts to uncover the answers.
S&P 500 Index price analysis
The S&P 500 Index (SPX) is currently experiencing a fierce contest between bulls and bears near the 20-day exponential moving average (4,511). Sellers pushed the price below the 20-day EMA on Aug. 2, signaling a decline in bullish momentum.
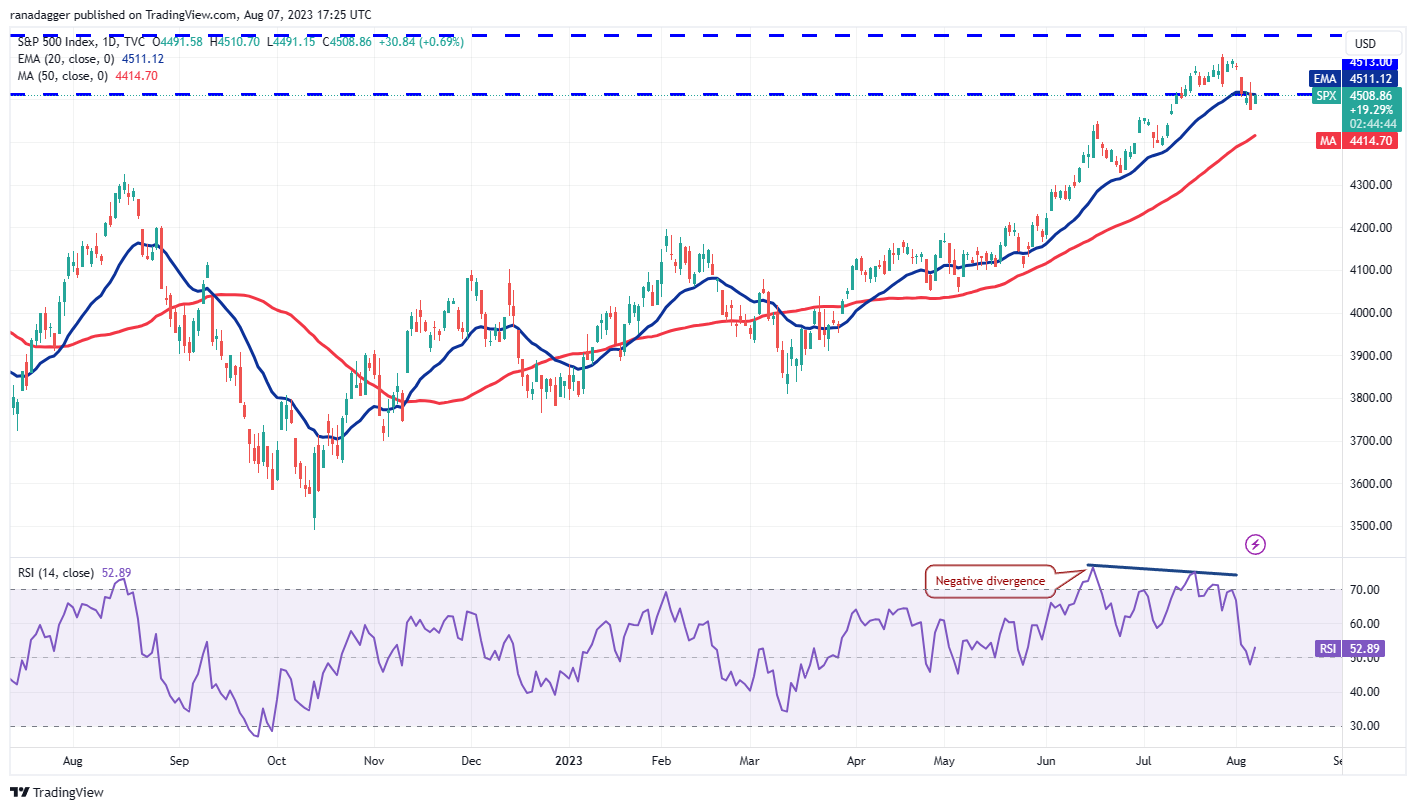 SPX daily chart. Source: TradingView
The bulls managed to drive the price back above the 20-day EMA on Aug. 4, but the bears aggressively sold into the rally. This indicates that bears are capitalizing on relief rallies. The index may drop to the 50-day simple moving average (4,414), which could serve as a robust support level.
The 20-day EMA is flattening, and the relative strength index (RSI) is hovering near the midpoint, suggesting a balance between supply and demand. If the price rebounds off the 50-day SMA, it will indicate that lower levels continue to attract buyers. The index may then oscillate between the 50-day SMA and 4,650 for a period.
U.S. dollar index price analysis
Buyers pushed the U.S. dollar index (DXY) above the 50-day SMA (102) on Aug. 2, but they were unable to maintain this strength.
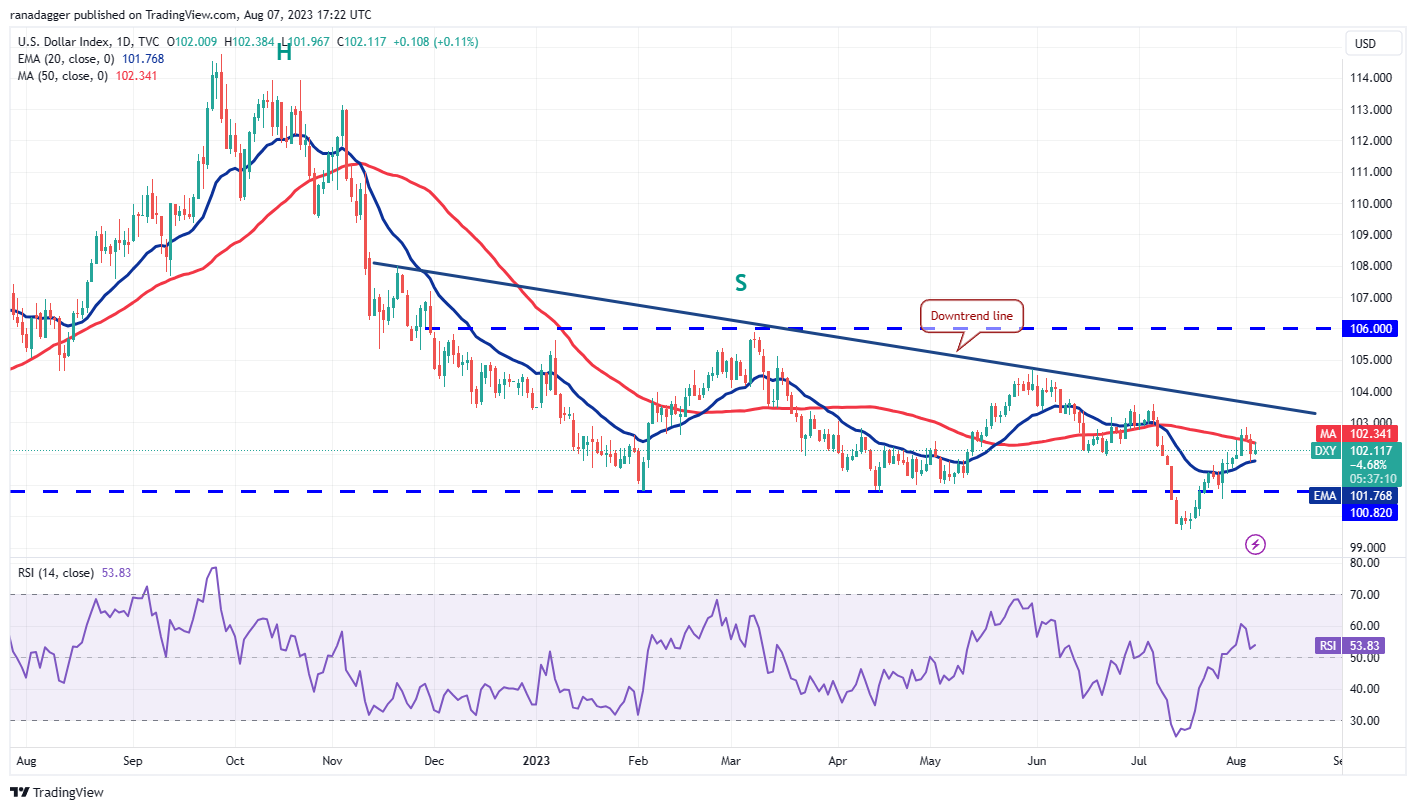 DXY daily chart. Source: TradingView
The bears pulled the price back below the 50-day SMA on Aug. 4. A slight positive is that the bulls have kept the price above the 20-day EMA (101). If buyers manage to push the price above the 50-day SMA, the index could retest the downtrend line. This remains a crucial level to monitor on the upside, as a breakout above it could pave the way for a rally to 106.
If bears wish to gain control, they will need to drive and maintain the price below the 20-day EMA. The index could then decline to the strong support at 100.82.
Bitcoin price analysis
Bitcoin’s price is being squeezed between the 20-day EMA ($29,387) and the horizontal support at $28,861. This period of low volatility is likely to be succeeded by an increase in volatility.
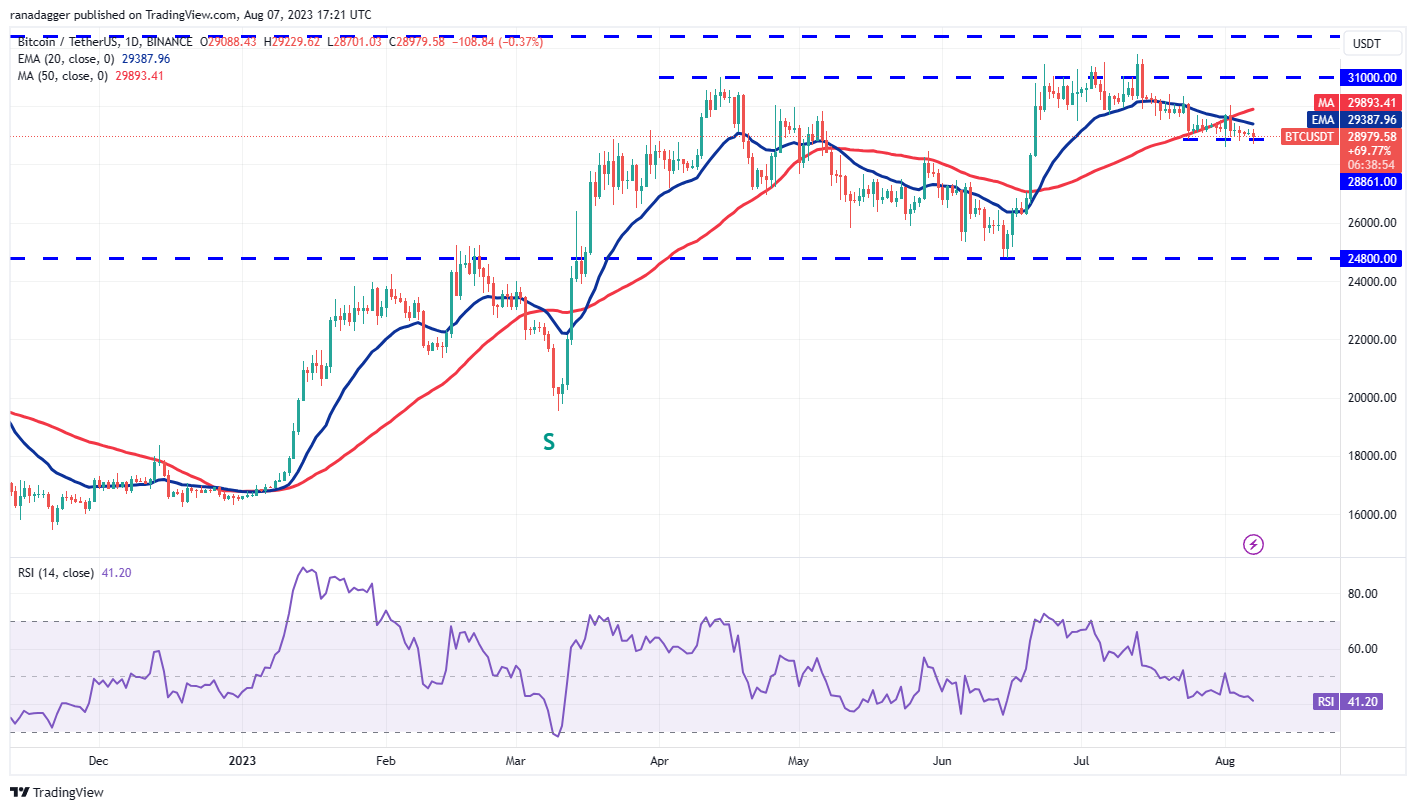 BTC/USDT daily chart. Source: TradingView
If the price drops and remains below $28,861, it will indicate that the uncertainty has tilted in favor of the bears. The BTC/USDT pair could then begin a decline to $26,000 and ultimately to $24,800.
On the other hand, if the price rises and breaks above the 50-day SMA ($29,893), it will suggest that the bulls have gained the upper hand over the bears. This could initiate a rally toward the resistance zone between $31,500 and $32,400.
Ether price analysis
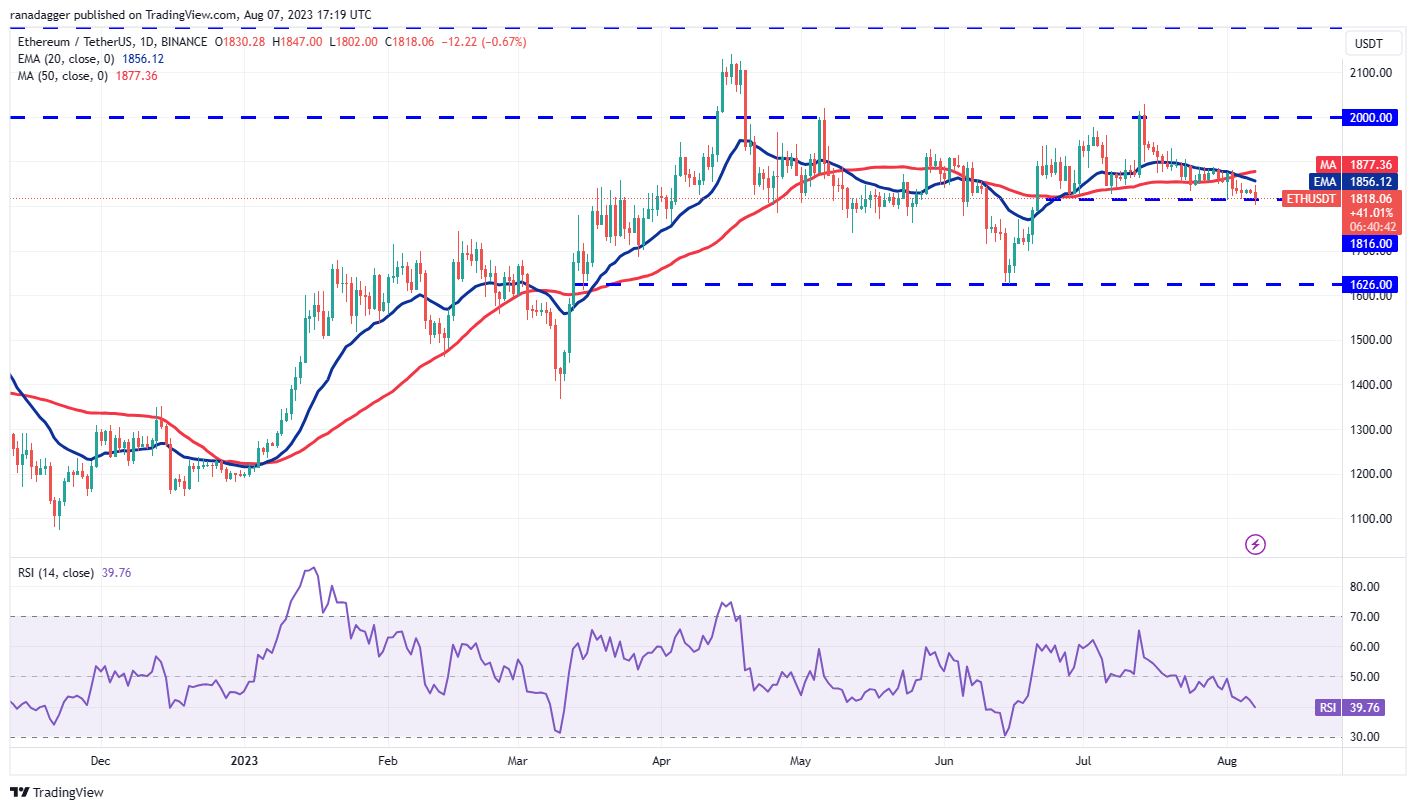
The bulls have managed to keep Ether (ETH) above the immediate support at $1,816 for the past few days, but they are struggling to initiate a significant recovery. This indicates that demand is waning at higher levels.
 ETH/USDT daily chart. Source: TradingView
The declining 20-day EMA ($1,856) and the RSI in negative territory suggest that bears hold the advantage. If the price falls and remains below $1,816, the ETH/USDT pair could drop to $1,700 and then to the critical support at $1,626.
If bulls aim to stage a comeback, they must swiftly push the price above the 50-day SMA ($1,877). If successful, the pair could begin its ascent toward the resistance at $2,000.
BNB price analysis
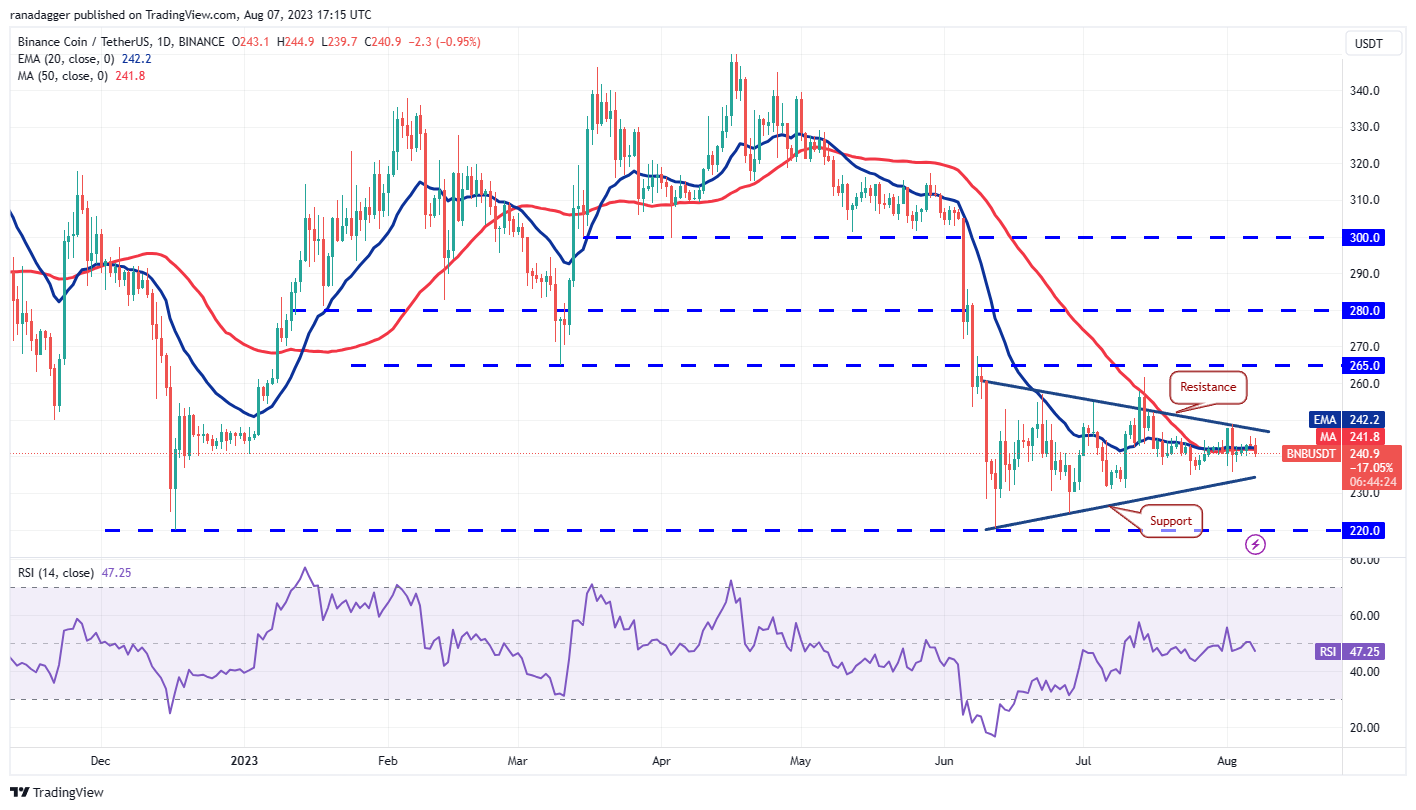
The price movement within a symmetrical triangle pattern is typically erratic and volatile. BNB (BNB) has been fluctuating within the triangle without a clear advantage for either bulls or bears.
 BNB/USDT daily chart. Source: TradingView
Generally, the symmetrical triangle acts as a continuation pattern, but it can also initiate a reversal in certain instances.
Related Posts
If the price breaks above the triangle, it will indicate that bulls have taken control. The BNB/USDT pair could then rise to the resistance at $265. If this level is surpassed, the pair may surge to $288.
Alternatively, if the price falls below the triangle, the pair may decline to $220. If this support level fails, the pair may drop to the pattern target of $194.
XRP price analysis
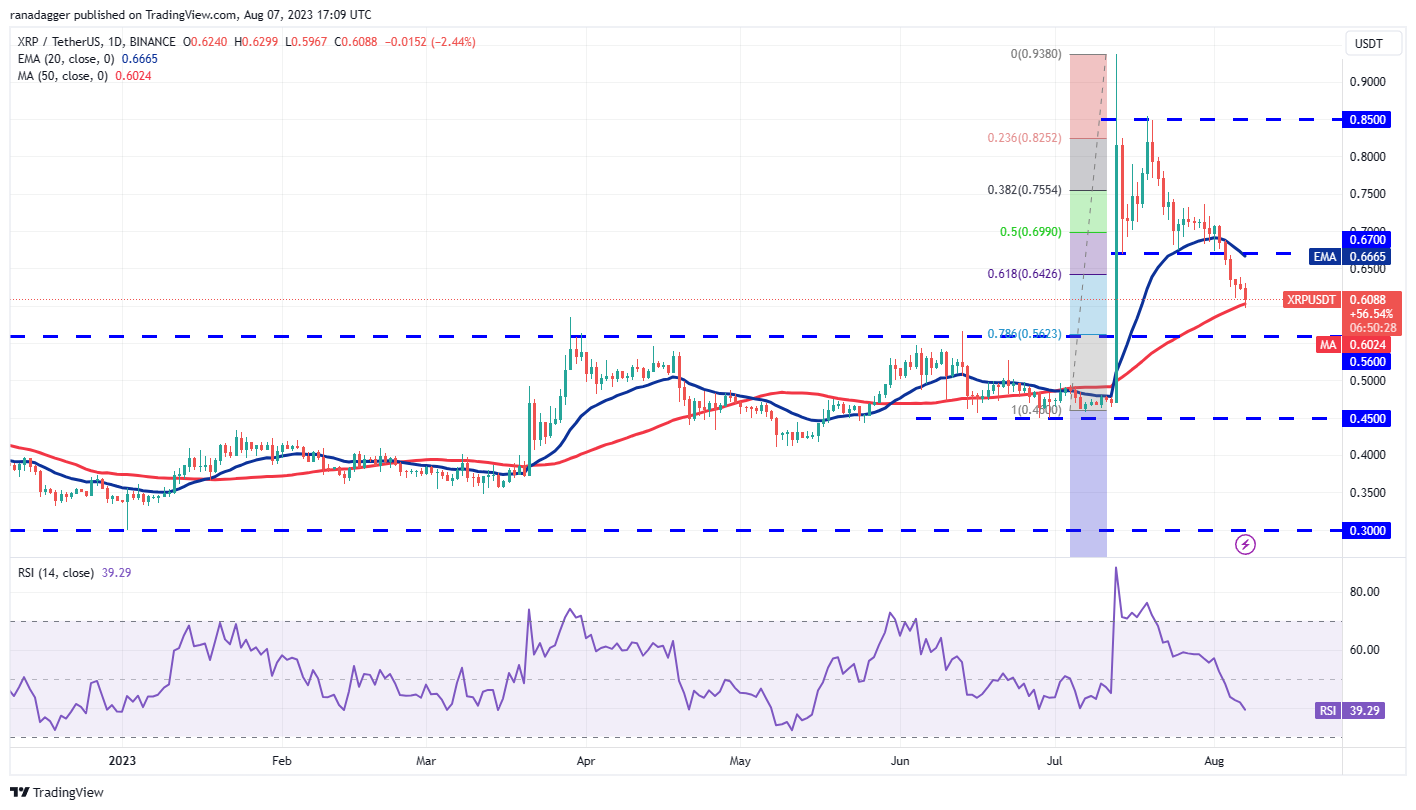
XRP (XRP) has continued its correction and fell below the 61.8% Fibonacci retracement level of $0.64 on Aug. 4. This suggests that bulls are losing their hold.
 XRP/USDT daily chart. Source: TradingView
The price has reached the 50-day SMA ($0.60), which is a significant level to monitor. If the price rebounds from the current level, the XRP/USDT pair may reach the 20-day EMA ($0.67), which could again present a major hurdle.
If the price declines from the current level or the 20-day EMA and breaks below the 50-day SMA, it will indicate that bears are in control. The pair could then slide to the breakout level of $0.56 and even risk a drop to $0.45.
Cardano price analysis
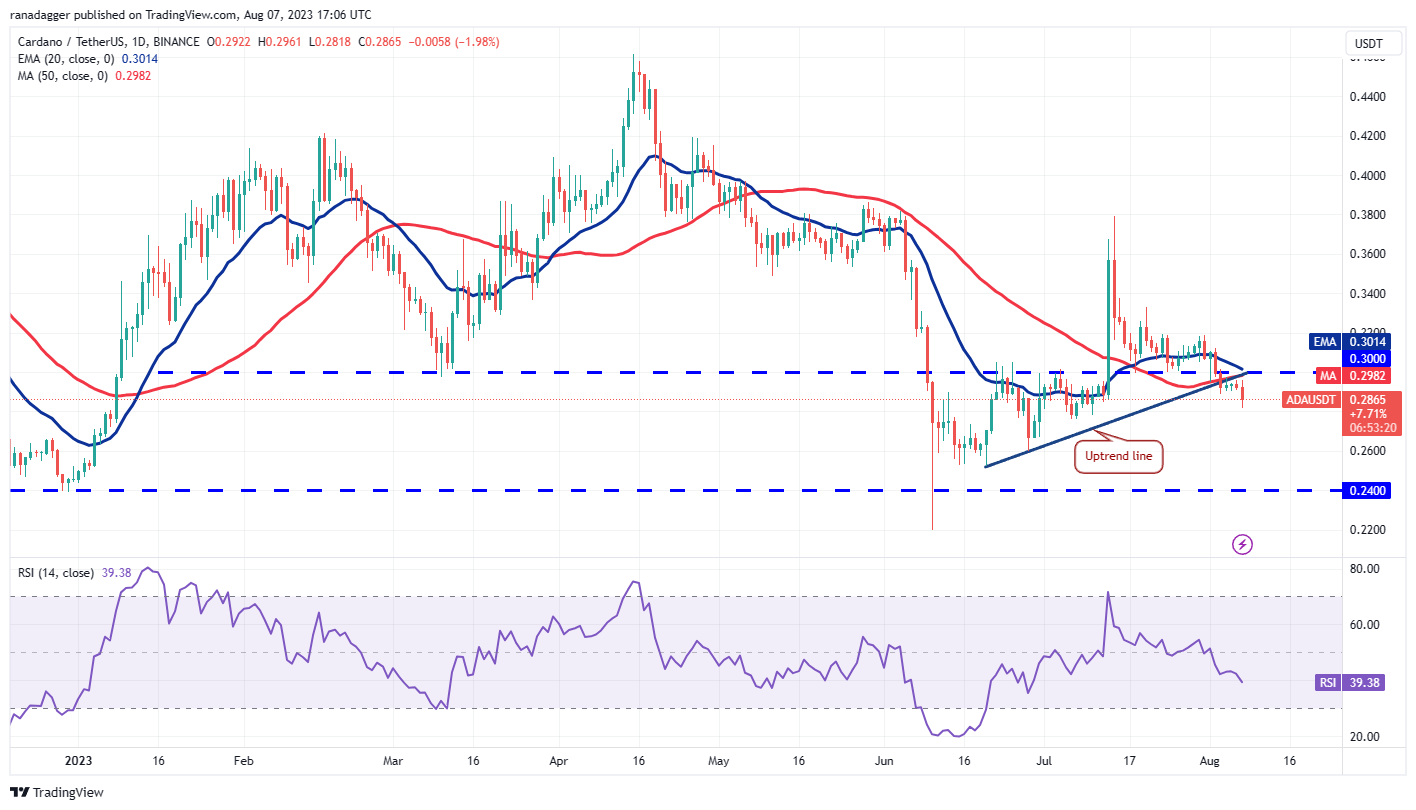
Buyers have been unable to push Cardano (ADA) back above the uptrend line in recent days, indicating that bears are attempting to convert the level into resistance.
 ADA/USDT daily chart. Source: TradingView
The bears pulled the price below the support around $0.29, signaling a continuation of the pullback. The ADA/USDT pair could fall to the next support at $0.26 and eventually to the critical level at $0.24.
This negative outlook will be invalidated in the short term if the price rises above the 20-day EMA ($0.30). That could indicate strong buying interest at lower levels. The pair may then attempt a rally to $0.32 and subsequently to $0.34.
Related: Bitcoin faces 'endless spot selling' as BTC price dips below $28.7K
Dogecoin price analysis
Dogecoin (DOGE) has been correcting within an ascending channel pattern for several days. Typically, in an ascending channel, traders buy near the channel’s support and sell near its resistance.
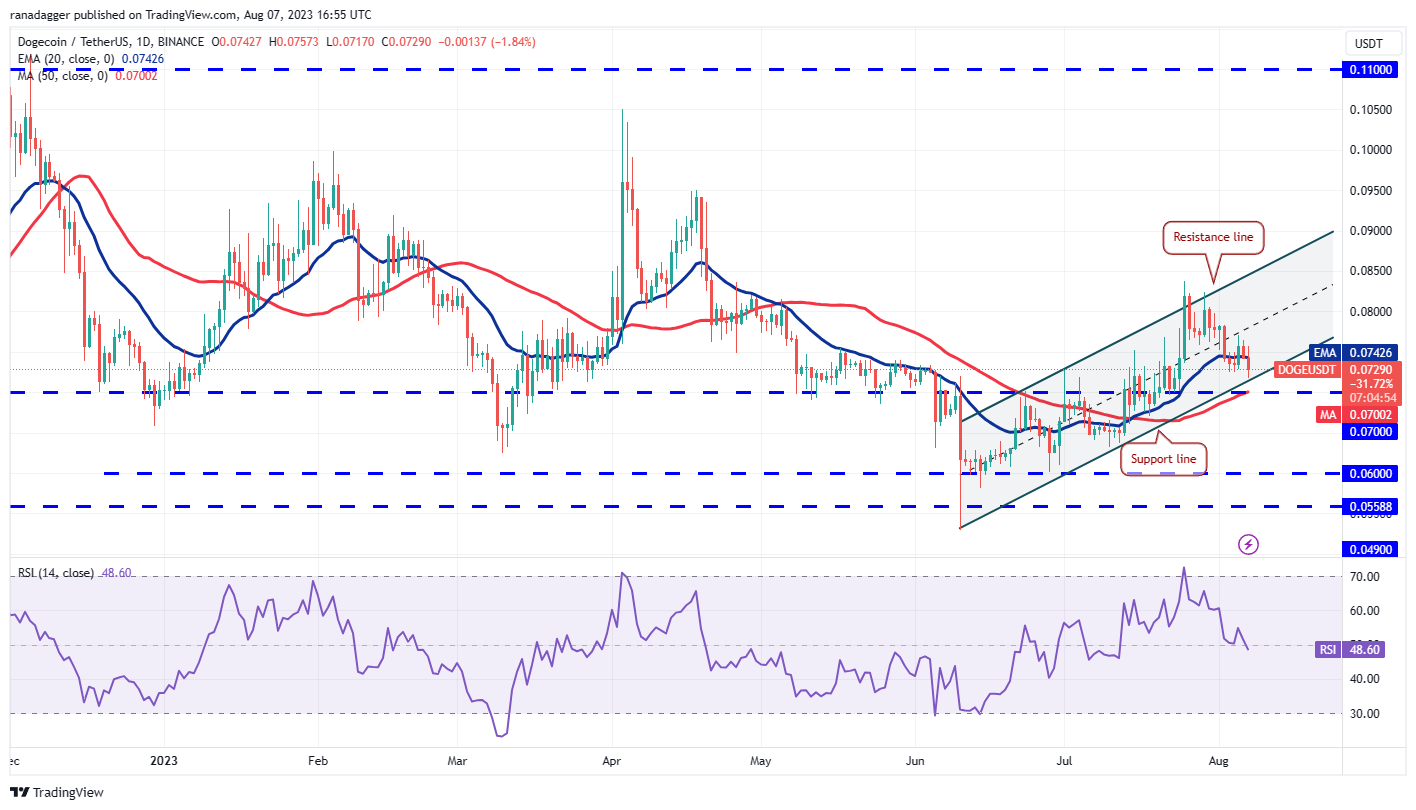 DOGE/USDT daily chart. Source: TradingView
If the price rebounds from the support line, it will indicate that sentiment remains positive and traders are purchasing on dips. The bulls will then aim to push the price to $0.08 and subsequently to the channel’s resistance line.
Conversely, if the price falls below the channel, it will suggest that bears are regaining control. There is strong support at the breakout level of $0.07, but if this level fails, the pair may decline to $0.06.
Solana price analysis
The bulls are attempting to push Solana (SOL) above the 20-day EMA ($23.58), while the bears are trying to drive the price below the $22.30 support.
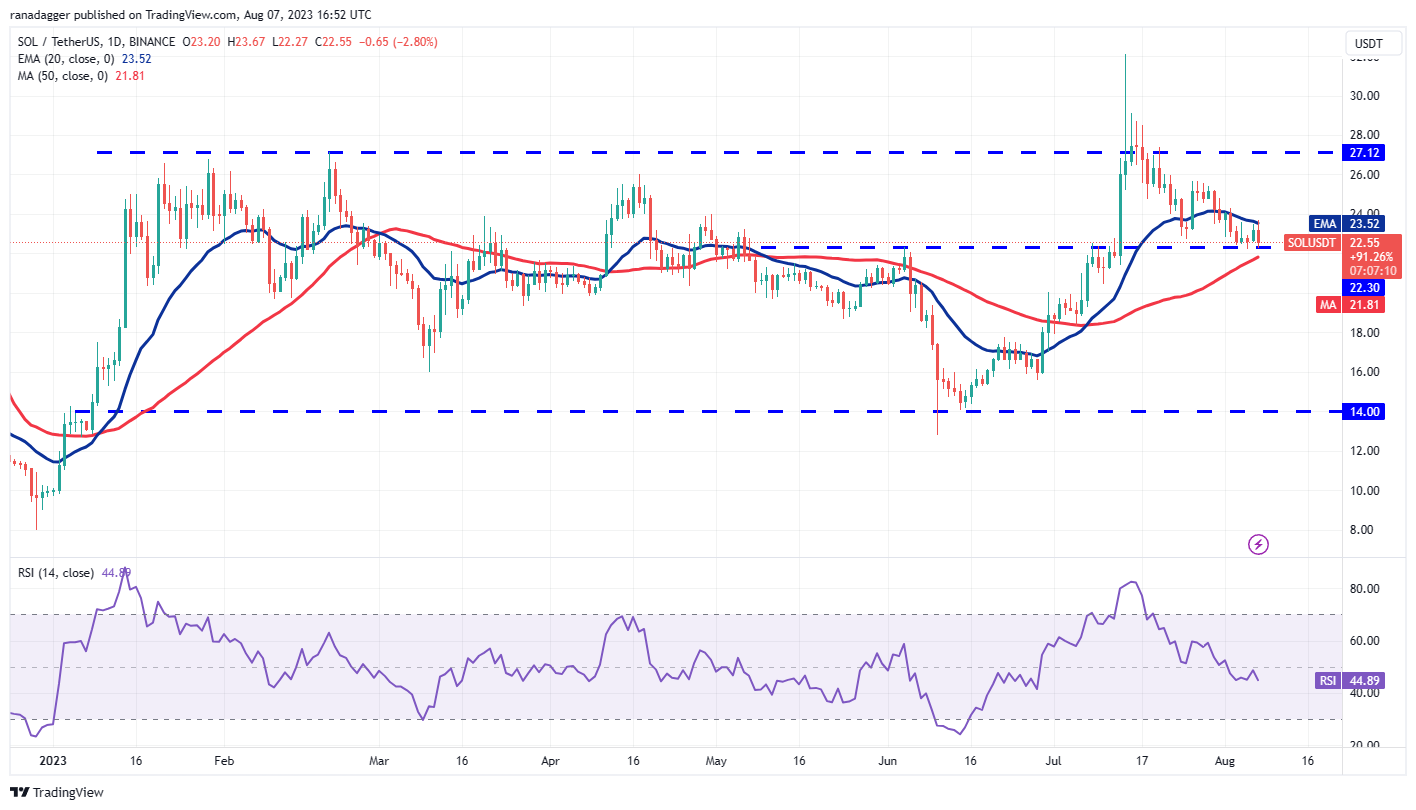 SOL/USDT daily chart. Source: TradingView
If the price rises and holds above the 20-day EMA, it will suggest that the SOL/USDT pair may remain range-bound between $22.30 and $27.12 for a while longer. Buyers will need to overcome the resistance at $27.12 to take control.
Alternatively, if the price declines from the 20-day EMA and breaks below the 50-day SMA ($21.81), it will indicate that bears are trying to convert the 20-day EMA into resistance. This could initiate a deeper correction to $18.
Polygon price analysis
Polygon’s (MATIC) pullback has reached the first significant support at $0.64. Buyers have maintained this level but have struggled to push the price above the moving averages.
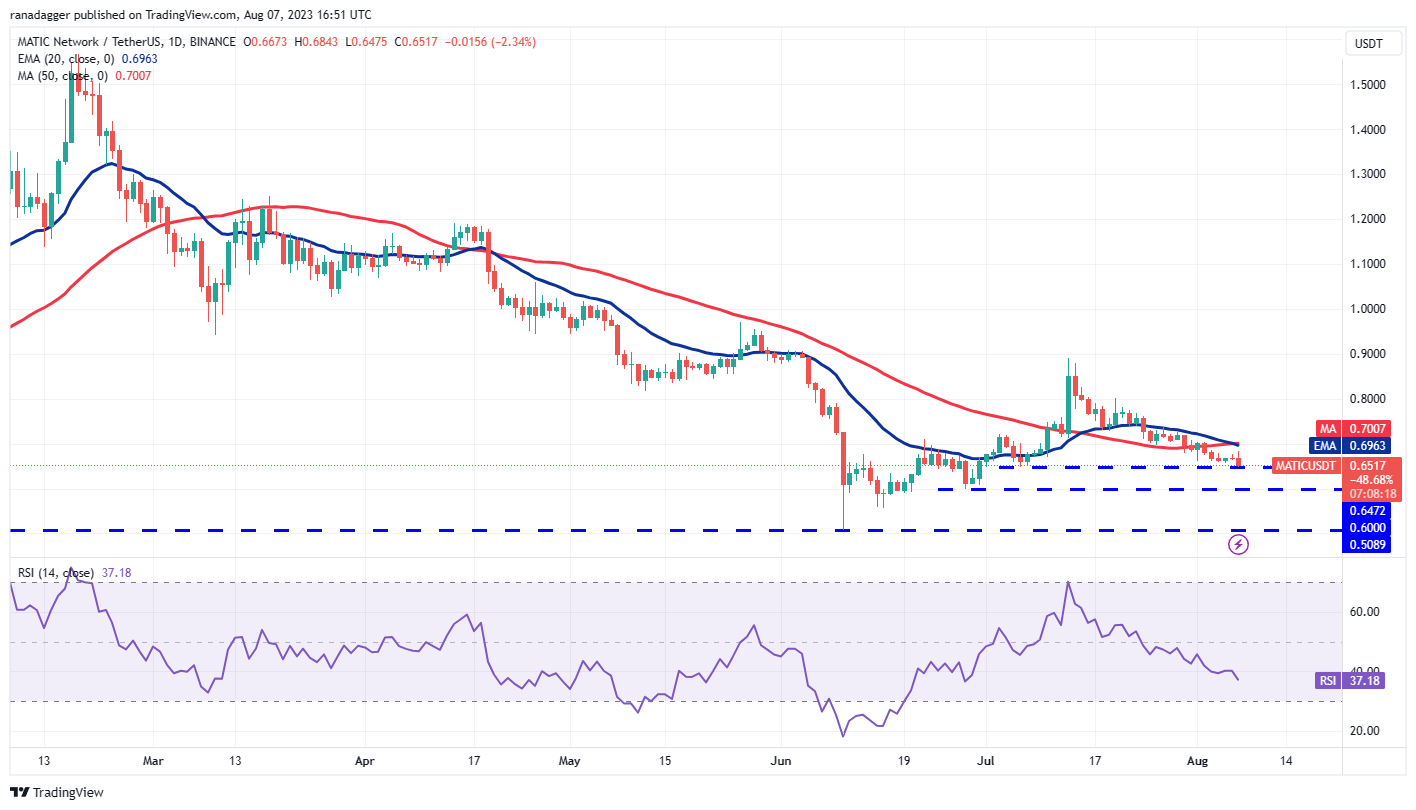 MATIC/USDT daily chart. Source: TradingView
The 20-day EMA ($0.69) is gradually declining, and the RSI is in negative territory, indicating that the path of least resistance is downward. If the price falls below $0.64, the MATIC/USDT pair could reach $0.60.
If bulls wish to avert the decline, they must quickly push the price above the moving averages. This could initiate a recovery, potentially first reaching $0.80 and subsequently $0.90.
This article does not contain investment advice or recommendations. Every investment and trading move involves risk, and readers should conduct their own research when making a decision.