Disclaimer: Information found on CryptoreNews is those of writers quoted. It does not represent the opinions of CryptoreNews on whether to sell, buy or hold any investments. You are advised to conduct your own research before making any investment decisions. Use provided information at your own risk.
CryptoreNews covers fintech, blockchain and Bitcoin bringing you the latest crypto news and analyses on the future of money.
On August 1, the ratings agency Fitch lowered the long-term credit rating of the United States from AAA to AA+, which impacted the risk-on sentiment. The U.S. equity markets experienced profit-taking on August 2, causing the recovery in the cryptocurrency market to falter.
Nevertheless, following the initial reaction, the markets may stabilize. The cryptocurrency sector is expected to maintain its attention on the developments related to Bitcoin (BTC) spot exchange-traded fund (ETF) applications. Bloomberg ETF analysts Eric Balchunas and James Seyffart noted in a statement that the likelihood of an ETF application being approved has increased from 1% a few months ago to 65%.
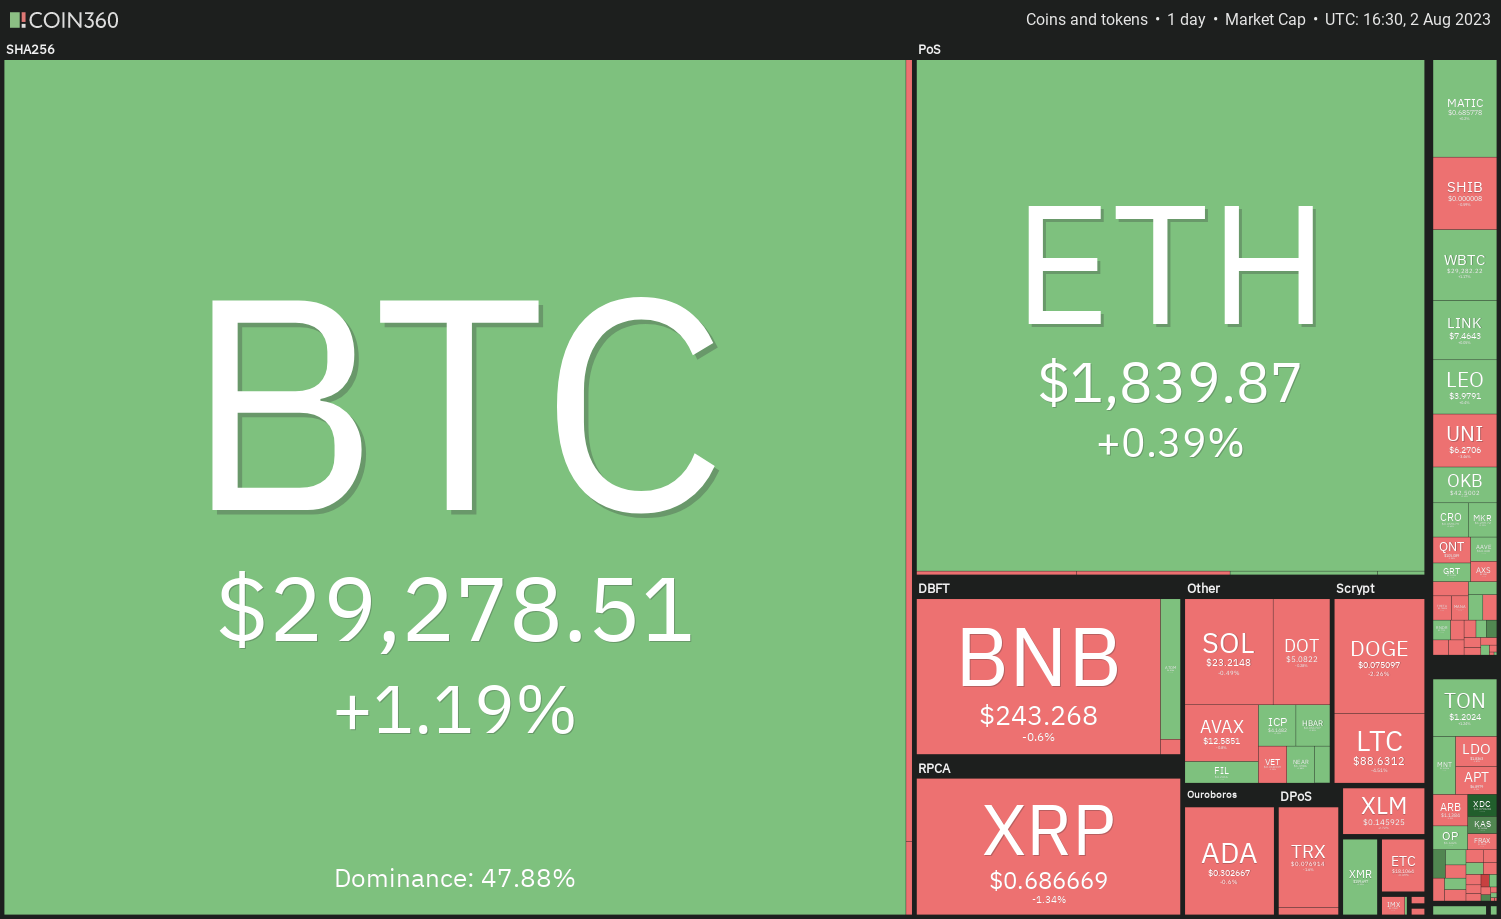 Daily cryptocurrency market performance. Source: Coin360
Recent events in the crypto space have invigorated Bitcoin bulls. MicroStrategy, a software development company founded by Michael Saylor, is looking to raise up to $750 million through a stock sale, intending to utilize the proceeds for operational expenses and to acquire additional Bitcoin. The company currently holds 152,800 Bitcoin valued at approximately $4.5 billion at present prices.
Will buyers uphold the immediate support levels for Bitcoin and altcoins, or could the bears dominate the bulls? Let’s analyze the charts of the top 10 cryptocurrencies to determine the outcome.
Bitcoin price analysis
Bitcoin’s volatility increased on August 1. The bears pushed the price below the immediate support at $28,861, but the long tail on the candlestick indicates strong buying interest at lower levels.
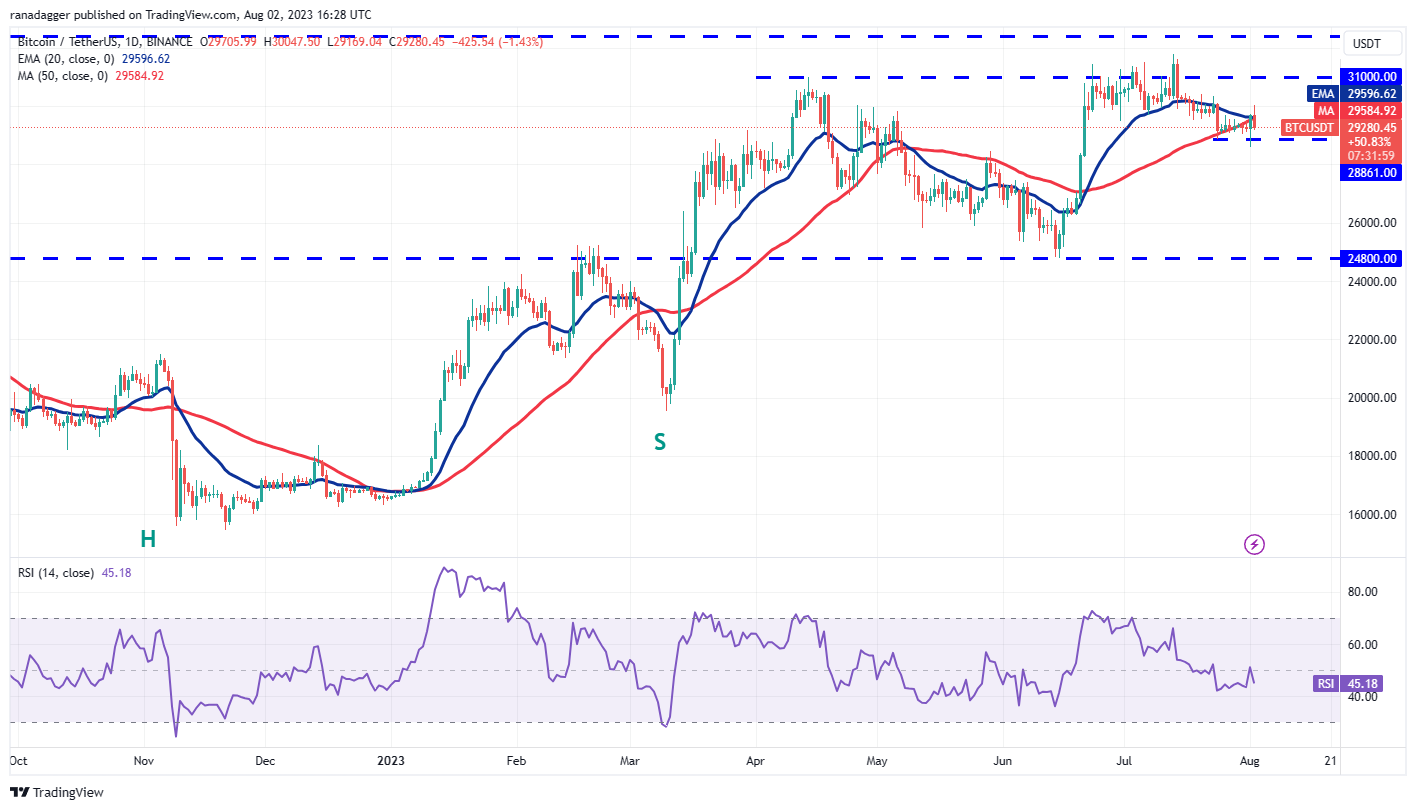 BTC/USDT daily chart. Source: TradingView
The bulls managed to drive the price above the 20-day exponential moving average (EMA) of $29,596, yet they are facing challenges in overcoming the resistance at $30,000. This suggests that the bears are still active and selling during rallies.
The 20-day EMA is flattening, and the relative strength index (RSI) is just below the midpoint, indicating a potential range formation in the short term. The upper boundary of the range could be $30,050, while the lower boundary may be $28,585.
If buyers push the price above this narrow range, the BTC/USDT pair could ascend to the resistance zone between $31,000 and $32,400. Conversely, a drop below $28,585 could initiate a decline toward $27,500 and subsequently to $26,000.
Ether price analysis
The tight-range trading in Ether (ETH) broke to the downside on August 1, but the bears were unable to maintain the lower levels, as evidenced by the long tail on the day’s candlestick.
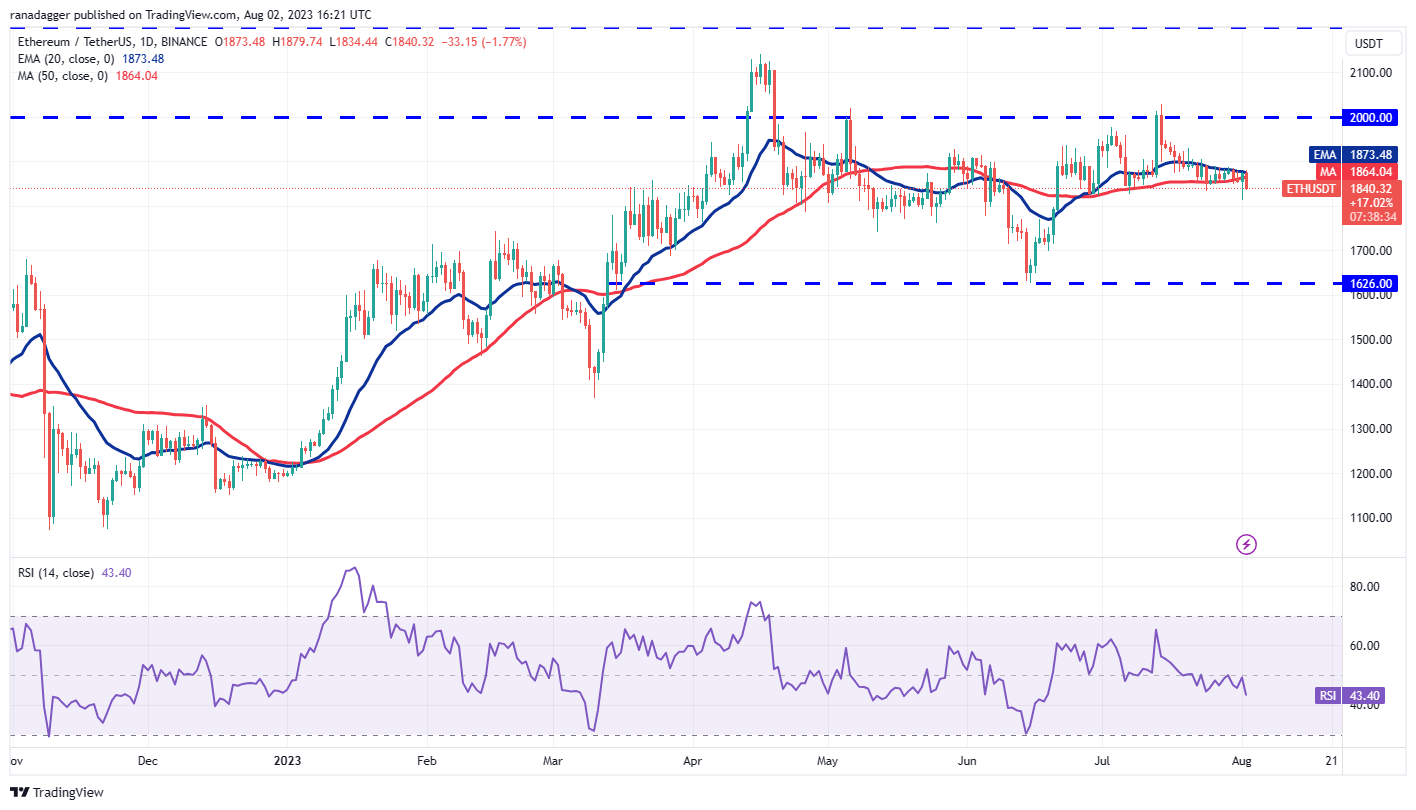 ETH/USDT daily chart. Source: TradingView
A notable point for the bears is that they did not permit the price to rise above the 20-day EMA ($1,873). The bears are attempting to solidify their position by keeping the price below the 50-day simple moving average (SMA) of $1,864.
If they succeed, the ETH/USDT pair could decline to $1,813. A break and close below this level could lead to a drop to $1,700 and then to $1,626.
If bulls wish to avert a short-term decline, they must overcome the resistance at the 20-day EMA. This could trigger an upward movement toward the psychological barrier at $2,000.
BNB price analysis
BNB’s (BNB) volatility increased on August 1, but the bulls were unable to push the price above the triangle’s resistance line.
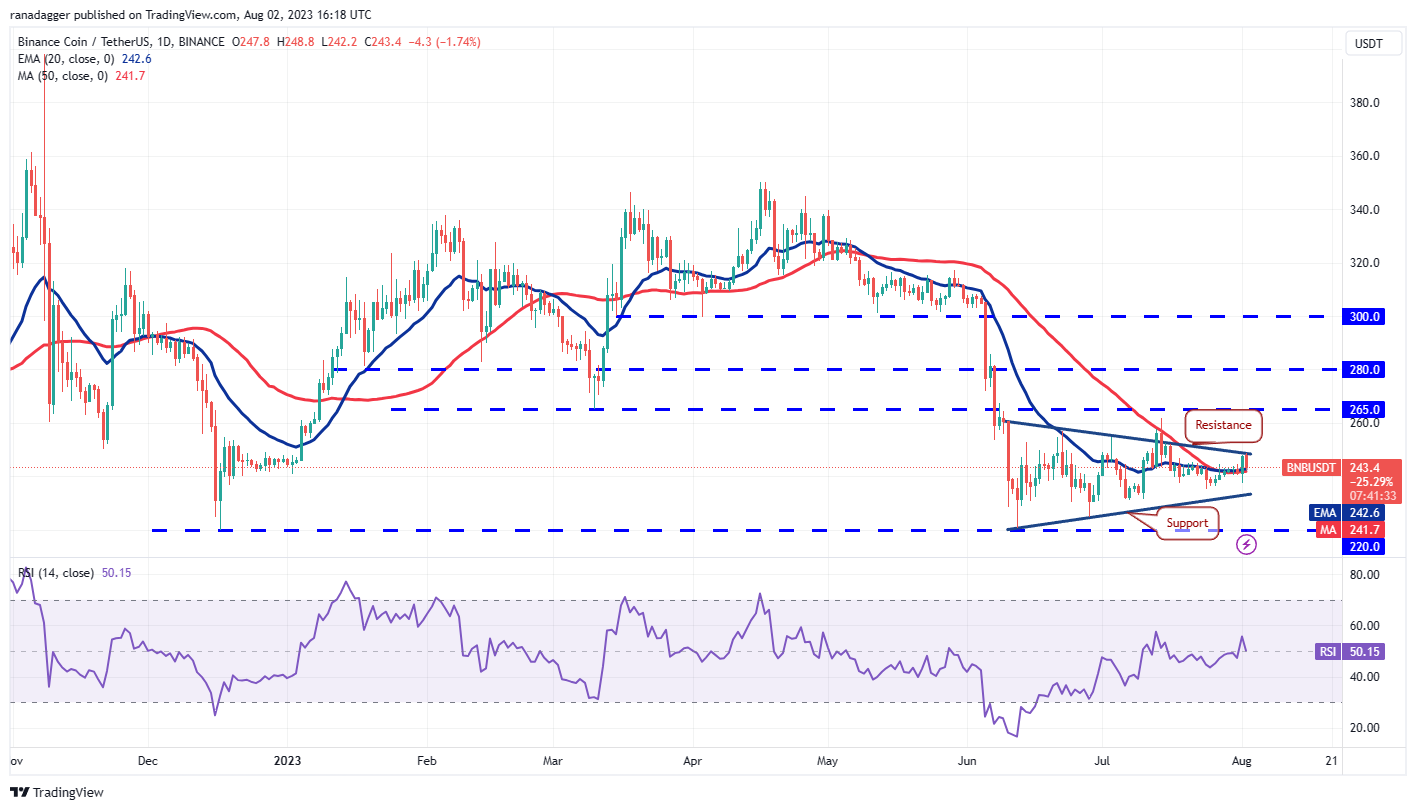 BNB/USDT daily chart. Source: TradingView
The flat moving averages and the RSI near the midpoint do not provide a clear advantage to either the bulls or the bears. If the price rebounds off the moving averages, it will enhance the likelihood of a breakout above the triangle. If this occurs, the BNB/USDT pair could surge to $265.
On the other hand, if the price falls below the moving averages, the pair may decline to the triangle’s support line. If this support fails, the pair could retest the critical support at $220.
XRP price analysis
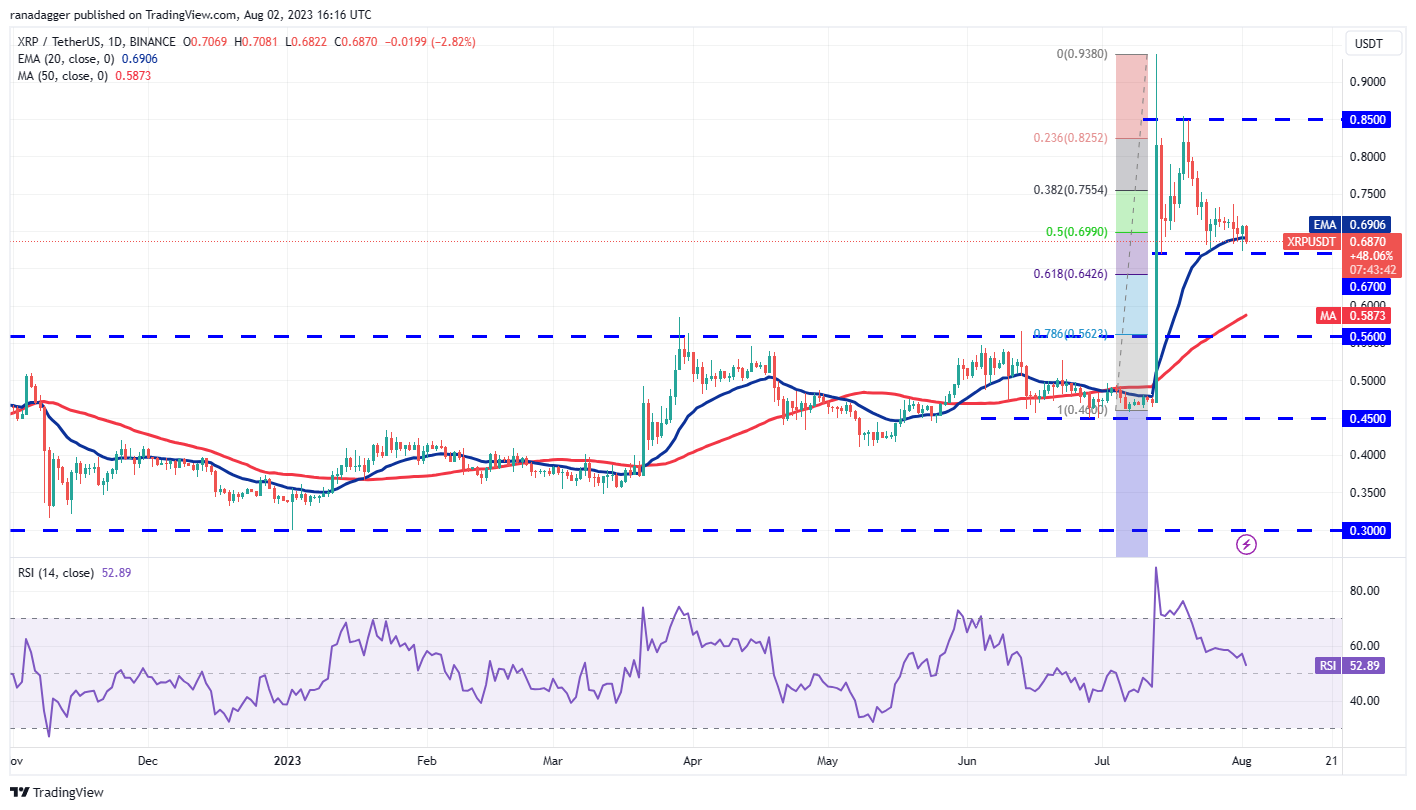
XRP (XRP) bounced off the support at $0.67 on August 1, but the bulls could not maintain the higher levels. This indicates that the bears are selling during every minor relief rally.
 XRP/USDT daily chart. Source: TradingView
The bears are attempting to pull the price back to the support at $0.67. A repeated retest of a support level in a short timeframe tends to weaken it. If the $0.67 level fails, the XRP/USDT pair could drop to the breakout level of $0.56.
Alternatively, if the price rebounds off $0.67 with strength, it will indicate that the bulls are vigorously defending this level. This could propel the price to the immediate resistance at $0.75. A breakout above this level could pave the way for a potential rally to $0.85.
Dogecoin price analysis
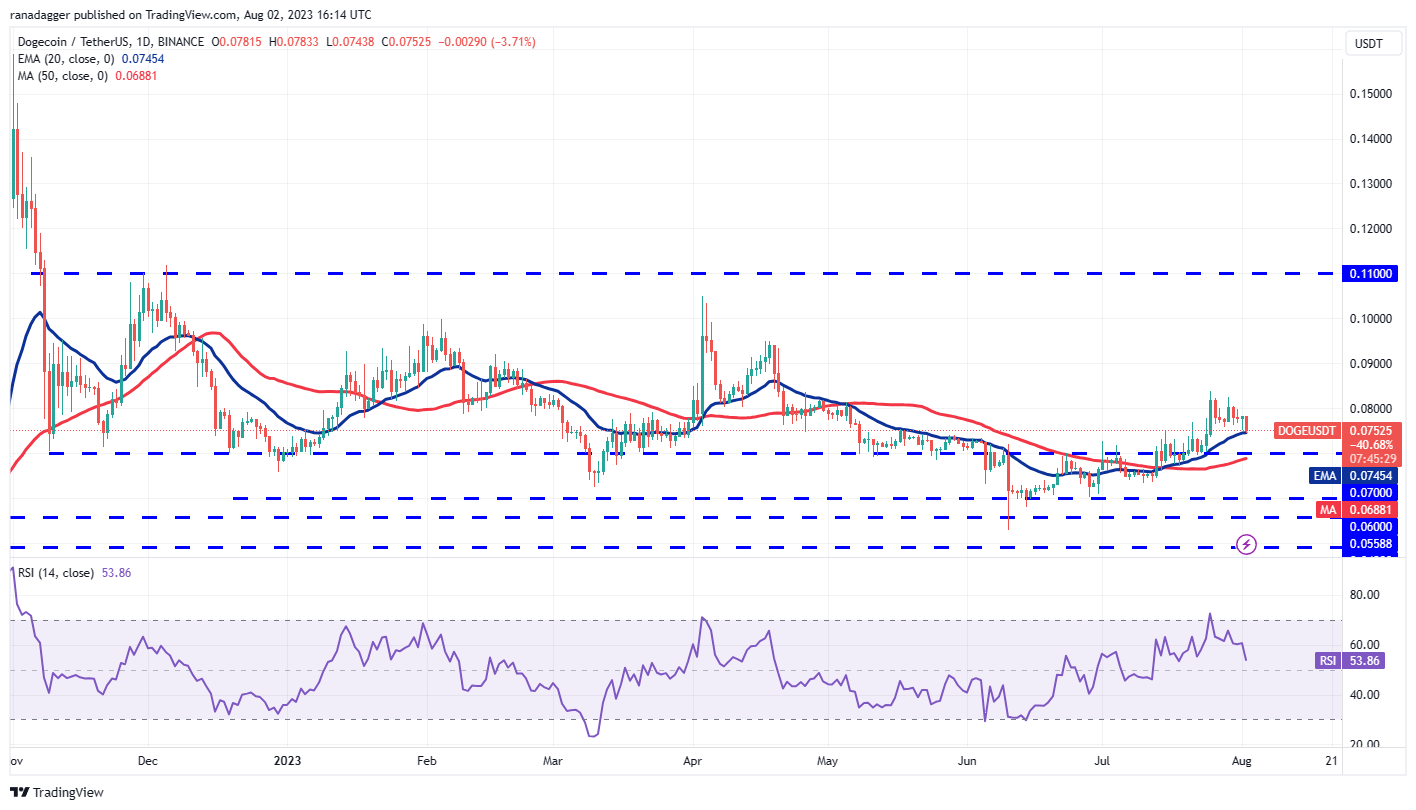
Dogecoin (DOGE) rebounded from the 20-day EMA ($0.07) on August 1, suggesting that lower levels are attracting buyers.
 DOGE/USDT daily chart. Source: TradingView
Related Posts
However, the bulls were unable to push the price above the overhead resistance near $0.08. The bears took this opportunity to pull the price back to the 20-day EMA. If this support breaks, it will indicate that the bulls are losing their hold. The DOGE/USDT pair could then fall to the breakout level of $0.07.
Conversely, if the price rebounds off the 20-day EMA again, it will signal that the sentiment remains positive and that bulls are buying the dips. This could improve the chances of a breakout above the overhead resistance, allowing the pair to rise to $0.10.
Cardano price analysis
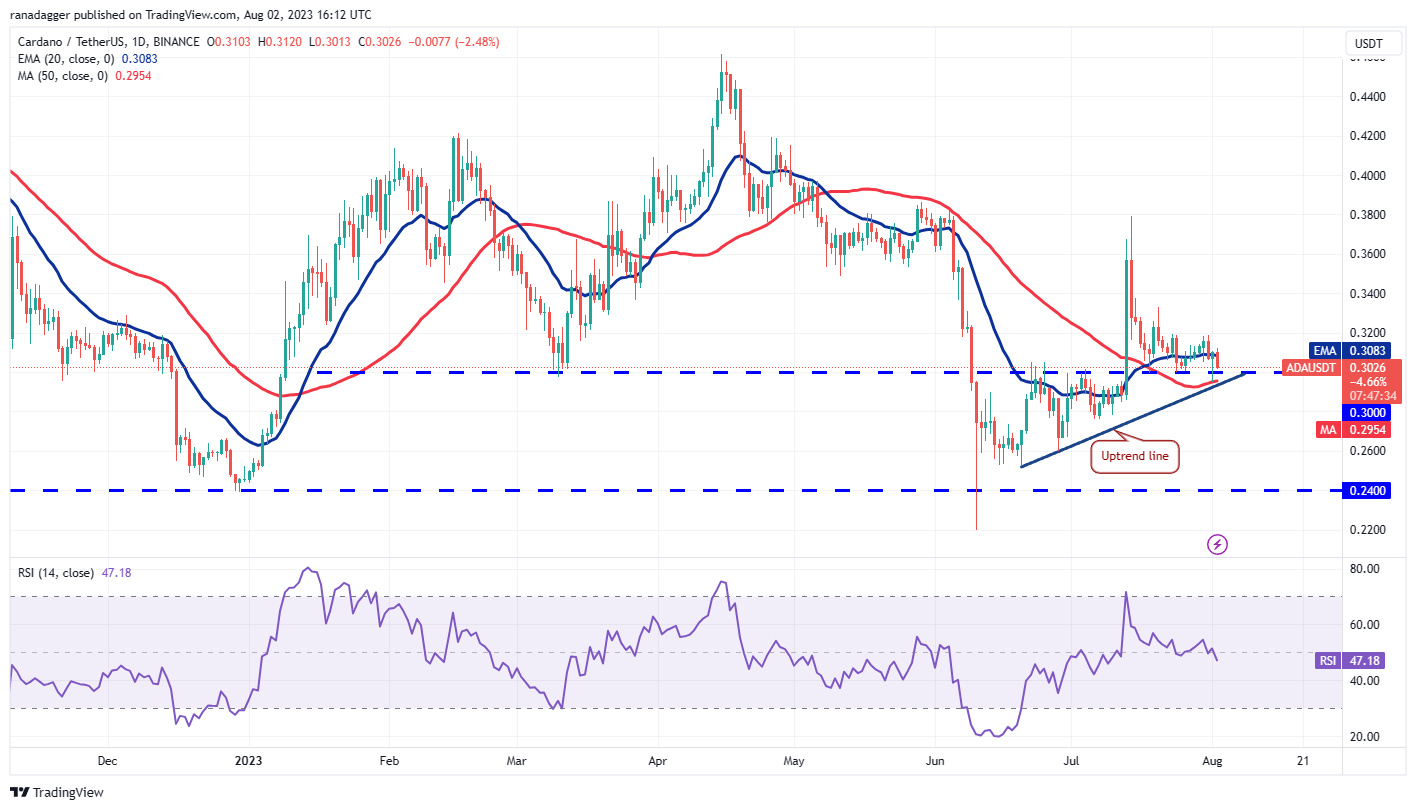
The bears pushed Cardano (ADA) below the immediate support at $0.30 on August 1, but the bulls bought the dip to the 50-day SMA ($0.29).
 ADA/USDT daily chart. Source: TradingView
Buyers will need to push the price above the resistance zone of $0.33 to $0.34 to signal a recovery. The ADA/USDT pair could then rise to $0.38, where the bears may again mount a strong defense.
In contrast, if the price continues to decline and breaks below the 50-day SMA, it will suggest that the bears have taken control. The pair could then slide to $0.26 and eventually to $0.24.
Solana price analysis
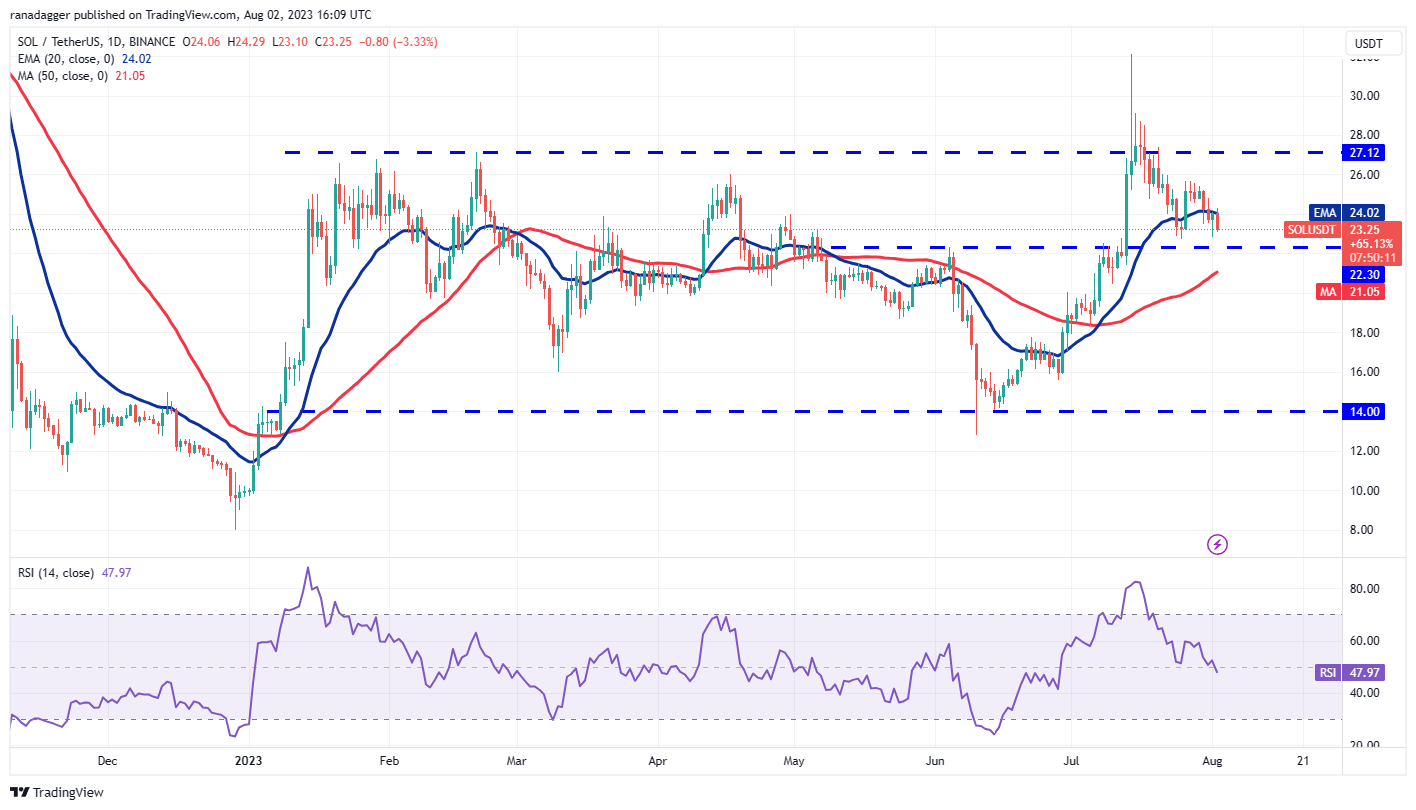
Solana (SOL) bounced back from the strong support at $22.30 on August 1, but the bulls could not push and maintain the price above the 20-day EMA ($24.02).
 SOL/USDT daily chart. Source: TradingView
This indicates a negative sign, showing that the bears are selling during every minor increase. Sellers will again attempt to drive the price below the support zone between $22.30 and the 50-day SMA ($21.05). If successful, the SOL/USDT pair could begin a deeper correction toward $18 and then $16.
Conversely, if the price bounces off $22.30 again, it will indicate that the bulls are defending this level vigorously. The pair may first recover to $25.68 and subsequently retest the significant resistance at $27.12.
Related: Why is Bitcoin price stuck?
Polygon price analysis
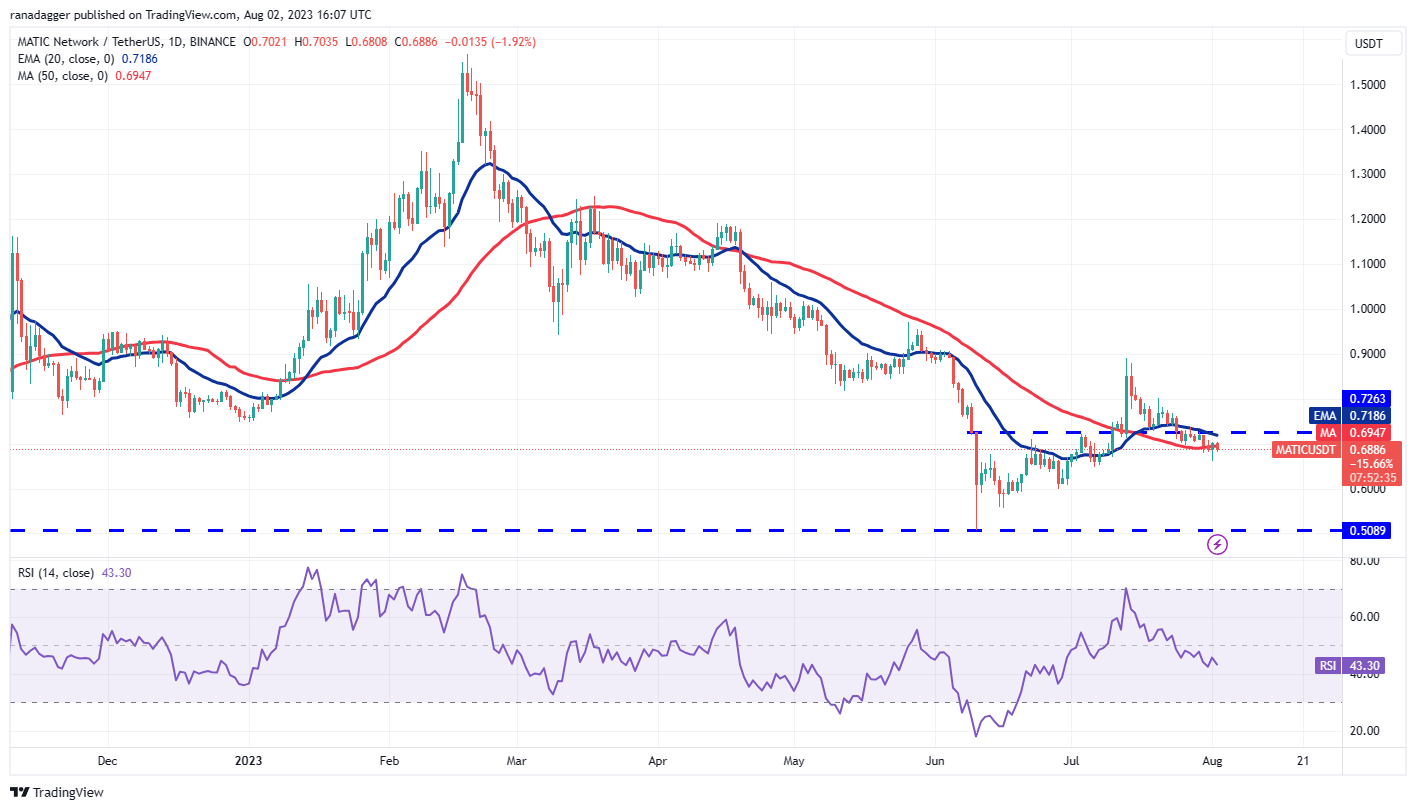
Polygon (MATIC) has been gradually declining. The bears pulled the price below the 50-day SMA ($0.69) on July 31, but the bulls managed to push the price back above this level on August 1.
 MATIC/USDT daily chart. Source: TradingView
The gradually declining 20-day EMA ($0.72) and the RSI below 44 suggest that bears hold a slight advantage. If the price declines and breaks below $0.65, selling pressure could increase, and the MATIC/USDT pair may fall to $0.60.
This negative outlook will be invalidated in the near term if the price rises from the current level and breaks above the 20-day EMA. This could open the path for a potential rally to $0.80. This level may act as a strong barrier, but if bulls surpass it, the pair could reach $0.90.
Litecoin price analysis
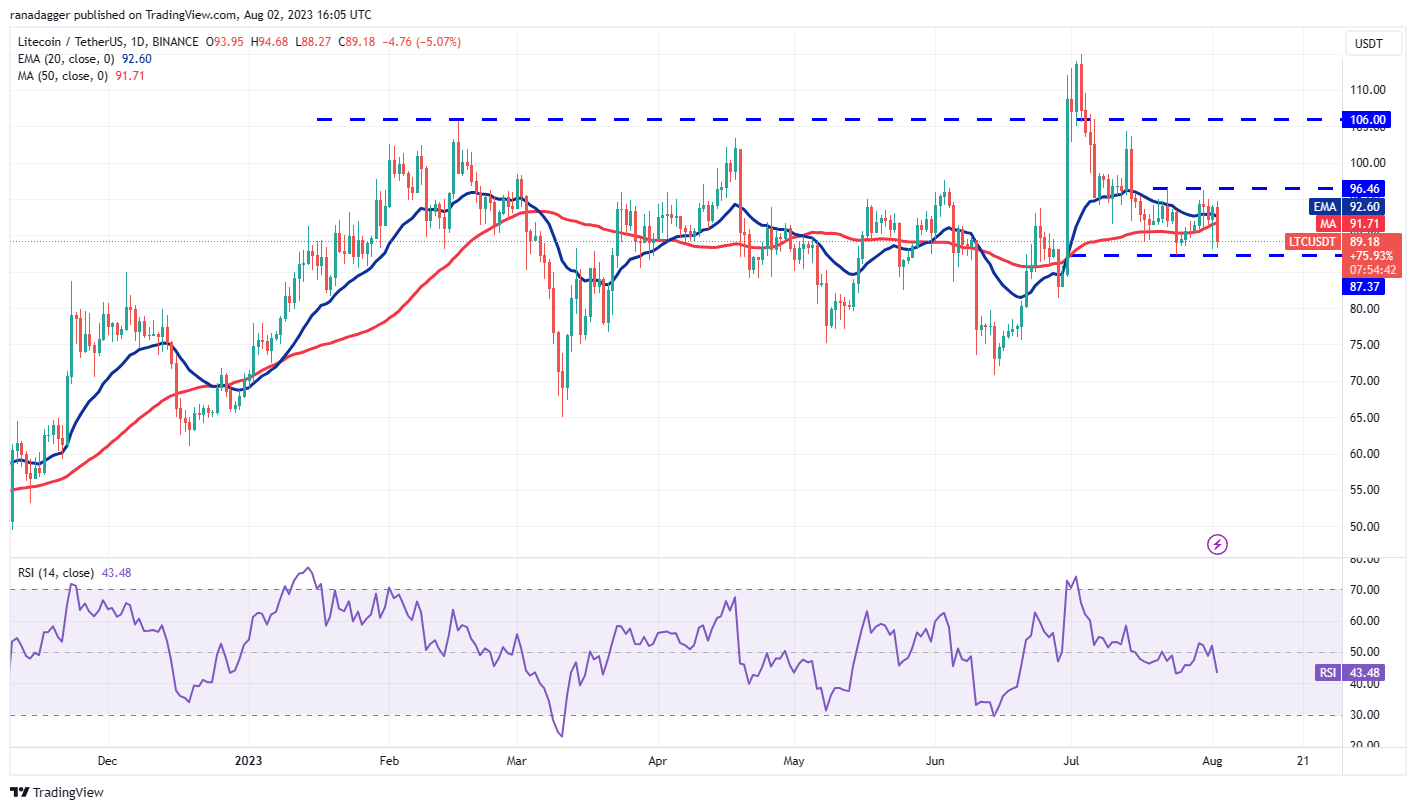
Litecoin (LTC) rebounded from the strong support at $87 on August 1. This indicates that the price remains confined within the range between $87 and $97.
 LTC/USDT daily chart. Source: TradingView
The 20-day EMA ($92) is flat, and the RSI is just below the midpoint, suggesting a balance between supply and demand. This equilibrium will shift in favor of the bears if they manage to push the price below $87. The LTC/USDT pair could then decline to $81 and later to $75.
Conversely, if the price rebounds from $87, it will indicate that the pair may remain within the range for a few more days. The bulls will need to push the price above $97 to initiate an upward movement to $106.
Polkadot price analysis
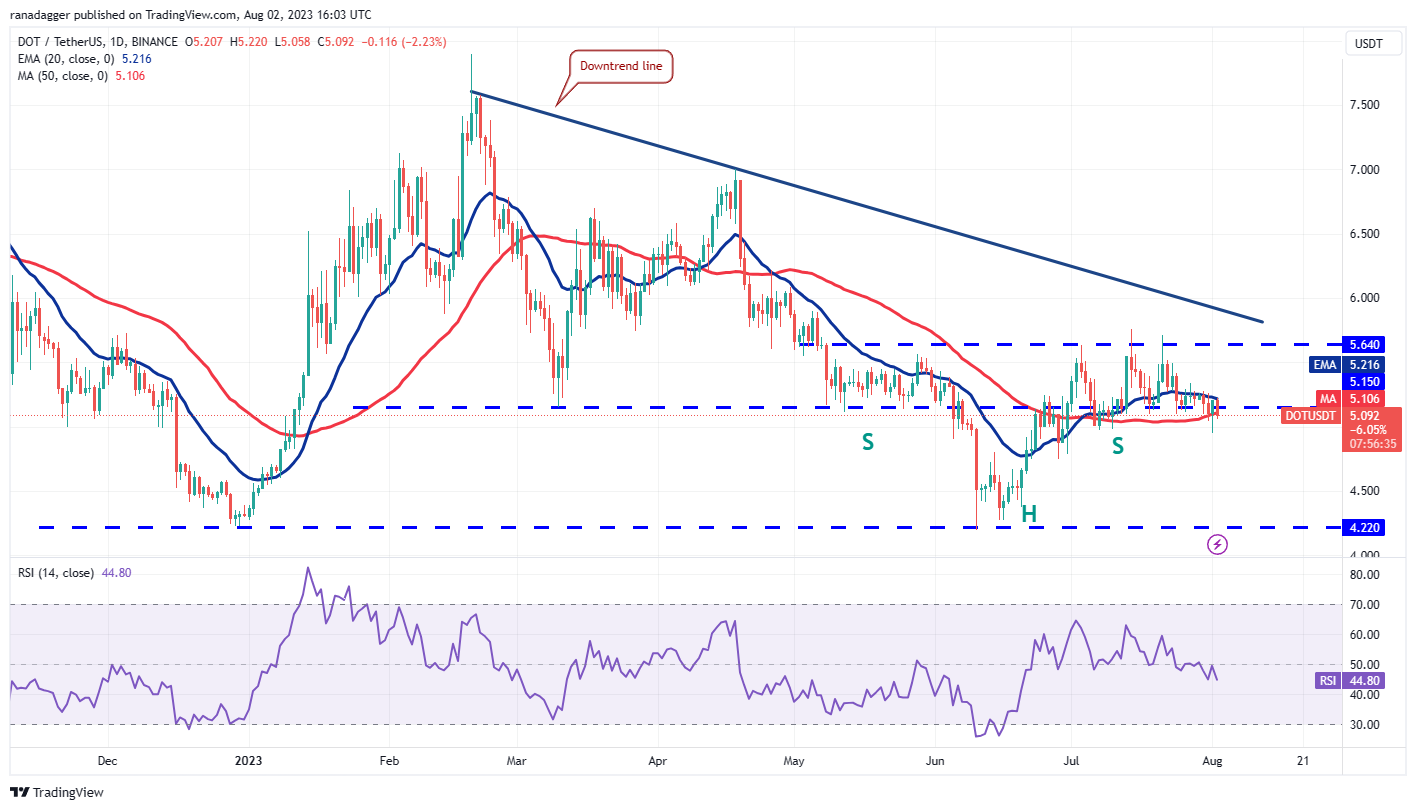
The bears attempted to resolve the uncertainty in Polkadot (DOT) in their favor on August 1, but the bulls countered their efforts.
 DOT/USDT daily chart. Source: TradingView
A minor positive for the bears is that they did not allow the bulls to push the price above the 20-day EMA ($5.21). This indicates that higher levels continue to attract selling pressure from the bears.
The key support to monitor on the downside is the 50-day SMA. If the price remains below this level, selling could intensify, and the DOT/USDT pair may drop to $4.74 and then to $4.65.
Conversely, a rise above the 20-day EMA may improve the chances of a rally to the overhead resistance at $5.64.
This article does not contain investment advice or recommendations. Every investment and trading move involves risk, and readers should conduct their own research when making a decision.