Disclaimer: Information found on CryptoreNews is those of writers quoted. It does not represent the opinions of CryptoreNews on whether to sell, buy or hold any investments. You are advised to conduct your own research before making any investment decisions. Use provided information at your own risk.
CryptoreNews covers fintech, blockchain and Bitcoin bringing you the latest crypto news and analyses on the future of money.
The S&P 500 Index continued its ascent towards its historical peak with a 3% increase in July. Factors such as diminishing inflationary pressures and the anticipation of a conclusion to the Federal Reserve’s tightening cycle have contributed to a heightened risk-on sentiment.
Nevertheless, this optimistic atmosphere did not extend to Bitcoin (BTC), which remained largely confined within a range in July and is poised to conclude the month with a decline exceeding 3%. The primary concern for traders is when Bitcoin’s range will break and in which direction it will move.
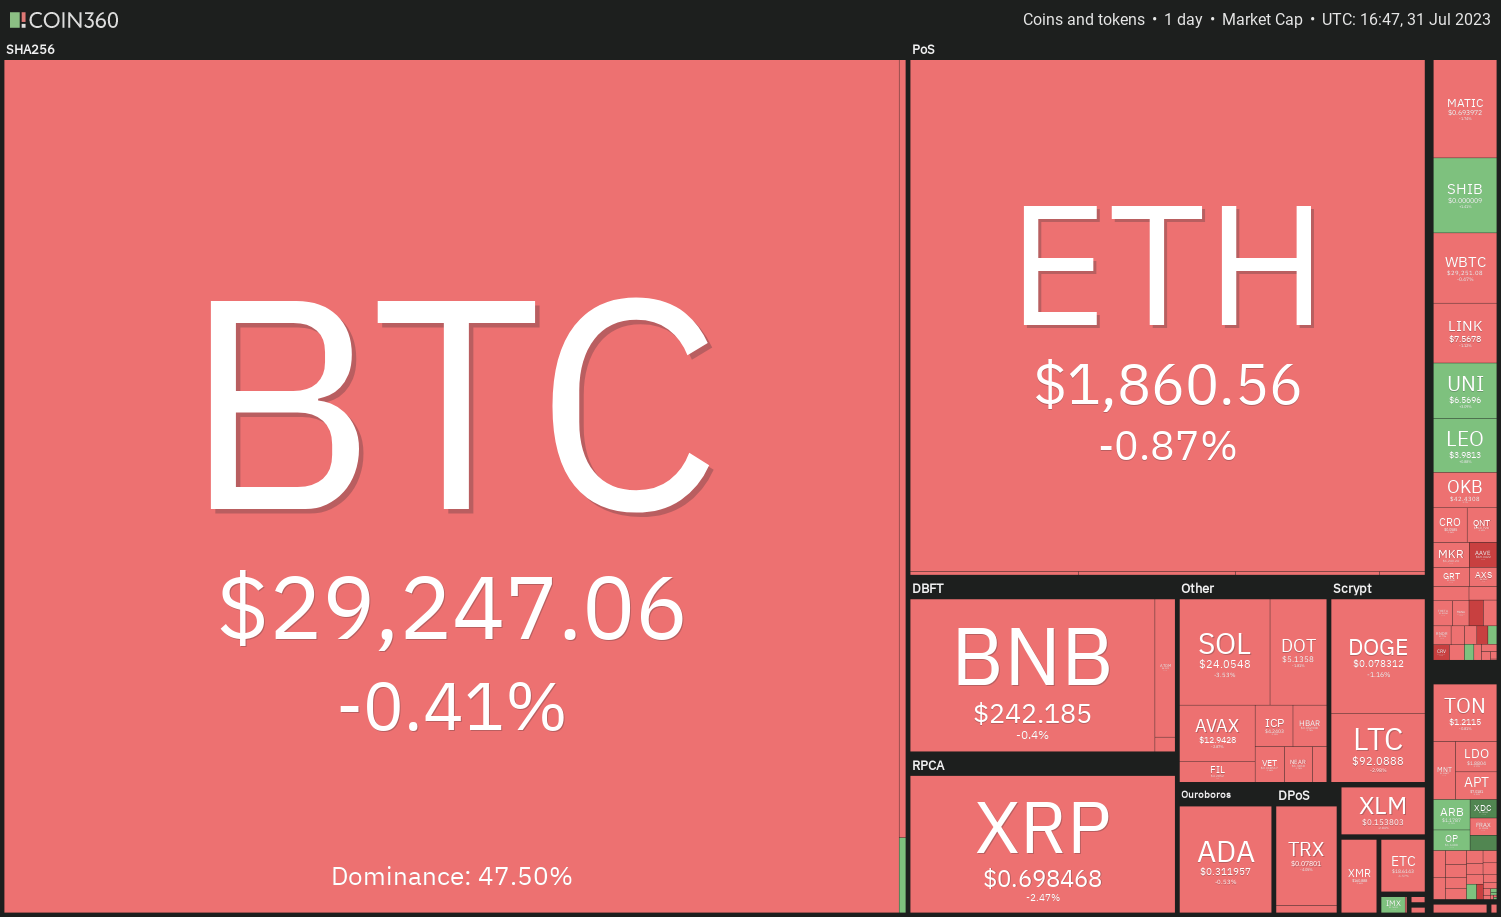 Daily cryptocurrency market performance. Source: Coin360
Generally, the longer an asset remains within a range, the more significant the force required for a breakout. Once the price escapes this range, the subsequent trending movement is likely to be substantial. The challenge lies in accurately predicting the breakout direction. Therefore, it is advisable to wait for the price to maintain itself above or below the range before making significant investments.
With Bitcoin trading within a range, could the focus shift to altcoins? Let’s examine the charts for insights.
S&P 500 Index price analysis
The S&P 500 Index (SPX) has been experiencing an upward trend. The bears attempted to pull the price back below the breakout level of 4,513 on July 27, but the bulls maintained their position. This indicates that buyers are attempting to convert the 4,513 level into support.
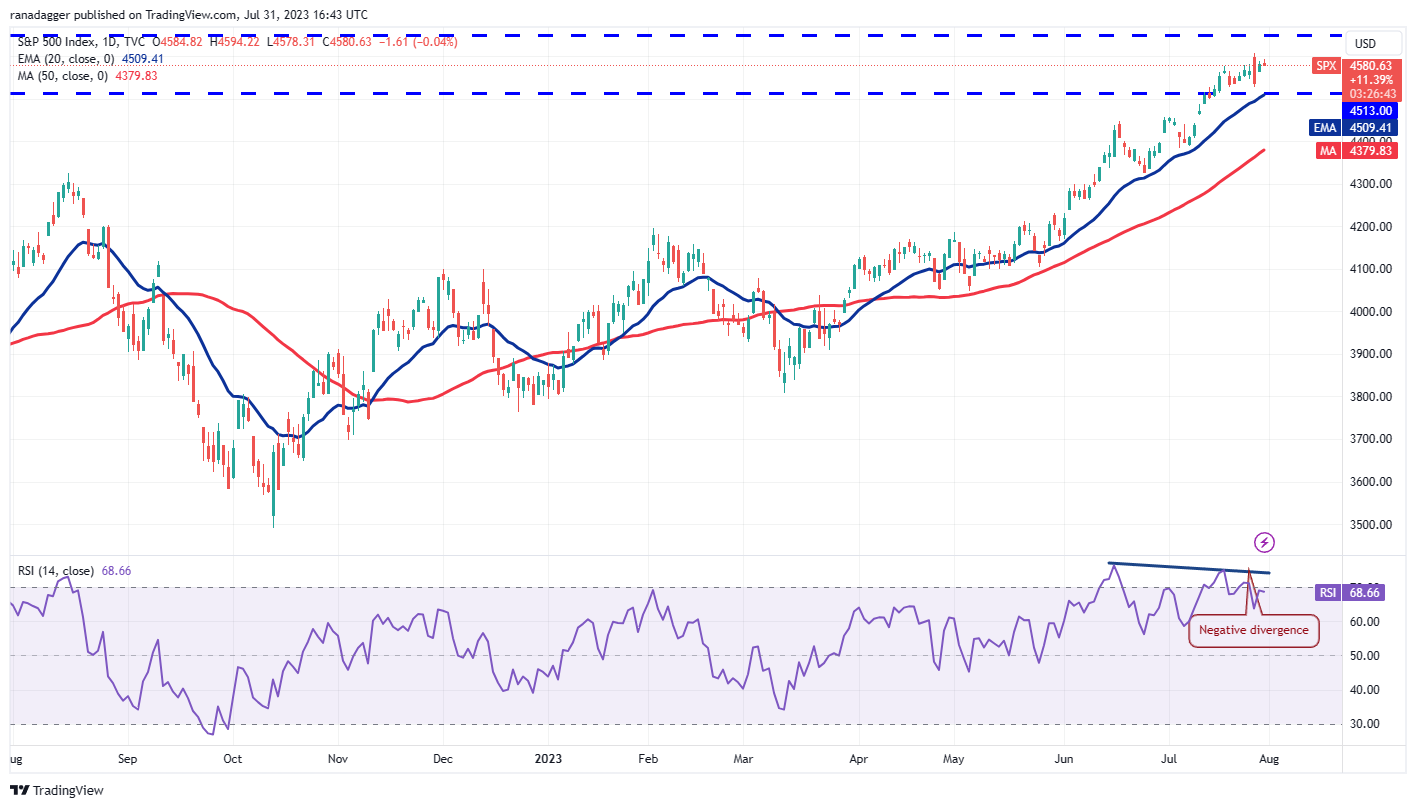 SPX daily chart. Source: TradingView
The ascending moving averages suggest that bulls are in command, yet the negative divergence on the relative strength index (RSI) implies that the bullish momentum may be waning.
The upward movement is likely to encounter significant selling pressure at 4,650. If the price declines from this level but bounces off the 20-day exponential moving average (EMA) of 4,509, it will indicate that the uptrend remains intact.
The initial sign of weakness would be a break and close below the 20-day EMA, which could pave the way for a potential drop to the 50-day simple moving average (SMA) of 4,371.
U.S. Dollar Index price analysis
The bears attempted to push the U.S. Dollar Index (DXY) below the 100.82 support on July 27, but the bulls robustly defended this level. This initiated strong buying, propelling the price above the 20-day EMA (101.46).
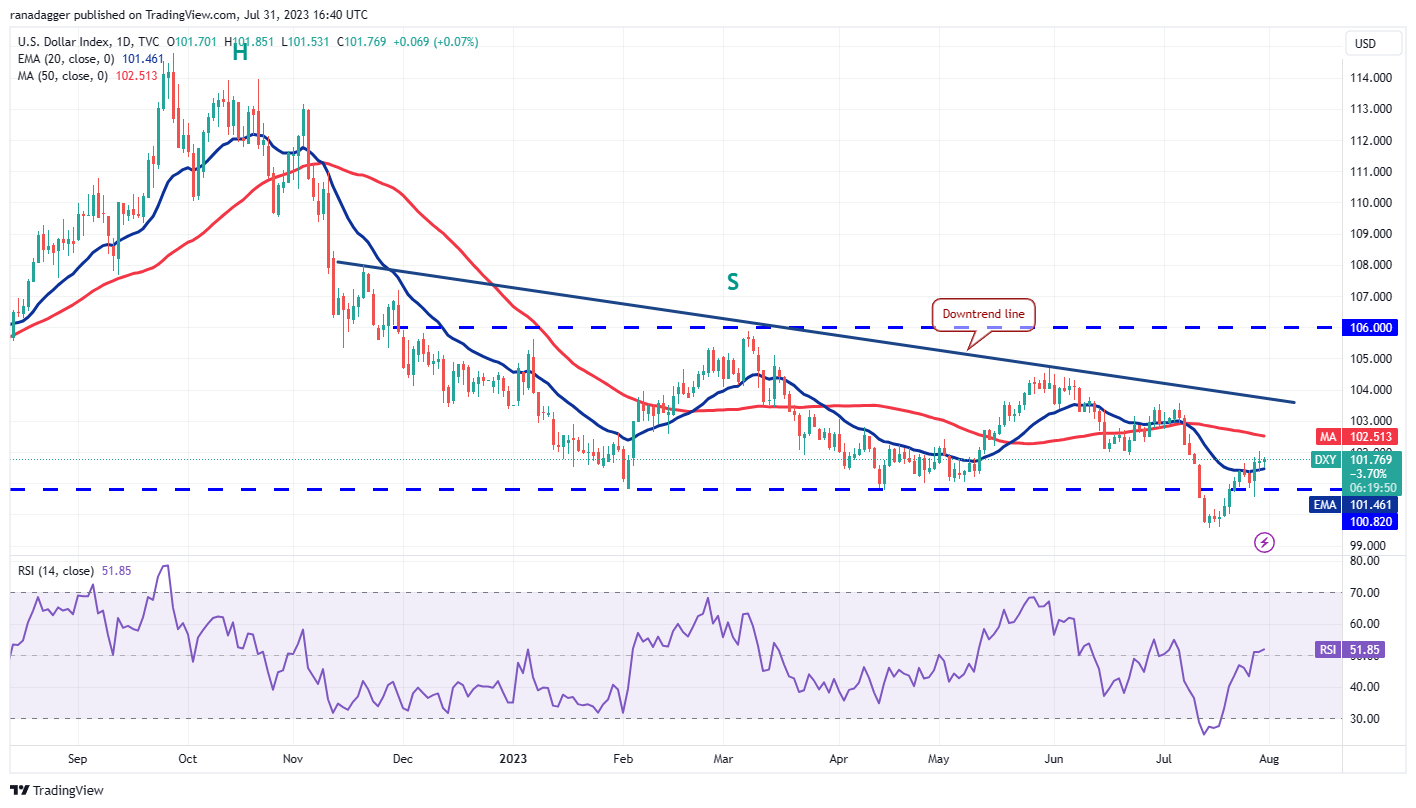 DXY daily chart. Source: TradingView
The bulls will next aim to extend the recovery towards the 50-day SMA (102.51) and subsequently to the downtrend line. This remains a crucial level to monitor, as a break above it could suggest that the bears are losing control. The index may then rise to the significant overhead resistance at 106.
Conversely, the bears must push and maintain the price below 100.82 to assert their dominance. The index could then decline to 99.57. A break below this support could indicate the resumption of the downtrend.
Bitcoin price analysis
Bitcoin fell below the 50-day SMA ($29,442) on July 30, signaling that the bears are attempting to gain control. However, the long tail on the day’s candlestick indicates buying interest near the horizontal support at $28,861.
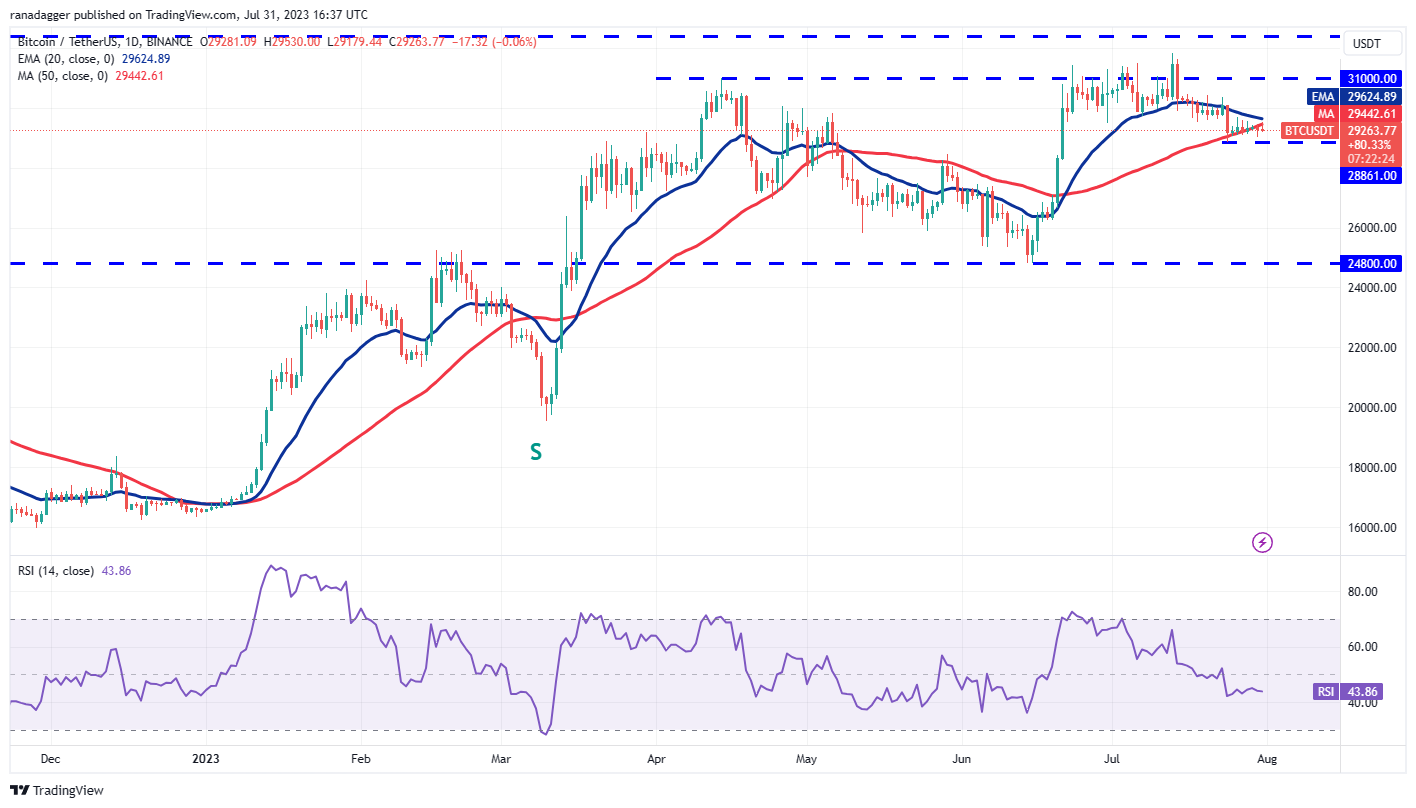 BTC/USDT daily chart. Source: TradingView
The downsloping 20-day EMA ($29,624) and the RSI below 44 suggest that bears hold a slight advantage. Any effort to initiate a relief rally may encounter selling pressure at the 20-day EMA. If the price declines from this resistance and breaks below $28,861, it could trigger a drop to $27,500 and subsequently to $26,000.
If bulls wish to avert this decline, they must push the price above the 20-day EMA. The BTC/USDT pair could initially rise to $29,500 and then target the resistance zone between $31,500 and $32,400.
Ether price analysis
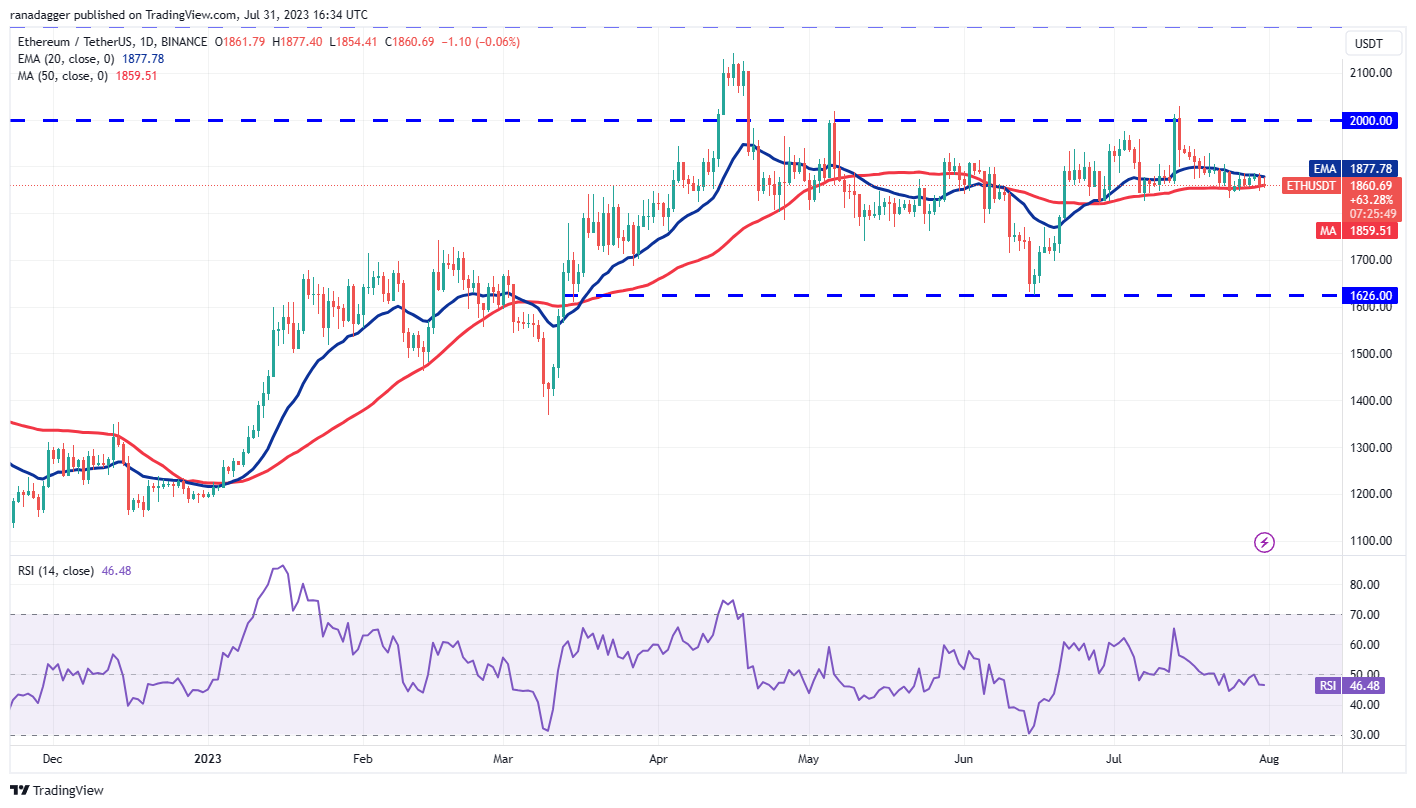
Ether (ETH) has been fluctuating between the moving averages for several days, reflecting uncertainty among bulls and bears regarding the next directional move.
 ETH/USDT daily chart. Source: TradingView
Typically, narrow ranges are followed by a breakout that initiates the next phase of the trending move. If the price falls below the 50-day SMA ($1,859), it will indicate that bears have gained the upper hand over bulls. This may commence a downward movement towards $1,700.
Conversely, if the price rises and closes above the 20-day EMA, it will signal the beginning of a short-term upward move. The ETH/USDT pair could first climb to $1,929 and then attempt a rally towards the psychological resistance at $2,000.
XRP price analysis
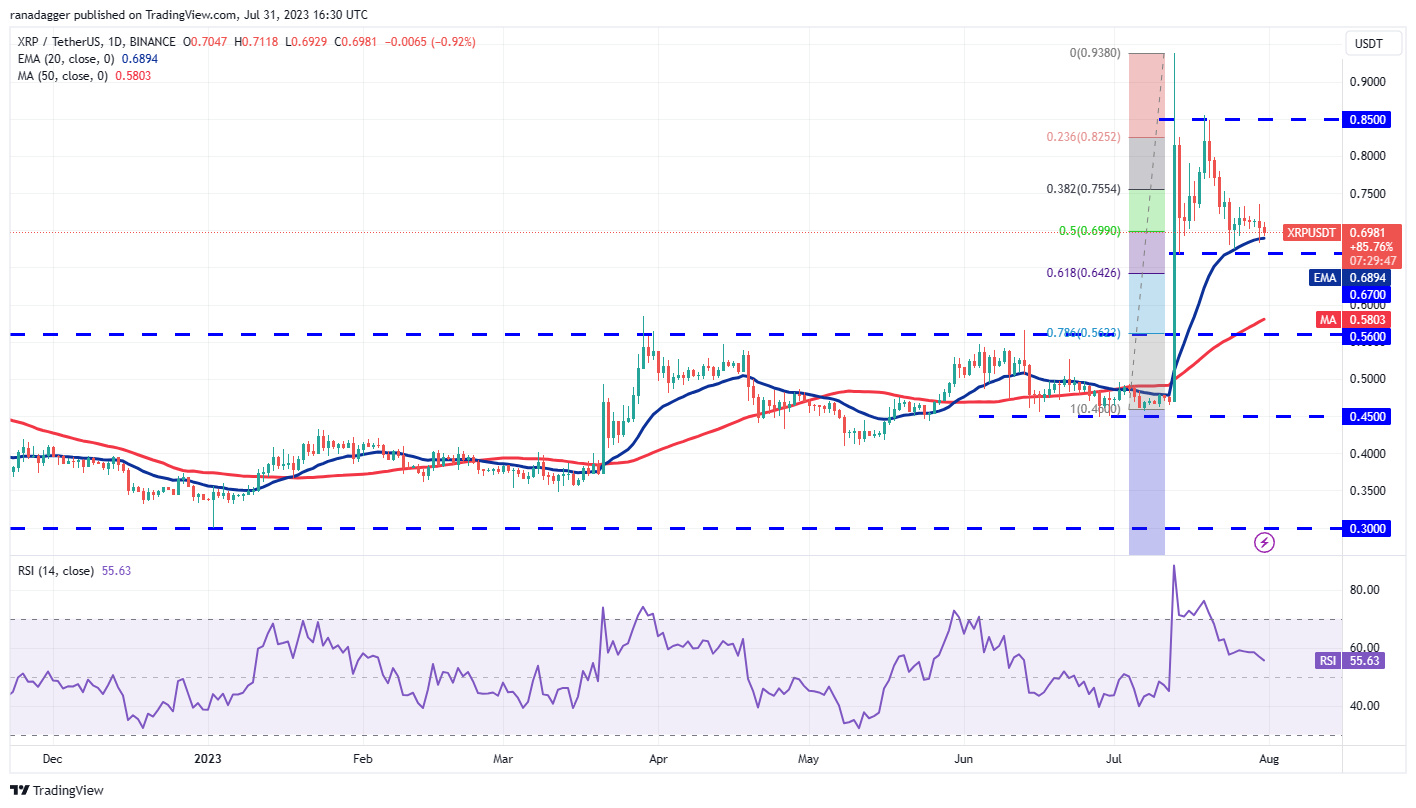
XRP (XRP) has been consolidating within a broad range between $0.67 and $0.85. While the bulls have successfully defended the support, they have not managed to initiate a robust recovery.
 XRP/USDT daily chart. Source: TradingView
Related Posts
The gradually rising 20-day EMA ($0.69) and the RSI in positive territory suggest that bulls have a slight advantage. If buyers overcome the resistance at $0.75, the XRP/USDT pair may begin a relief rally towards the resistance at $0.85.
On the other hand, if the price declines and falls below the 20-day EMA, it will indicate that every minor increase is being sold off. The pair could then retest the support at $0.69. If this support fails, the pair may extend the decline to the breakout level of $0.56.
BNB price analysis
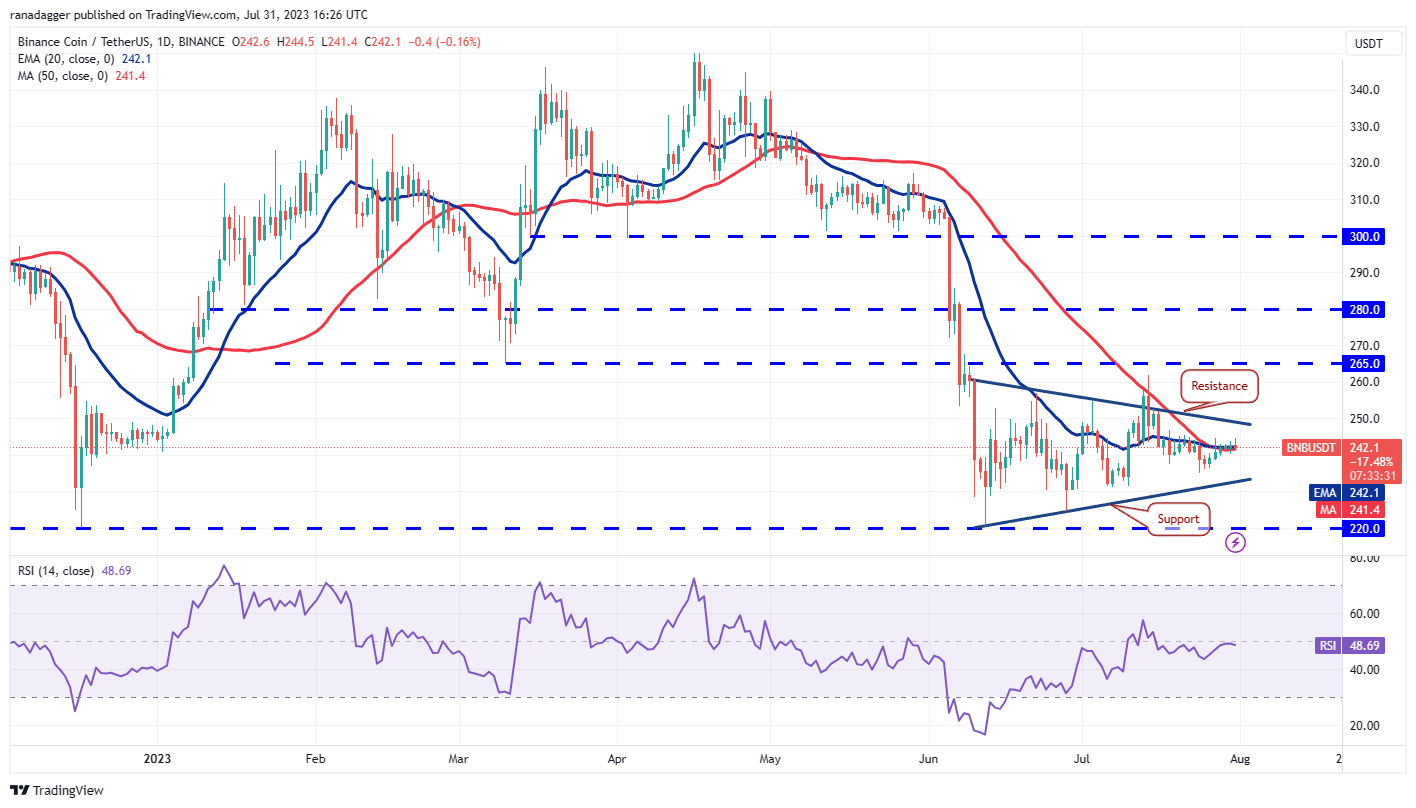
BNB (BNB) continues to trade within a symmetrical triangle pattern, reflecting indecision among bulls and bears.
 BNB/USDT daily chart. Source: TradingView
The flat moving averages and the RSI near the midpoint do not provide a clear advantage to either bulls or bears. If the price remains above the moving averages, the BNB/USDT pair could rise to the resistance line. A break and close above the triangle could drive the price to $265.
Conversely, if the price falls below the moving averages, it will suggest that bears are attempting to pull the pair towards the support line. If this support fails, the pair may drop to $220.
Cardano price analysis
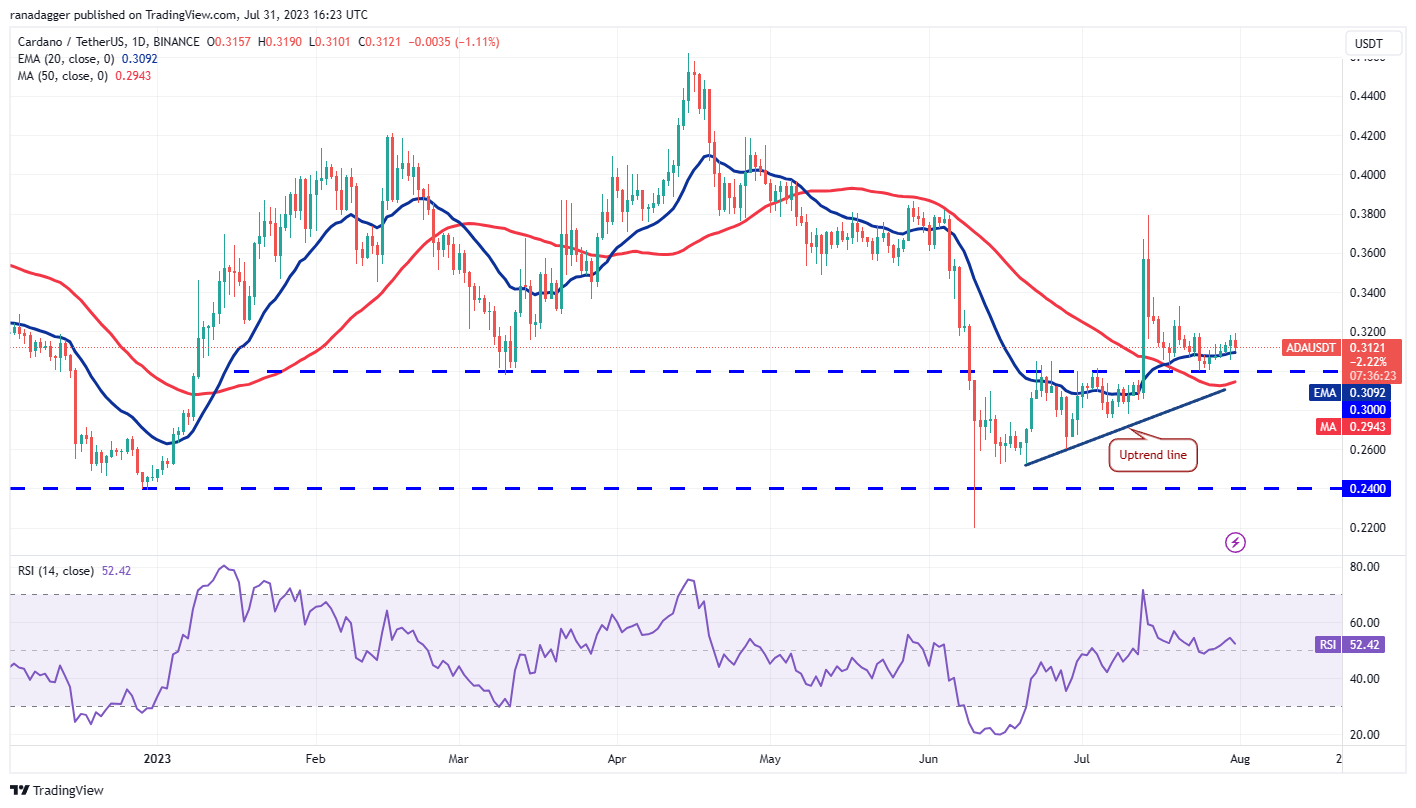
Cardano (ADA) rose above the 20-day EMA ($0.31) on July 28, but the recovery lacks vigor. This indicates that demand is waning at higher levels.
 ADA/USDT daily chart. Source: TradingView
If the price falls back below the 20-day EMA, the ADA/USDT pair may consolidate within a narrow range between $0.30 and $0.32 for a period. Buyers will need to push the price above $0.32 to initiate an upward move to $0.34 and subsequently to $0.38.
Conversely, if the price continues to decline and drops below the 50-day SMA ($0.29), it may trap several aggressive bulls. This could trigger a rush to exit, leading to a deeper correction to $0.28 and then to $0.26.
Related: Bitcoin volume hits lowest since early 2021 amid fear $25K may return
Dogecoin price analysis
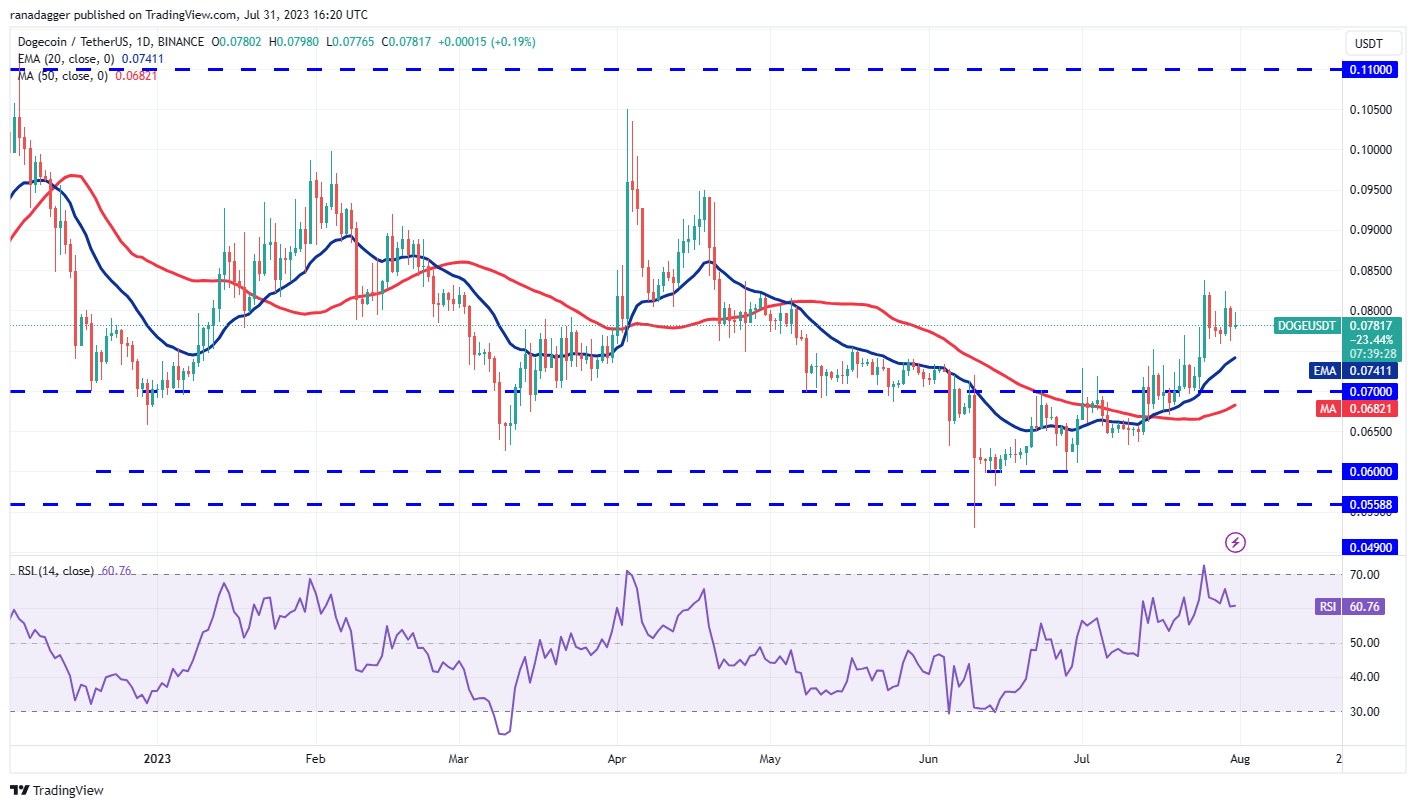
Dogecoin (DOGE) is encountering selling pressure just above the $0.08 mark, but a slight positive is that the bulls have not relinquished ground to the bears. This indicates that buyers anticipate another upward movement.
 DOGE/USDT daily chart. Source: TradingView
The rising 20-day EMA ($0.07) and the RSI in positive territory suggest that bulls hold the advantage. If the price rebounds from the 20-day EMA, the bulls will once again attempt to push the DOGE/USDT pair above the overhead resistance. If successful, the pair may begin its ascent towards $0.10 and ultimately to $0.11.
Alternatively, if the price declines and breaks below the 20-day EMA, it will indicate that the bulls are losing their grip. The pair may then slide to the breakout level at $0.07.
Solana price analysis
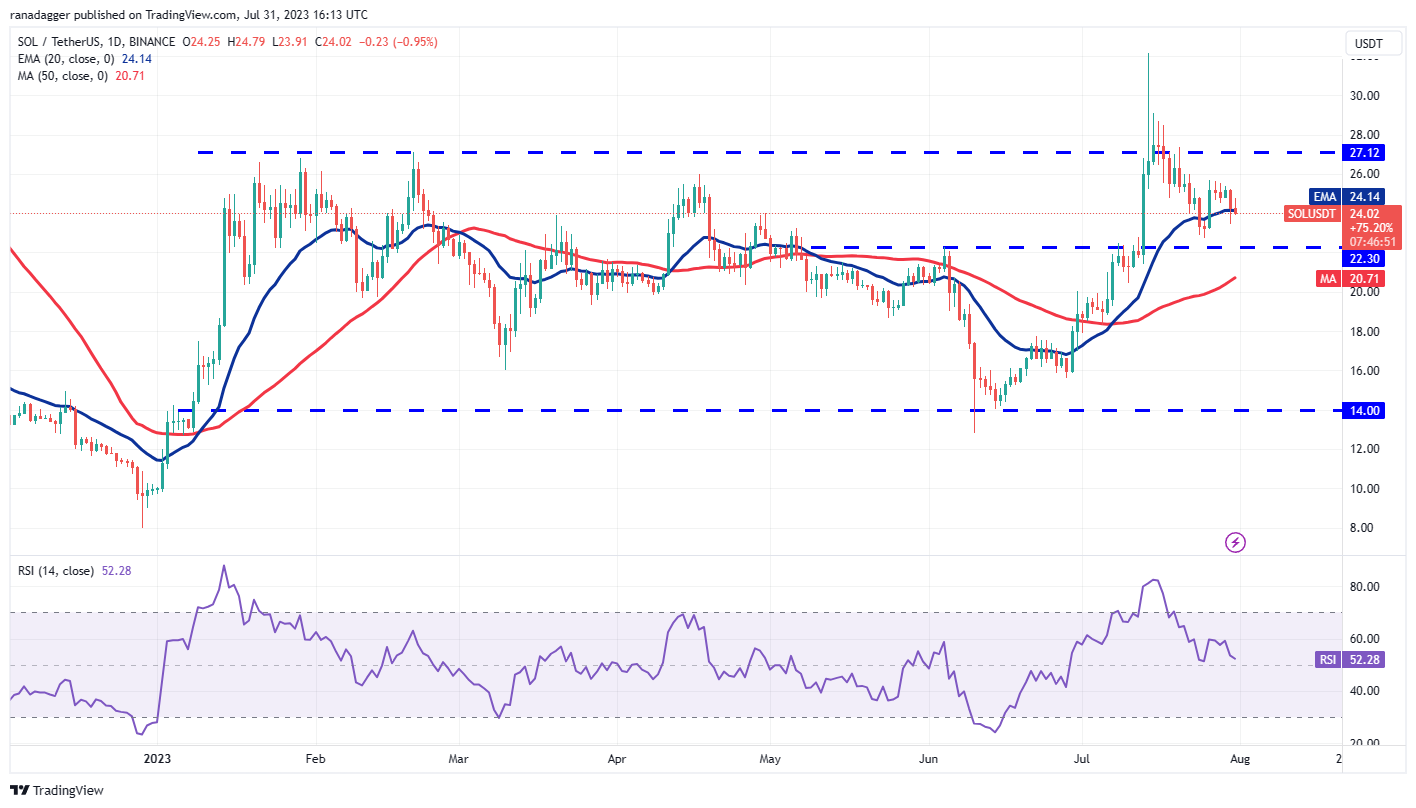
Solana (SOL) is attempting to establish support at the 20-day EMA ($24.14), but the bulls are struggling to maintain the rebound. This suggests that the bears have not surrendered.
 SOL/USDT daily chart. Source: TradingView
If the price breaks and stays below the 20-day EMA, the SOL/USDT pair may decline to $22.30. This remains a crucial short-term support level to monitor. If the price bounces off this level, the pair may consolidate between $22.30 and $27.12 for a while. The flattening 20-day EMA and the RSI near the midpoint also indicate a potential range formation in the near term.
A break and close above $27.12 will signal that bulls are regaining control. The pair may then surge to $32.13. On the downside, a break below $22.30 could pull the pair down to the 50-day SMA ($20.71).
Litecoin price analysis
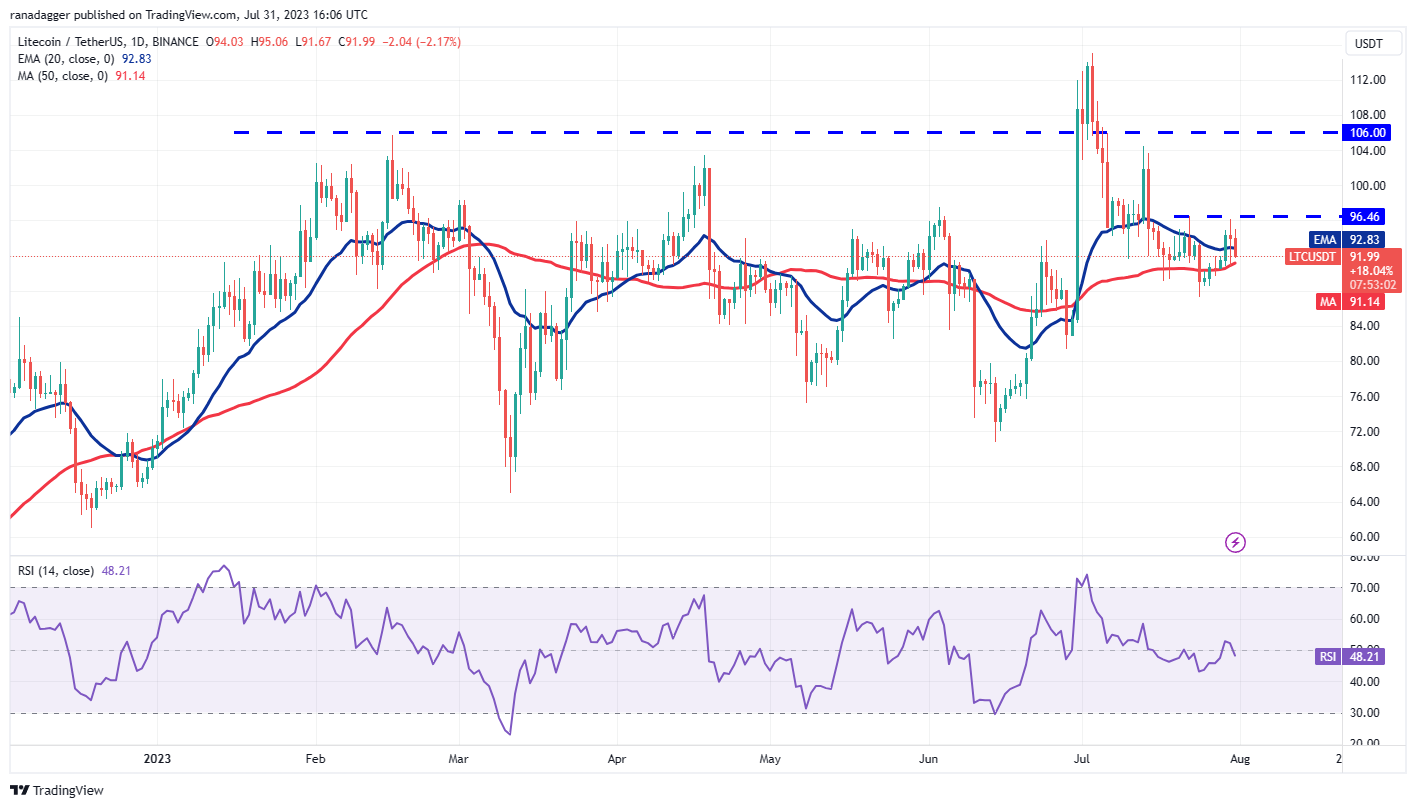
Buyers managed to push Litecoin (LTC) above the 20-day EMA ($92) on July 29, but they were unable to surpass the resistance at $97.
 LTC/USDT daily chart. Source: TradingView
The flat 20-day EMA and the RSI just below the midpoint suggest the potential for a range formation. Buyers bought the dip on July 30, as indicated by the long tail on the candlestick, but they could not build on this strength on July 31. This implies that bears are vigorously defending the $97 level.
If the price falls below the 50-day SMA ($91), the LTC/USDT pair could drop to $87. A strong rebound from this level may keep the pair range-bound for several days. Buyers will need to push the price above $97 to open the path for a rally to $106.
This article does not contain investment advice or recommendations. Every investment and trading move involves risk, and readers should conduct their own research when making a decision.