Disclaimer: Information found on CryptoreNews is those of writers quoted. It does not represent the opinions of CryptoreNews on whether to sell, buy or hold any investments. You are advised to conduct your own research before making any investment decisions. Use provided information at your own risk.
CryptoreNews covers fintech, blockchain and Bitcoin bringing you the latest crypto news and analyses on the future of money.
Bitcoin (BTC) and Ether (ETH) are currently trading above the significant psychological thresholds of $30,000 and $2,000, respectively. This indicates that the prolonged downturn in the crypto market may be nearing its end.
Some market analysts are suggesting that an altseason could be on the horizon, although it might be premature to conclude that. When a majority of crypto bears shift to a bullish stance, Bitcoin may experience a sharp decline, potentially surprising latecomers. This could negatively impact market sentiment in the short term and lead to a sell-off in altcoins. Once the weaker hands are eliminated, the cryptocurrency markets might stabilize and initiate a prolonged upward trend.
Daily cryptocurrency market performance. Source: Coin360
Insights from the on-chain analytics platform Glassnode indicate notable parallels between the current halving cycle and previous ones. However, Ecoinometrics cautioned that an economic downturn could disrupt these patterns.
We should monitor the charts of the top-10 cryptocurrencies to identify key resistance levels that may trigger a pullback.
Bitcoin price analysis
The bears attempted to halt the upward movement on April 12, but the bulls remained persistent. They resumed their buying activity on April 13 and overcame the resistance at $30,550 on April 14.
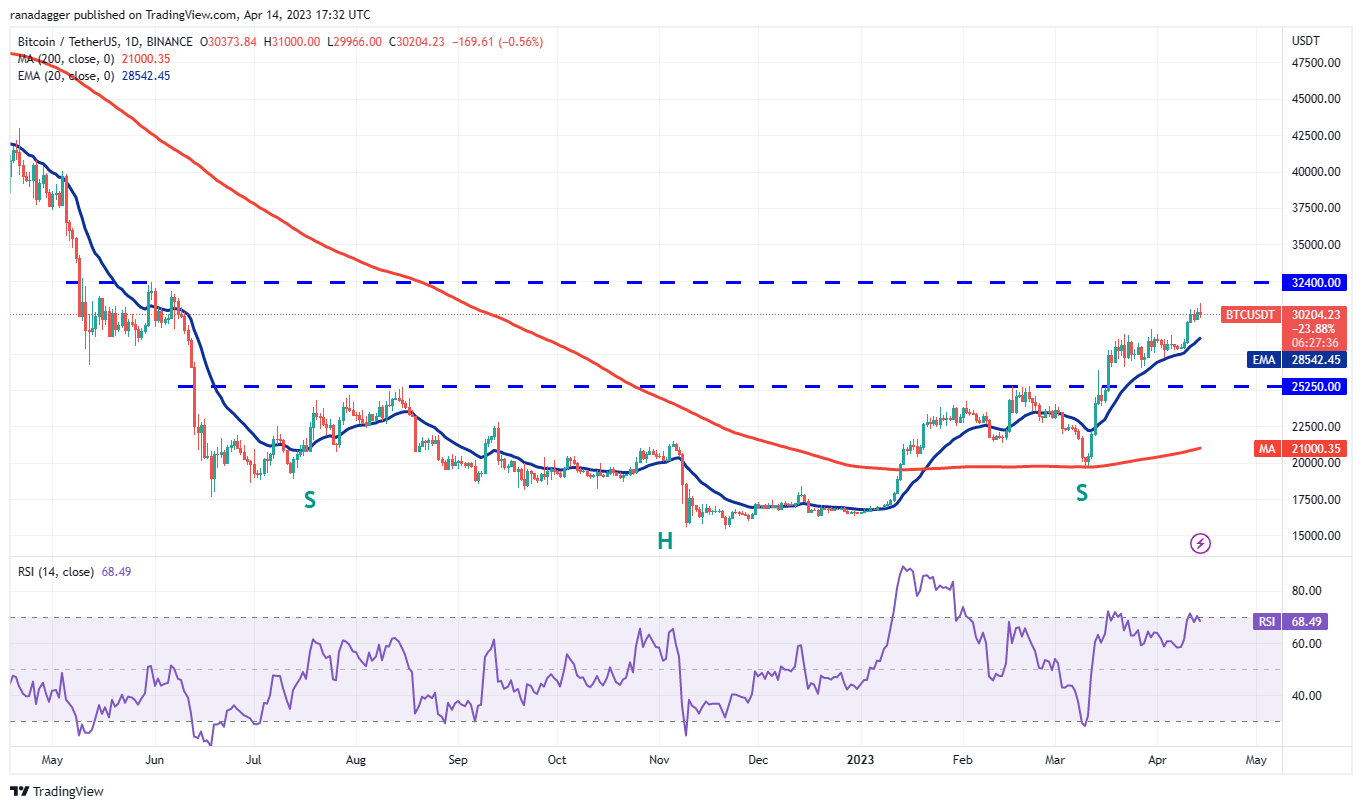 BTC/USDT daily chart. Source: TradingView
If buyers maintain the price above $30,550, the BTC/USDT pair could surge to $32,400. The bears are anticipated to defend this level vigorously.
If the price declines from this point but remains above the 20-day EMA ($28,542), it will improve the chances of a rally beyond $32,400. Should this level be surpassed, the pair might soar towards $40,000.
Conversely, if the 20-day EMA is breached, it would indicate that the bears are attempting a comeback. This could pave the way for a potential drop to $25,250.
Ether price analysis
Ether (ETH) rebounded from the 20-day EMA ($1,870) on April 12, signaling that the bulls are defending this level robustly.
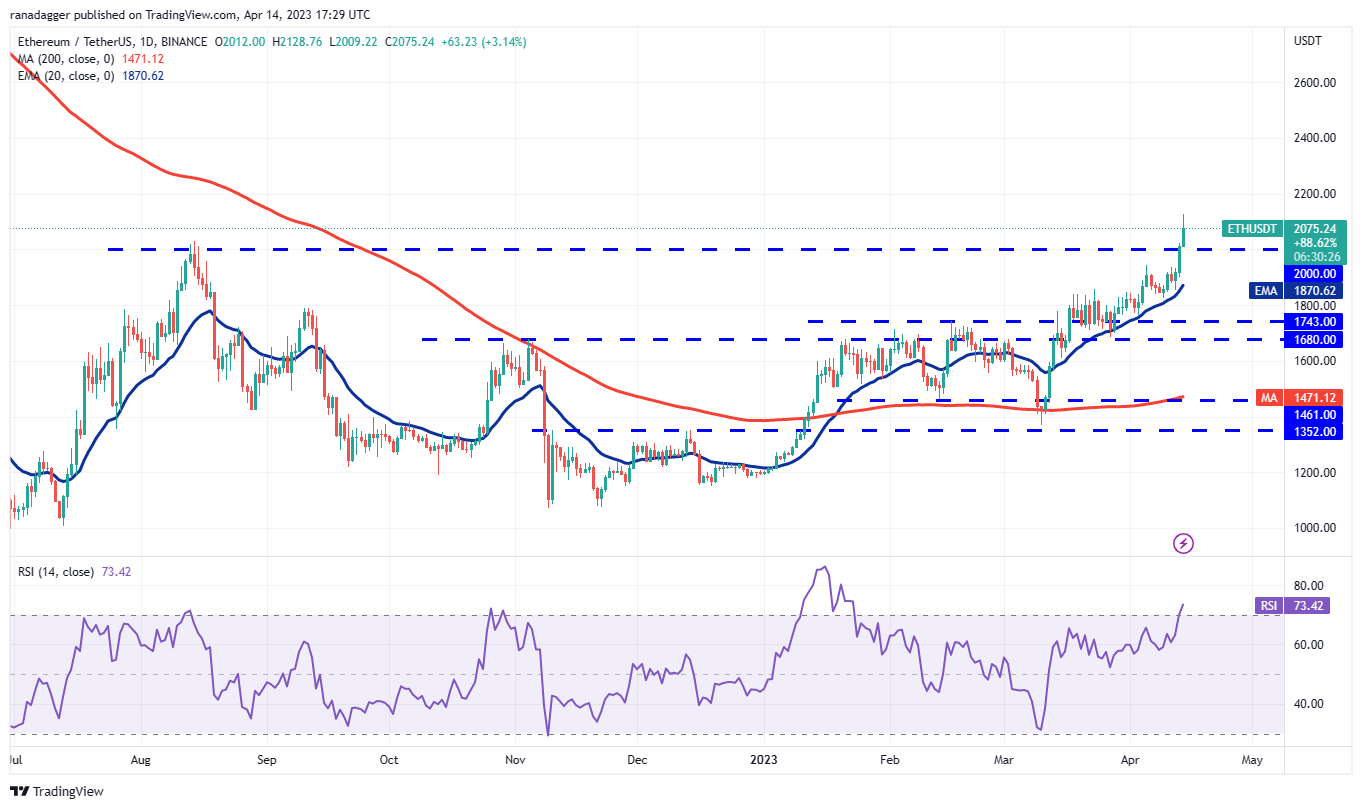 ETH/USDT daily chart. Source: TradingView
The buying momentum continued on April 13, with the bulls pushing the price above the crucial psychological level of $2,000. This attracted additional buying interest, propelling the ETH/USDT pair towards $2,200. This level is critical for the bears to protect; failure to do so could lead to a buying frenzy, potentially driving the pair up to $3,000.
On the other hand, if the price declines from $2,200 and falls below $2,000, the pair may drop to the 20-day EMA. This level is significant to monitor, as a breach below it could lead to a decline to $1,680.
BNB price analysis
The bulls prevented BNB (BNB) from falling below the 20-day EMA ($317) on April 12 and 13, indicating a shift in sentiment towards the positive, with traders buying on dips.
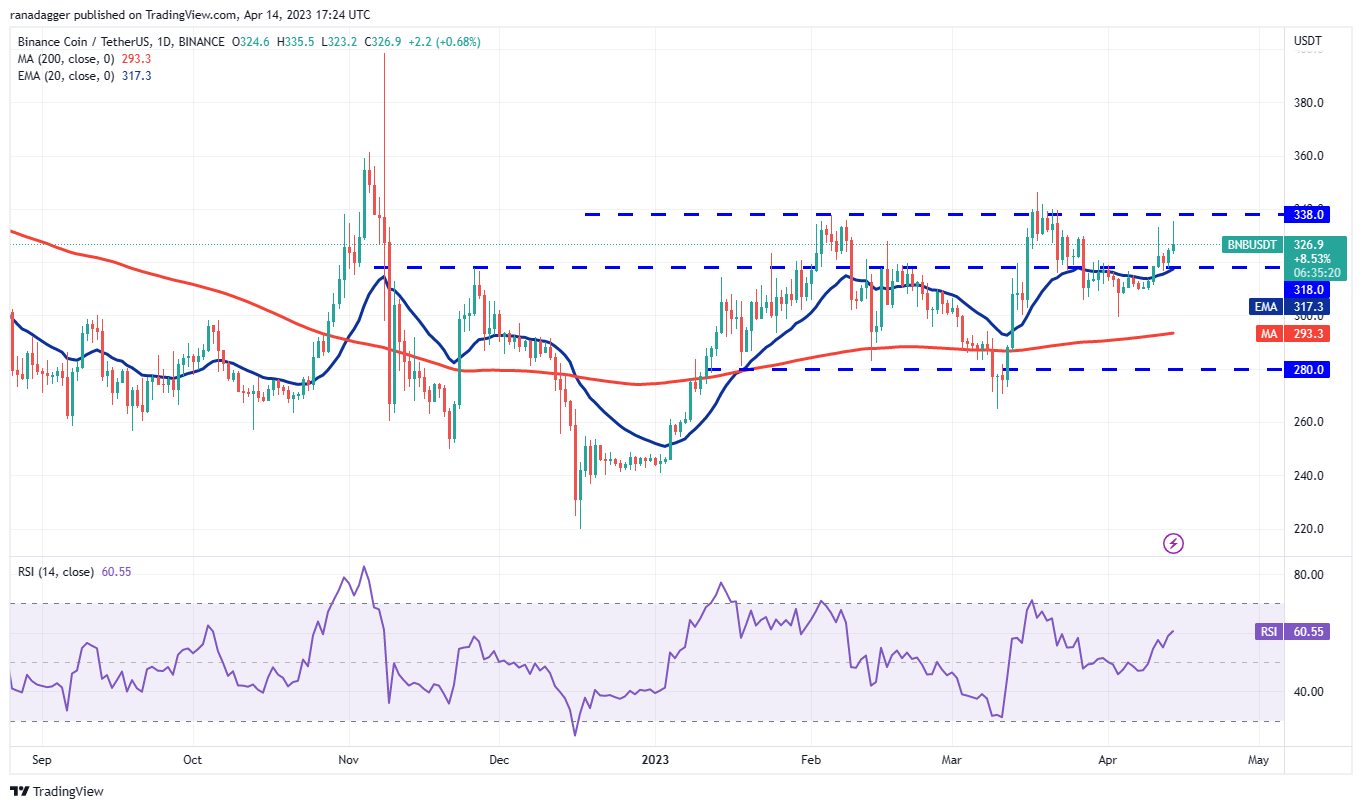 BNB/USDT daily chart. Source: TradingView
The 20-day EMA has begun to rise, and the RSI has moved above 60, suggesting that the momentum is shifting in favor of the bulls.
Buyers will aim to strengthen their position by pushing the price above the $338 to $346 resistance zone. If successful, the BNB/USDT pair may gain momentum and rally to $360 and then to $400.
In contrast, if the price declines from the resistance zone, it would indicate that the bears are active at higher levels, potentially keeping the pair trapped between the 20-day EMA and $346 for a while.
XRP price analysis
Buyers successfully defended the 38.2% Fibonacci retracement level of $0.49, which attracted further buying in XRP (XRP) and pushed the price towards the resistance zone of $0.56 to $0.58.
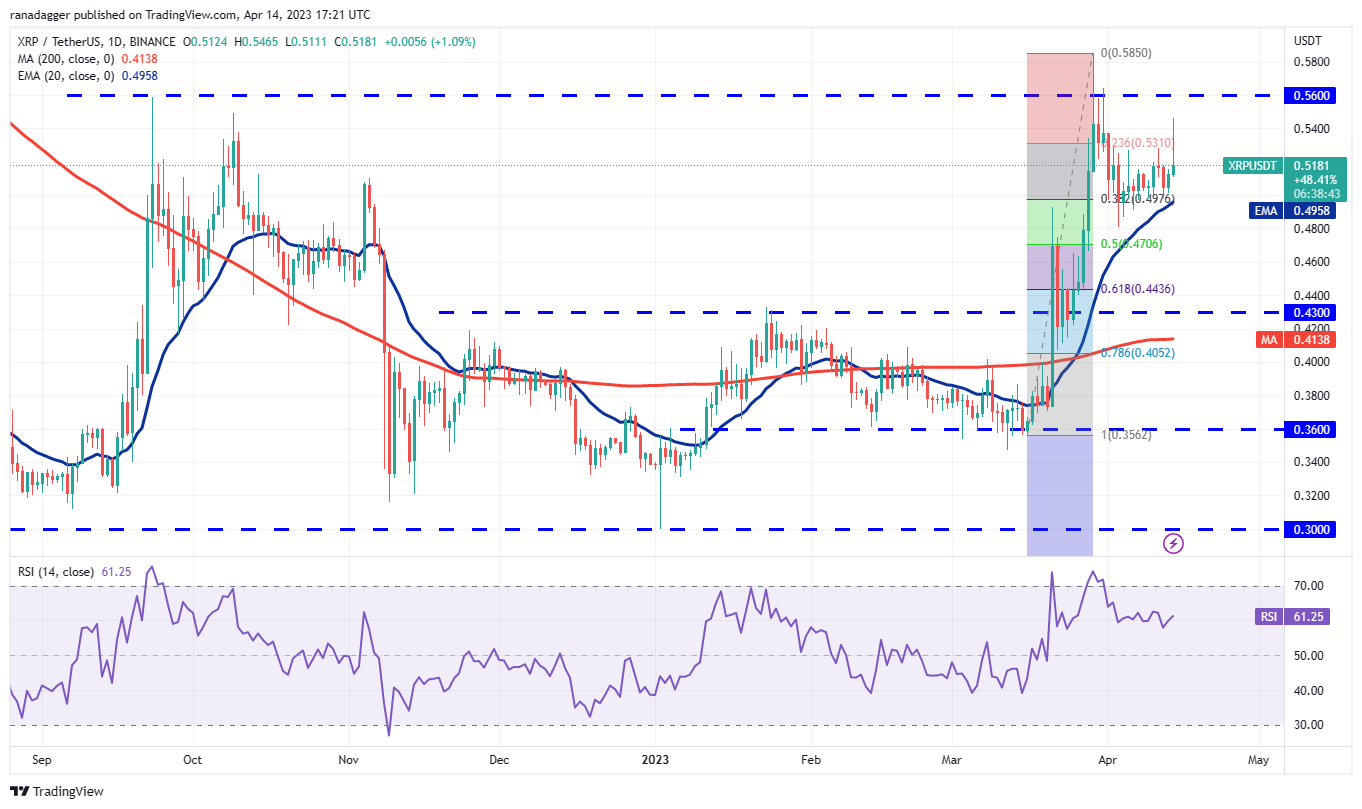 XRP/USDT daily chart. Source: TradingView
The upward-sloping 20-day EMA ($0.49) and the RSI in the positive territory indicate that the bulls hold a slight advantage. If buyers manage to push the price above $0.58, the XRP/USDT pair may initiate an upward movement that could reach $0.65 and then $0.80.
Conversely, if the price declines from the resistance zone, it may suggest that the pair could consolidate between $0.49 and $0.58 for several days. The trend would favor the bears if the price falls below $0.49.
Cardano price analysis
Cardano (ADA) surged past the neckline of the inverse H&S pattern on April 13, completing the reversal setup.
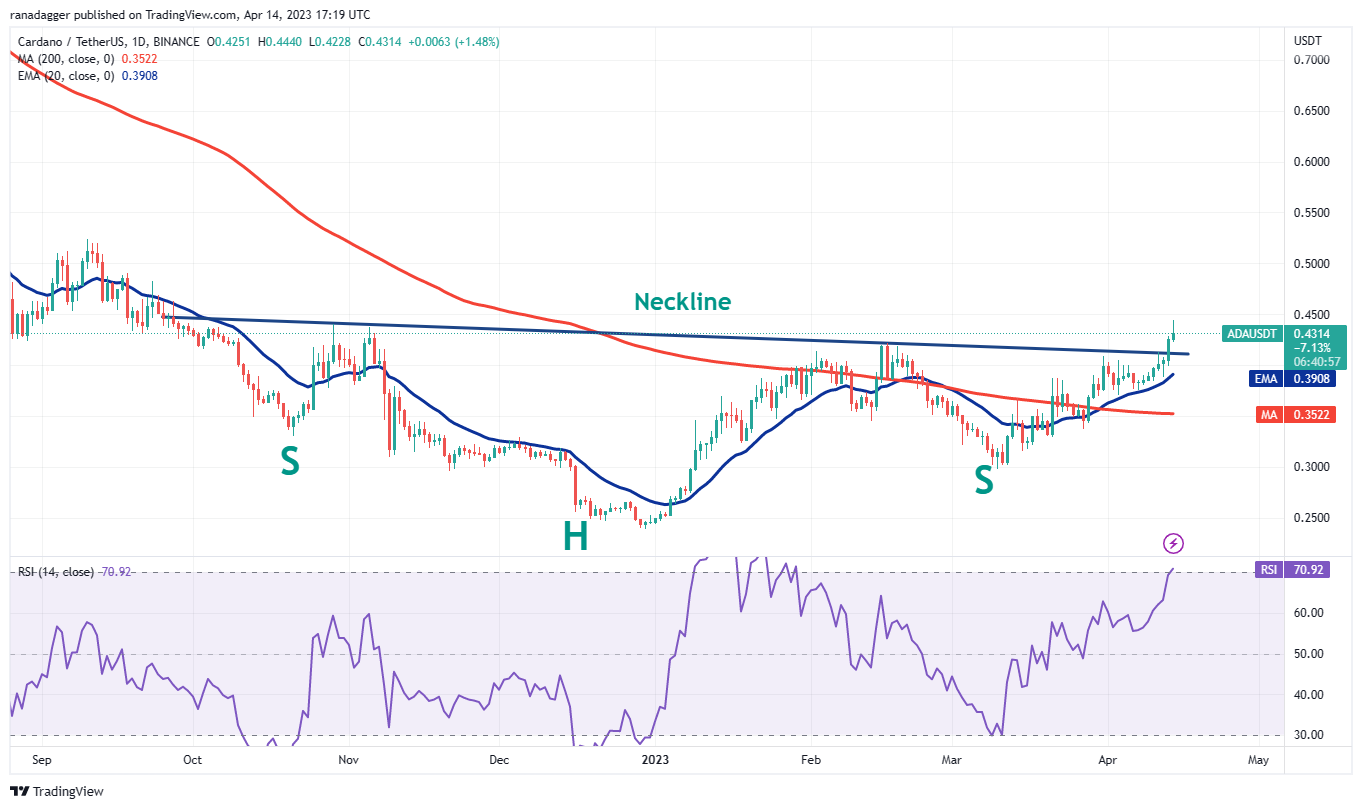 ADA/USDT daily chart. Source: TradingView
Related Posts
Typically, following a breakout from a pattern, the price tends to retrace and test the breakout level. In this instance, the ADA/USDT pair may dip back to the neckline. If the price rebounds from this level, it would indicate that the bulls have converted the level into support, potentially initiating an upward movement towards the pattern target of $0.60.
In contrast, if the price sharply declines and breaks below $0.37, it would suggest that the breakout above the neckline was a false signal. The pair could then drop to $0.30.
Dogecoin price analysis
Dogecoin (DOGE) rebounded from the moving averages on April 12, as evidenced by the long tail on the day’s candlestick.
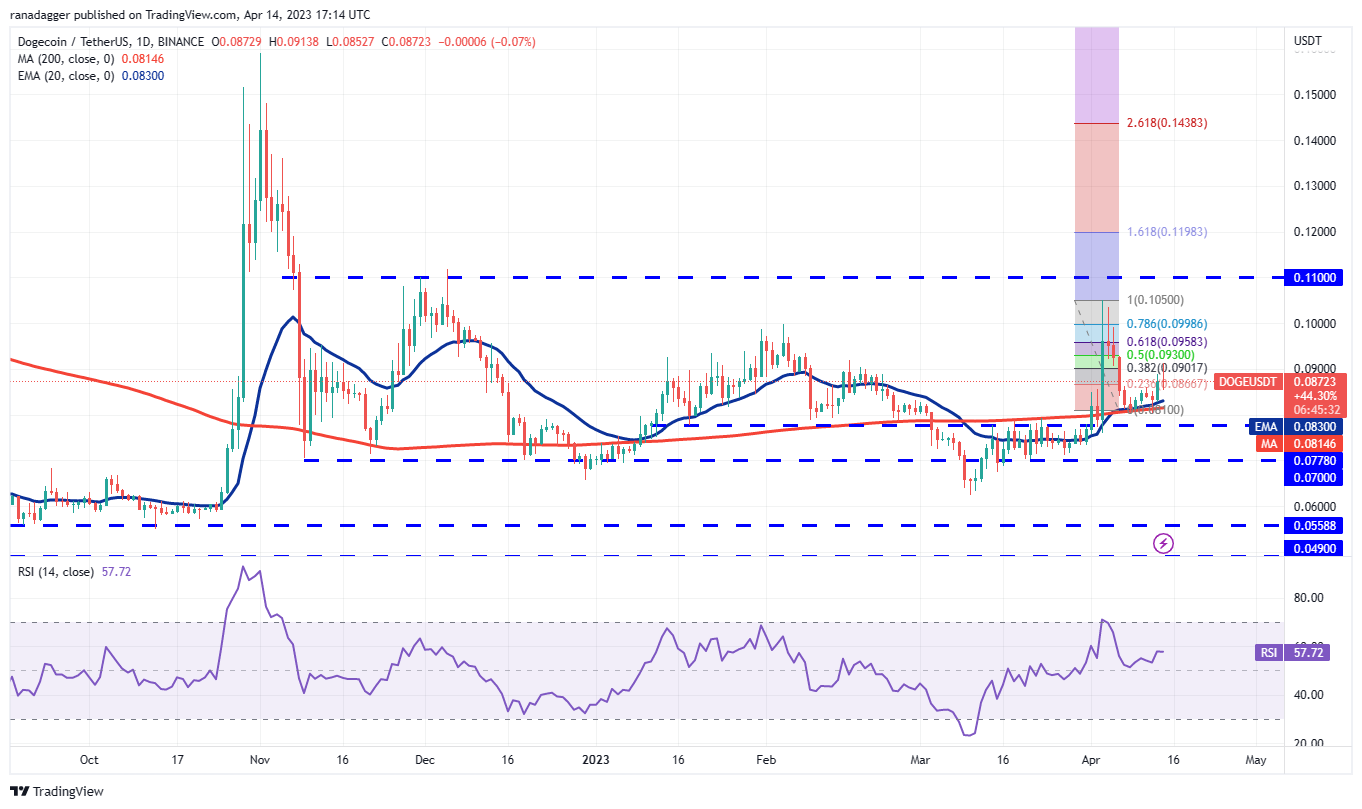 DOGE/USDT daily chart. Source: TradingView
The bulls attempted to push the DOGE/USDT pair above the 38.2% Fibonacci retracement level of $0.09, but the bears resisted. This indicates that sentiment remains negative, with traders selling during rallies.
Buyers need to drive and maintain the price above $0.09 to signal a reduction in selling pressure. If successful, the pair may then rise to the 61.8% retracement level of $0.10. Typically, a break and close above this level leads to a full retracement. If that occurs, the pair could surge to $0.11.
Polygon price analysis
Polygon (MATIC) fell below the support line of the symmetrical triangle pattern on April 12, but the long tail on the candlestick indicates that bulls aggressively bought at lower levels.
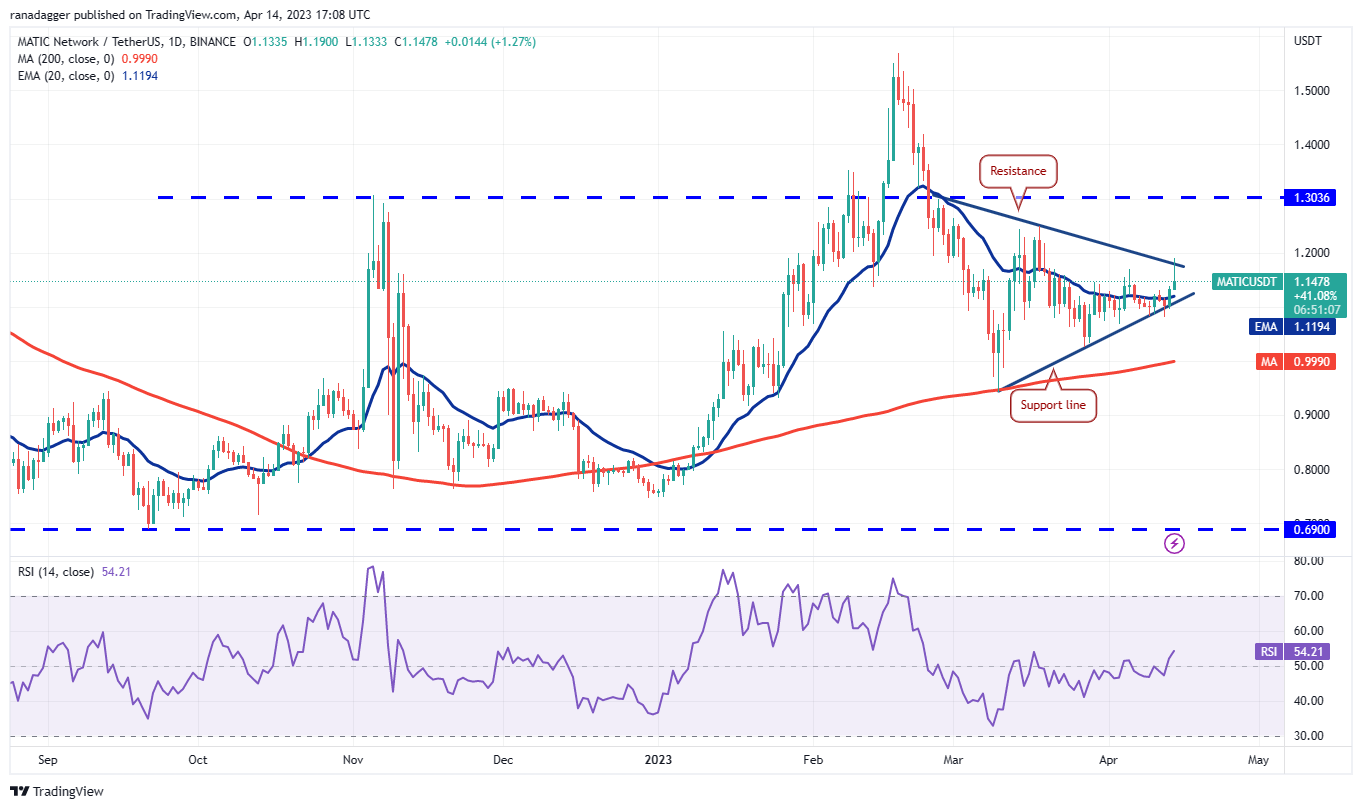 MATIC/USDT daily chart. Source: TradingView
The MATIC/USDT pair rebounded and broke above the 20-day EMA ($1.11) on April 13, which may have trapped aggressive bears, resulting in a short squeeze. The pair reached the resistance line of the triangle on April 14, where bears are presenting a strong challenge.
If bulls push the price above the triangle, the rally may extend to the resistance at $1.30. This level may again prove to be a significant barrier, but if surpassed, the upward movement could reach $1.60. This optimistic outlook will be invalidated in the near term if the price declines and falls below $1.08.
Related: BTC price targets see $33K next as Bitcoin eyes key resistance flip
Solana price analysis
The bulls have capitalized on the breakout from the downtrend line in Solana (SOL), indicating demand at elevated levels.
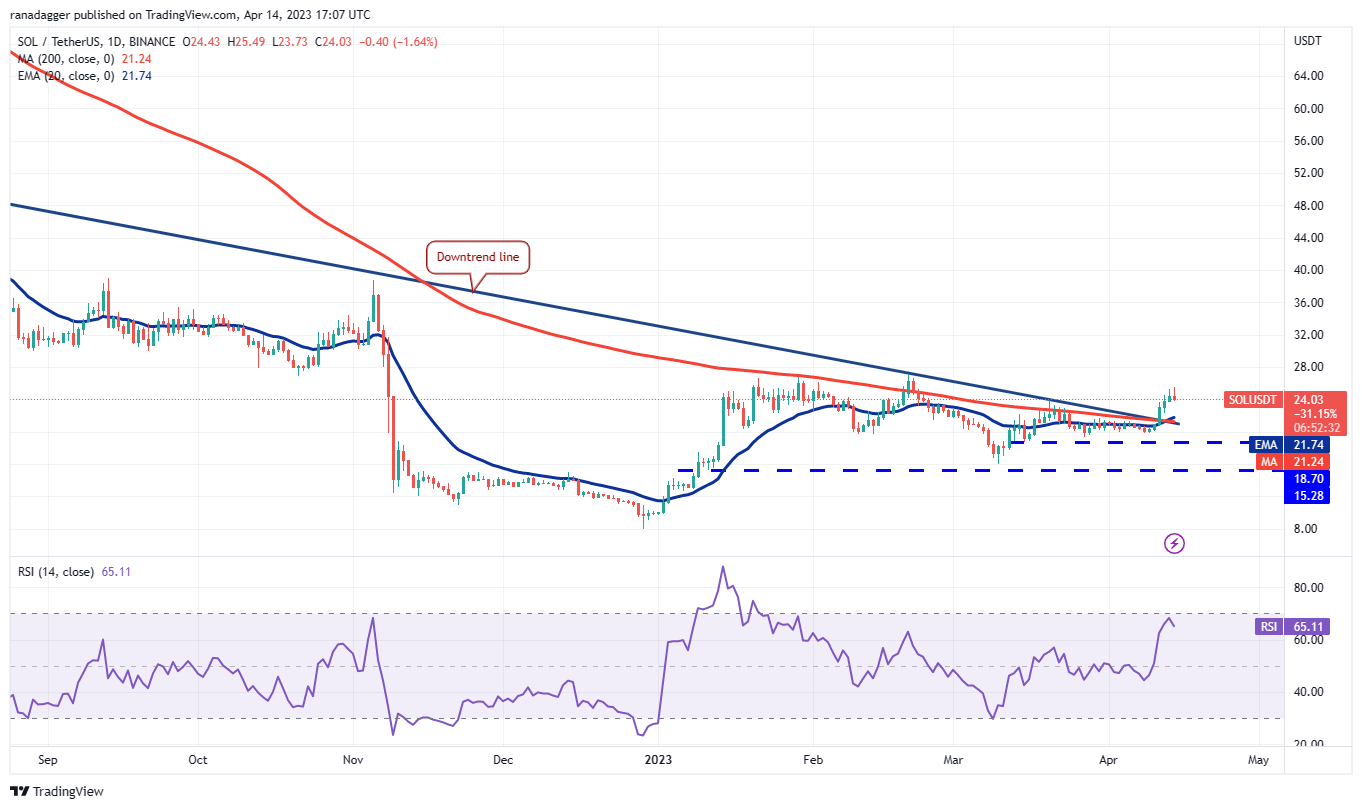 SOL/USDT daily chart. Source: TradingView
The rising 20-day EMA ($21.74) and the RSI approaching the overbought zone suggest an advantage for buyers. The SOL/USDT pair could rise to $27.12, where bears may mount a strong defense. If bulls overcome this obstacle, the pair may continue its ascent towards $39.
On the downside, the downtrend line is a critical level to monitor. Bears will need to push and maintain the price below the downtrend line to trap aggressive bulls. If successful, the pair may then plummet to $15.28.
Polkadot price analysis
The long tail on the April 12 candlestick indicates that bulls bought the dip to the 20-day EMA ($6.32). Polkadot (DOT) continued its upward trajectory and broke above the downtrend line on April 13, but bulls are encountering selling pressure at higher levels.
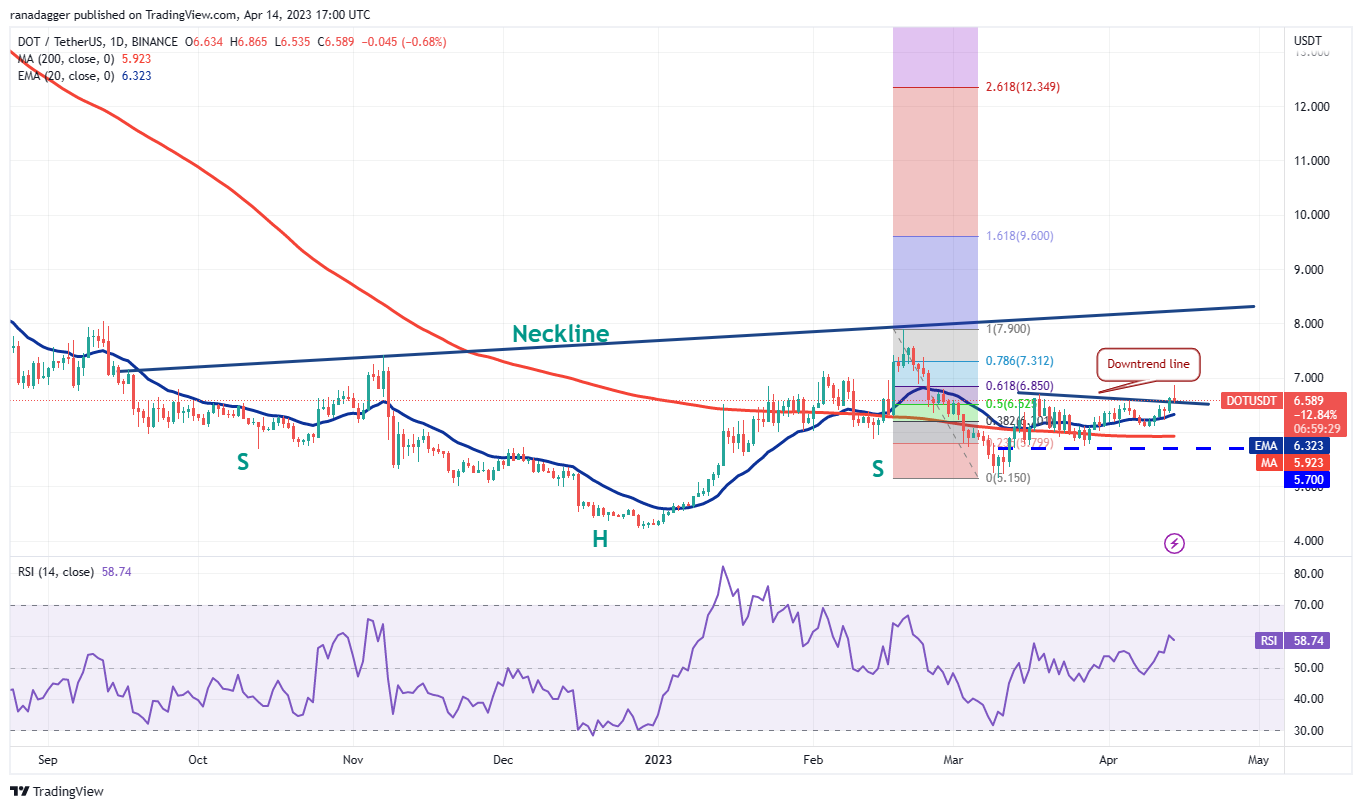 DOT/USDT daily chart. Source: TradingView
The DOT/USDT pair retraced from the 61.8% Fibonacci retracement level of $6.85, and bears are attempting to pull the price back below the downtrend line. If they succeed, the pair may decline to the 20-day EMA. A breach below this level could sink the pair to the critical support at $5.70.
Conversely, if the price rises and closes above $6.85, it may propel the price to the neckline of the inverse H&S pattern. If bulls break through this overhead resistance, the pair may initiate a new upward trend.
Litecoin price analysis
Litecoin (LTC) rebounded from the 20-day EMA ($91) on April 13, indicating that bulls continue to see dips as buying opportunities.
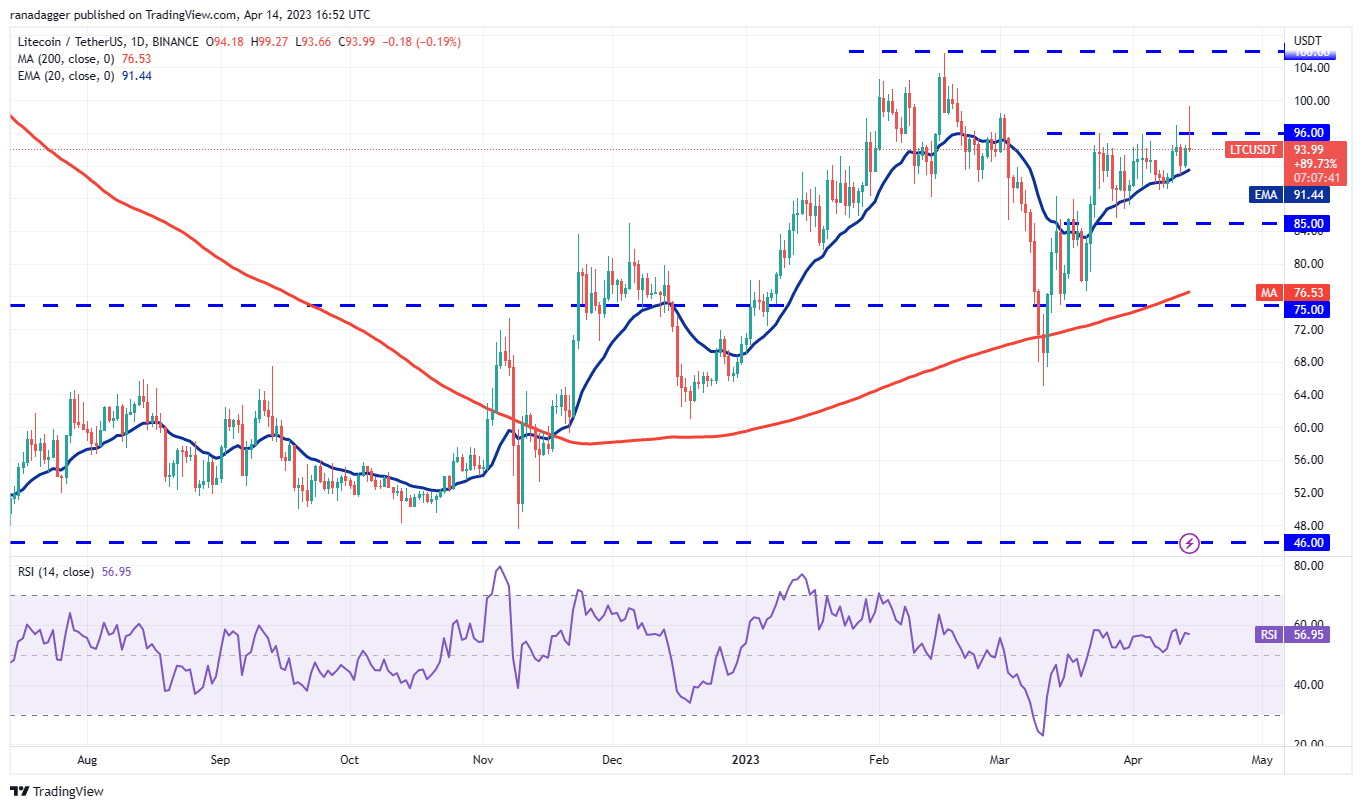 LTC/USDT daily chart. Source: TradingView
The bulls attempted to further strengthen their position by pushing the price above the immediate resistance at $96 on April 14, but the long wick on the day’s candlestick indicates that bears are actively selling during rallies.
If bears pull the price below the 20-day EMA, it could trap several aggressive bulls. The LTC/USDT pair may then decline to $85. Conversely, if the price rises and holds above $96, it will open the path for a potential rally to $106.
The views, thoughts and opinions expressed here are the authors’ alone and do not necessarily reflect or represent the views and opinions of Cointelegraph.
This article does not contain investment advice or recommendations. Every investment and trading move involves risk, and readers should conduct their own research when making a decision.