Disclaimer: Information found on CryptoreNews is those of writers quoted. It does not represent the opinions of CryptoreNews on whether to sell, buy or hold any investments. You are advised to conduct your own research before making any investment decisions. Use provided information at your own risk.
CryptoreNews covers fintech, blockchain and Bitcoin bringing you the latest crypto news and analyses on the future of money.
The equities markets in the United States are showing signs of recovery. The S&P 500 Index (SPX) rose by 2.50% last week, marking its strongest performance since June. While Bitcoin (BTC) also made an effort for a relief rally, the upward momentum could not be maintained. Ultimately, Bitcoin concluded the week with a slight decline of 0.5%.
A significant factor contributing to Bitcoin’s loss of gains was the Securities and Exchange Commission’s postponement of its decision regarding all spot Bitcoin exchange-traded fund applications. Nevertheless, this has not diminished analysts’ expectations.
In a recent report, analysts from JPMorgan indicated that the regulator will eventually approve multiple Bitcoin ETFs.
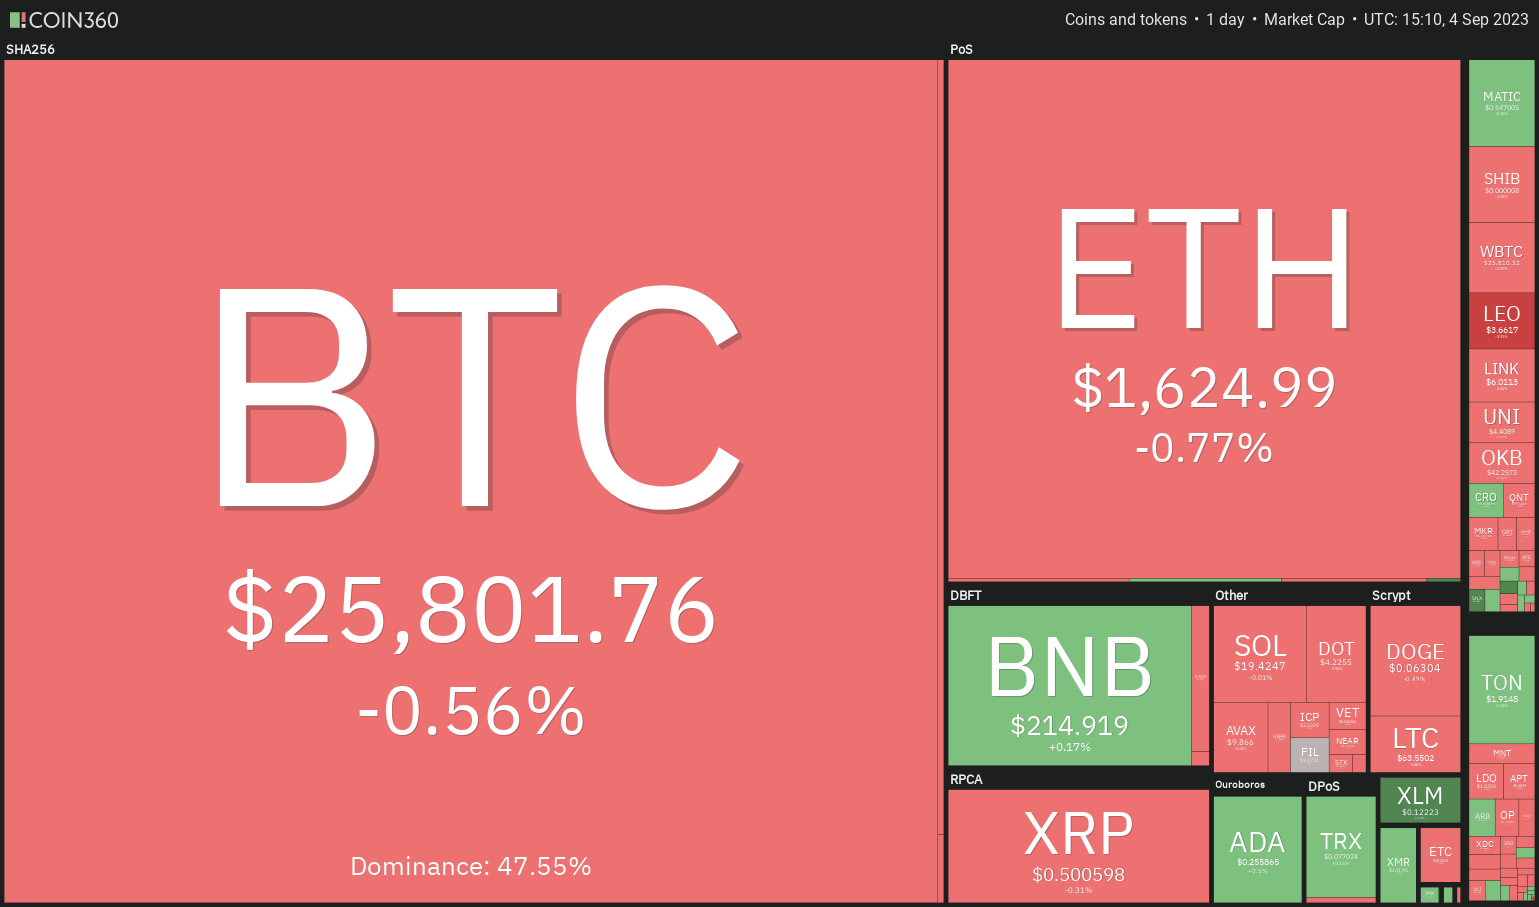 Daily cryptocurrency market performance. Source: Coin360
The short-term price movements of Bitcoin remain uncertain. However, this has not discouraged long-term investors who continue to hold their assets. Data from Glassnode reveals that the supply of Bitcoin that has been mined and inactive for three years or more has reached a new peak of 40.538%.
Is there a possibility for Bitcoin to break out of its current range in the coming days? What key levels should be monitored? Let’s examine the charts for insights.
S&P 500 Index price analysis
The S&P 500 Index surpassed the moving averages on Aug. 29, signaling that bulls have initiated a robust relief rally.
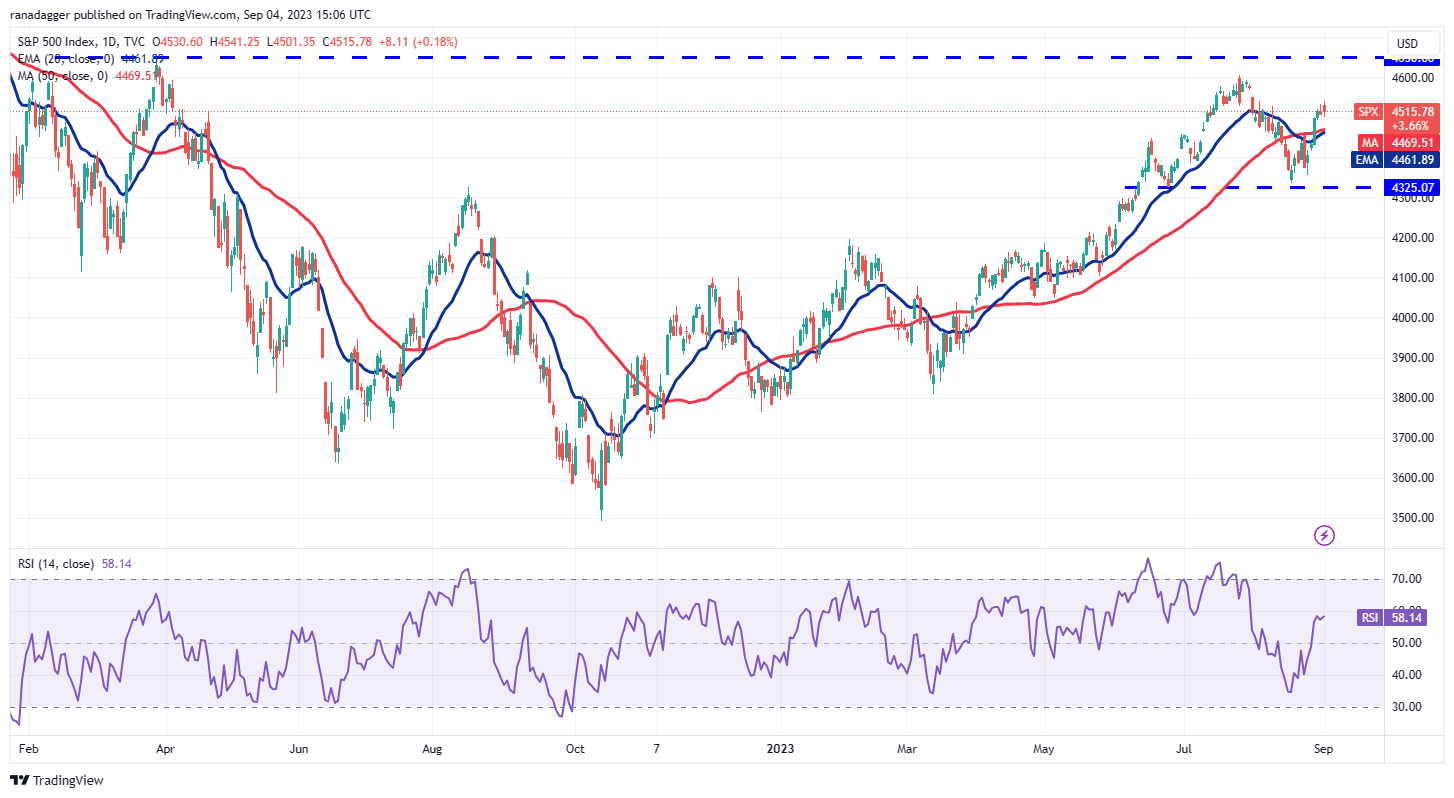 SPX daily chart. Source: TradingView
If buyers can maintain the price above the moving averages, it will indicate that sentiment remains optimistic and traders are purchasing during minor dips. This will improve the chances of a rally beyond the overhead resistance at 4,607. If this level is breached, the index will aim to rise to 4,650 and subsequently to 4,800.
Reestablishing the uptrend may prove challenging as bears will attempt to pull the price below the moving averages. Should they succeed, the pair may decline to the strong support at 4,325. The bears will need to breach this level to initiate a new downtrend.
U.S. dollar index price analysis
The U.S. dollar index (DXY) rebounded from the downtrend line on Aug. 30 and 31, indicating that bulls have converted this level into support.
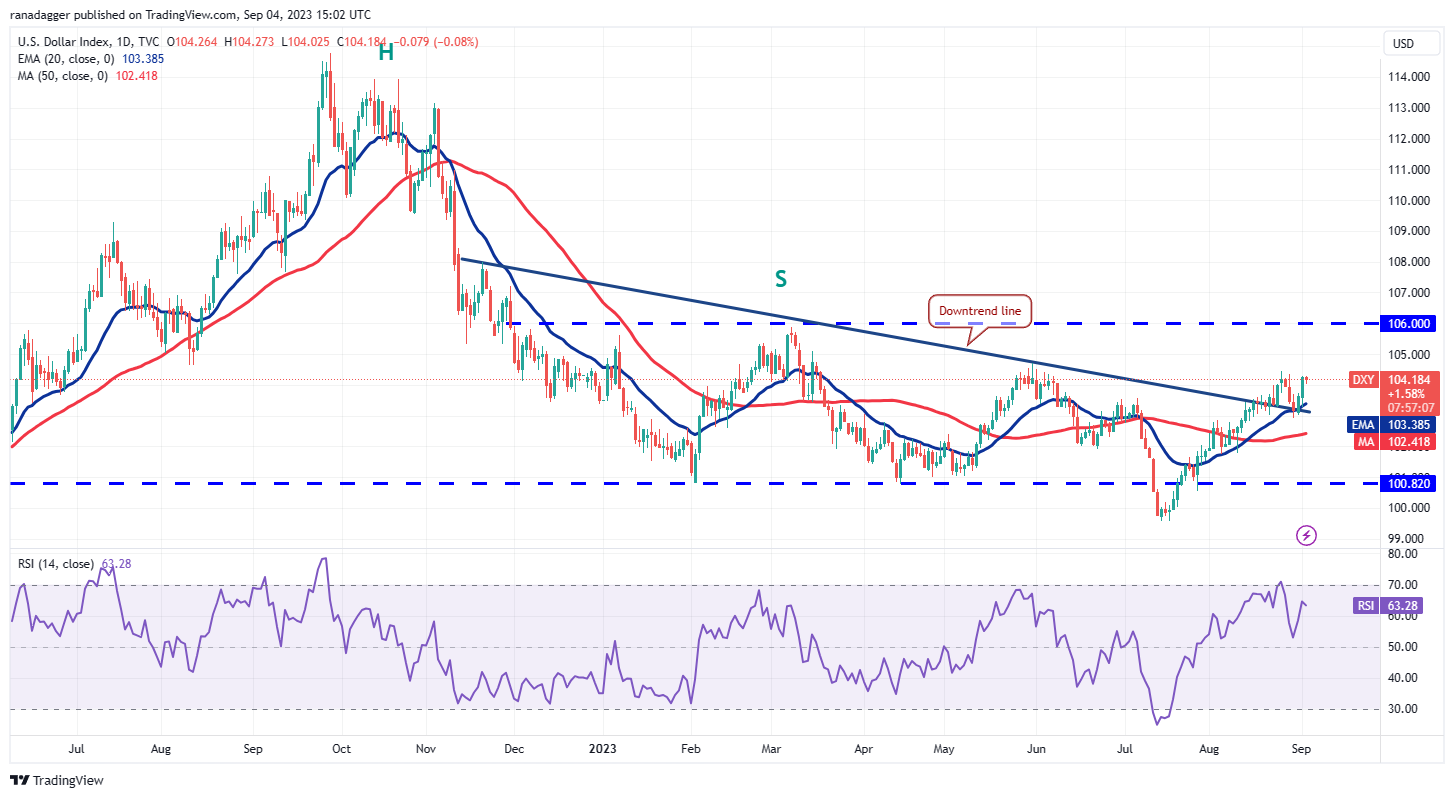 DXY daily chart. Source: TradingView
The bulls will next attempt to push the price above 104.45 and initiate a rally toward the overhead resistance at 106. This level is likely to see significant selling from bears, as a break above it would suggest the downtrend may be concluding. The index could then rise to 108.
The key support to monitor on the downside is the downtrend line. If this support fails, the index may drop to the 50-day SMA (102.41) and eventually to the critical support at 100.82.
Bitcoin price analysis
Bitcoin is currently trading near the support of the broad range between $24,800 and $31,000. When prices fluctuate within a range, bulls typically buy on dips near the support and sell near the resistance.
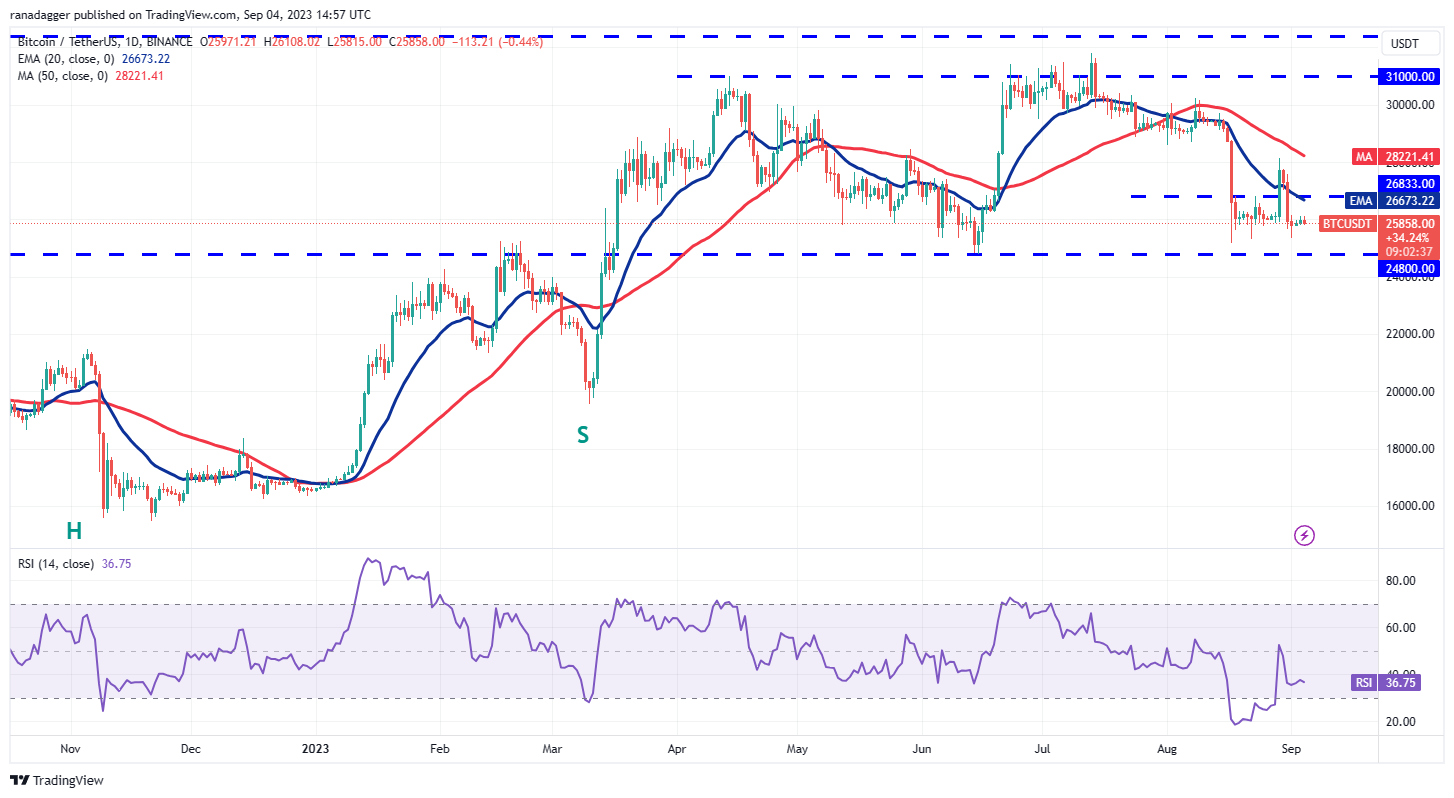 BTC/USDT daily chart. Source: TradingView
The $24,800 level is expected to see a fierce contest between bulls and bears. If this level is breached, selling pressure is likely to increase, and the BTC/USDT pair could plummet to the critical support at $20,000. There is minor support at $24,000, but it may not hold for an extended period.
Alternatively, the price could rebound from the current level. If bulls overcome the resistance at $26,833, the pair could accelerate toward the 50-day SMA ($28,221). Such a movement would suggest that the pair may remain within the $24,800 to $31,000 range for a longer duration.
Ether price analysis
Ether (ETH) fell below the strong support at $1,626 on Sep. 1, but the long tail on the candlestick indicates robust buying at lower levels.
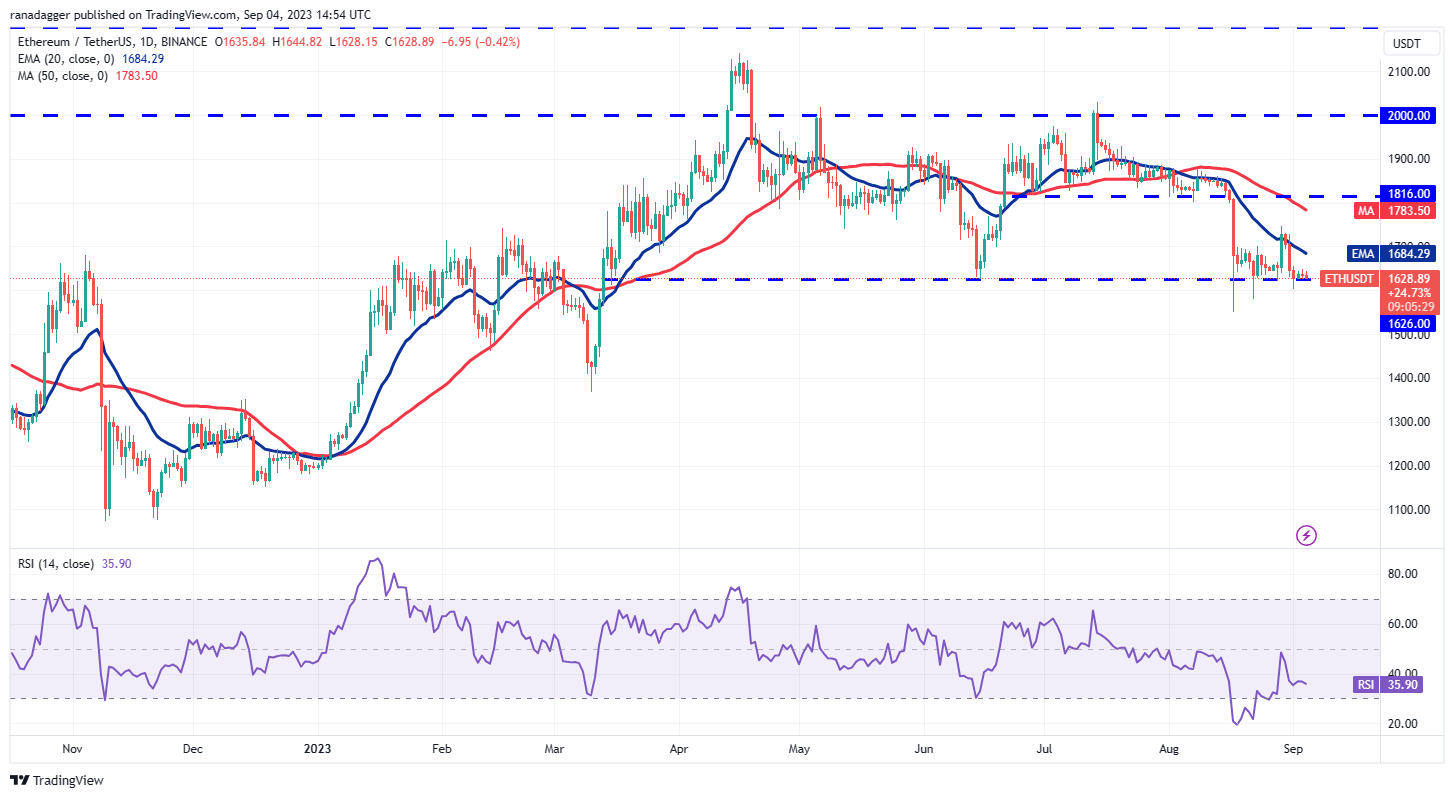 ETH/USDT daily chart. Source: TradingView
The bulls are attempting to rectify the situation but are struggling to initiate a rebound. This indicates a lack of demand at higher levels. Both moving averages are trending downward, and the RSI is in negative territory, suggesting that bears remain in control.
If sellers push the price below $1,600, the ETH/USDT pair could drop to the intraday low of $1,550 from Aug. 17. This level is crucial in the short term, as a decline below it may open the door for a drop to $1,368.
The first sign of strength would be a break above the 20-day EMA ($1,684). The pair could then rise to the overhead resistance at $1,750.
BNB price analysis
BNB (BNB) has been trading below the breakdown level of $220 for several days, but bears have not managed to capitalize on their advantage.
Related Posts
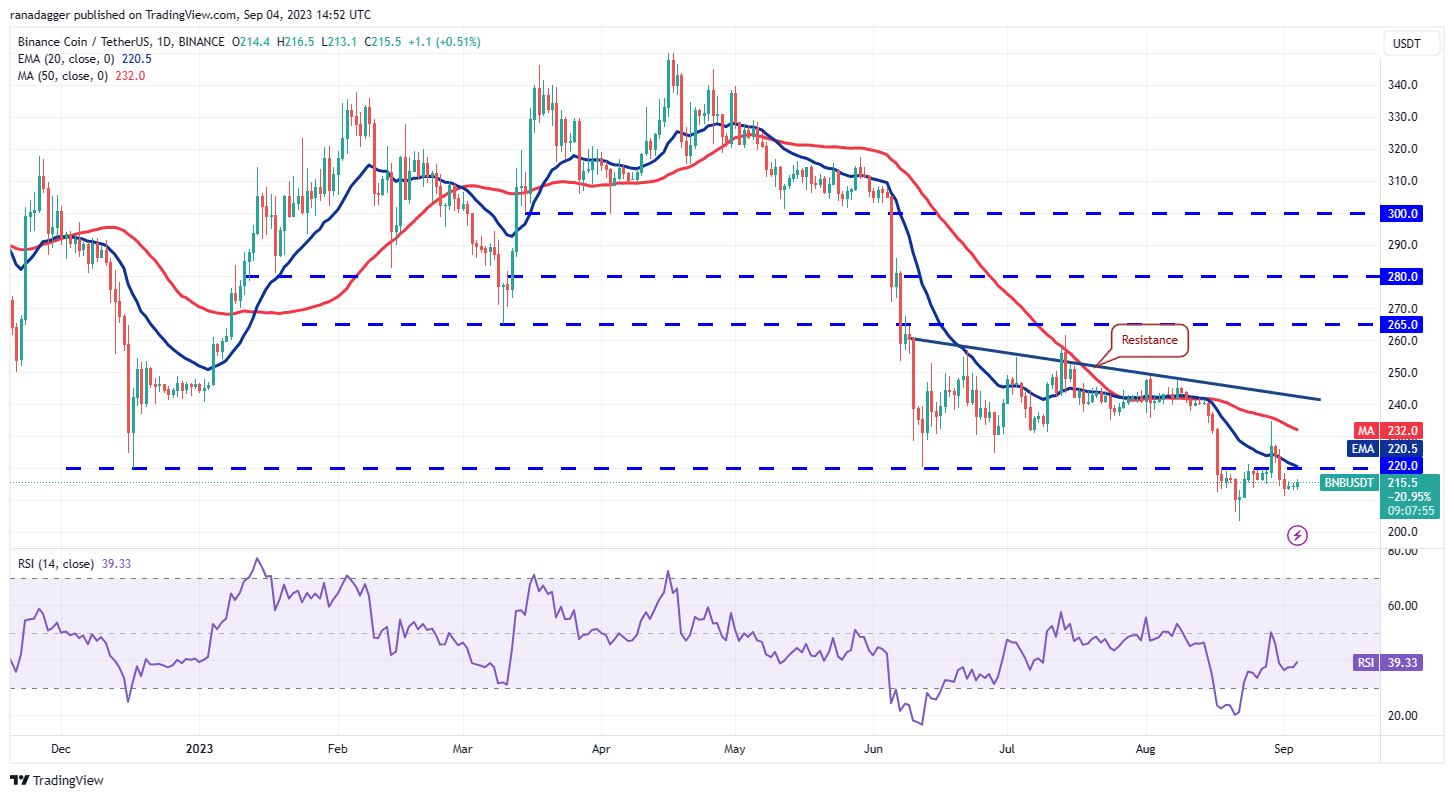 BNB/USDT daily chart. Source: TradingView
The inability to push the price below the psychological level of $200 could encourage bulls to initiate a recovery. The first resistance on the upside is at $220, followed by the resistance line. Buyers will need to drive the price above the resistance line to signal that the downtrend may be concluding.
Conversely, if the price declines and breaks below $200, it would indicate the beginning of the next phase of the downtrend. The BNB/USDT pair would then risk falling to the next significant support at $183.
XRP price analysis
The bears pushed XRP (XRP) price below $0.50 on Sep. 1, but they could not maintain the lower levels, as evidenced by the long tail on that day’s candlestick.
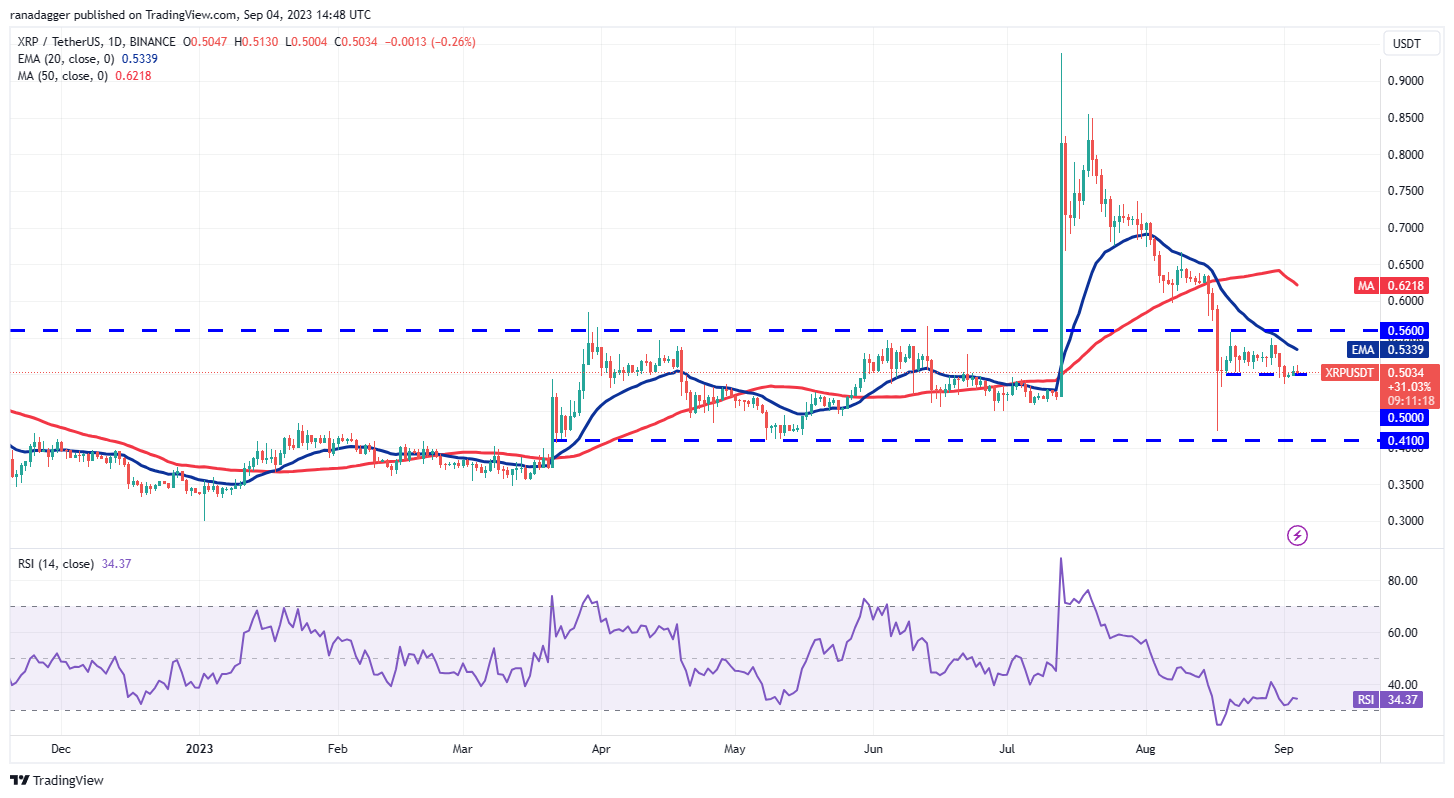 XRP/USDT daily chart. Source: TradingView
The bears have continued to apply pressure and have not allowed bulls to initiate a strong rebound from the $0.50 level. This raises the likelihood of a downward break. If that occurs, the XRP/USDT pair could fall to $0.41.
On the other hand, if the price rebounds from the current level and breaks above the 20-day EMA ($0.53), it will indicate that bulls are attempting a comeback. The pair may then rise to $0.56. Buyers will need to surpass this barrier to signal the start of a new upward movement toward $0.65.
Cardano price analysis
Cardano (ADA) has been consolidating between $0.24 and $0.28 for several days, reflecting indecision between bulls and bears.
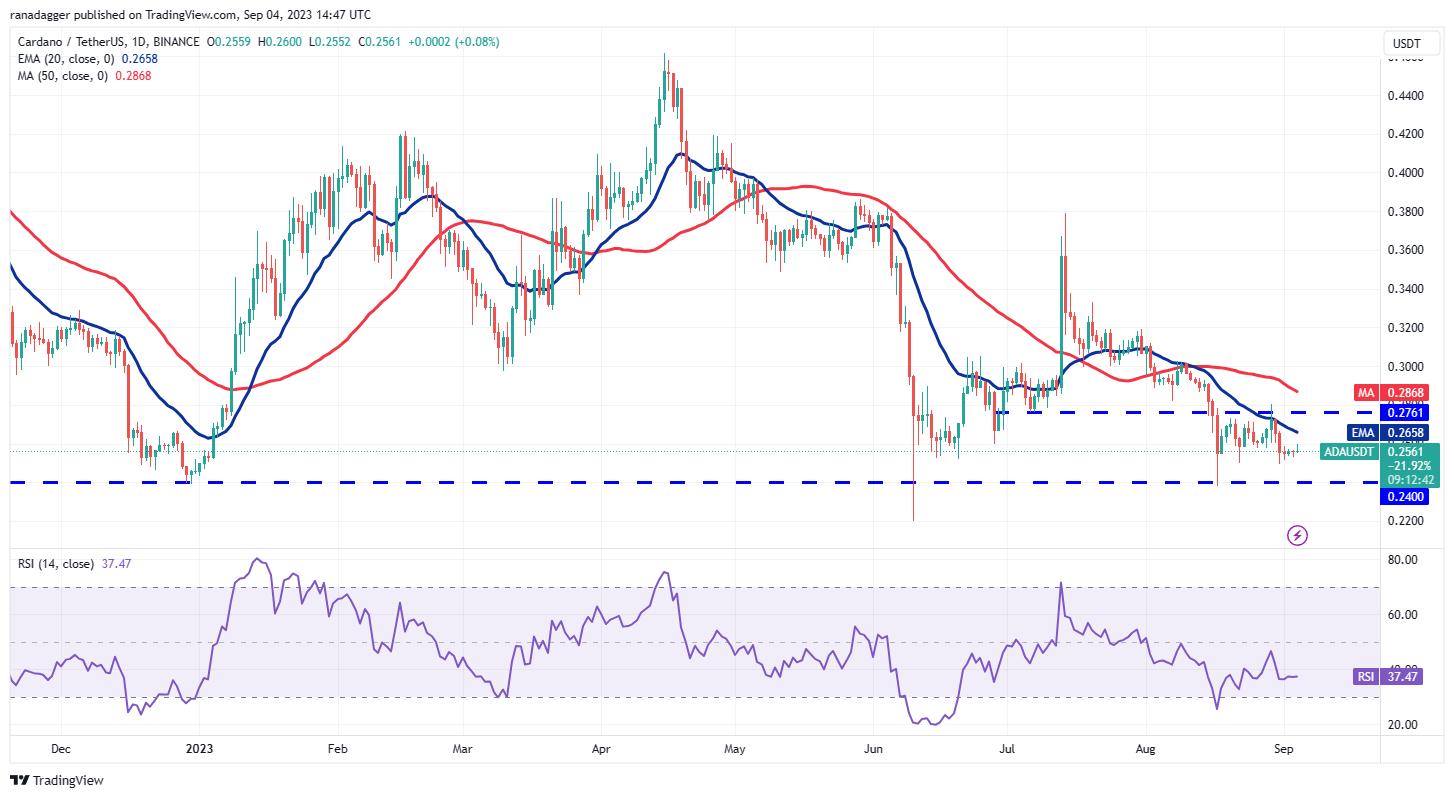 ADA/USDT daily chart. Source: TradingView
The declining 20-day EMA ($0.26) and the RSI below 38 indicate a slight edge for the bears. If the price declines from the 20-day EMA, the likelihood of a drop to $0.24 increases. A break below this level may initiate the next phase of the downtrend to $0.22 and subsequently to $0.20.
Conversely, if bulls manage to push the price above the 20-day EMA, the ADA/USDT pair could test the resistance at the 50-day SMA ($0.28). If this level is surpassed, the pair is likely to rise to $0.32.
Related: Bitcoin ETF applications: Who is filing and when the SEC may decide
Dogecoin price analysis
Buyers attempted to drive Dogecoin (DOGE) above the 20-day EMA ($0.07) on Sep. 2, but the bears maintained their position.
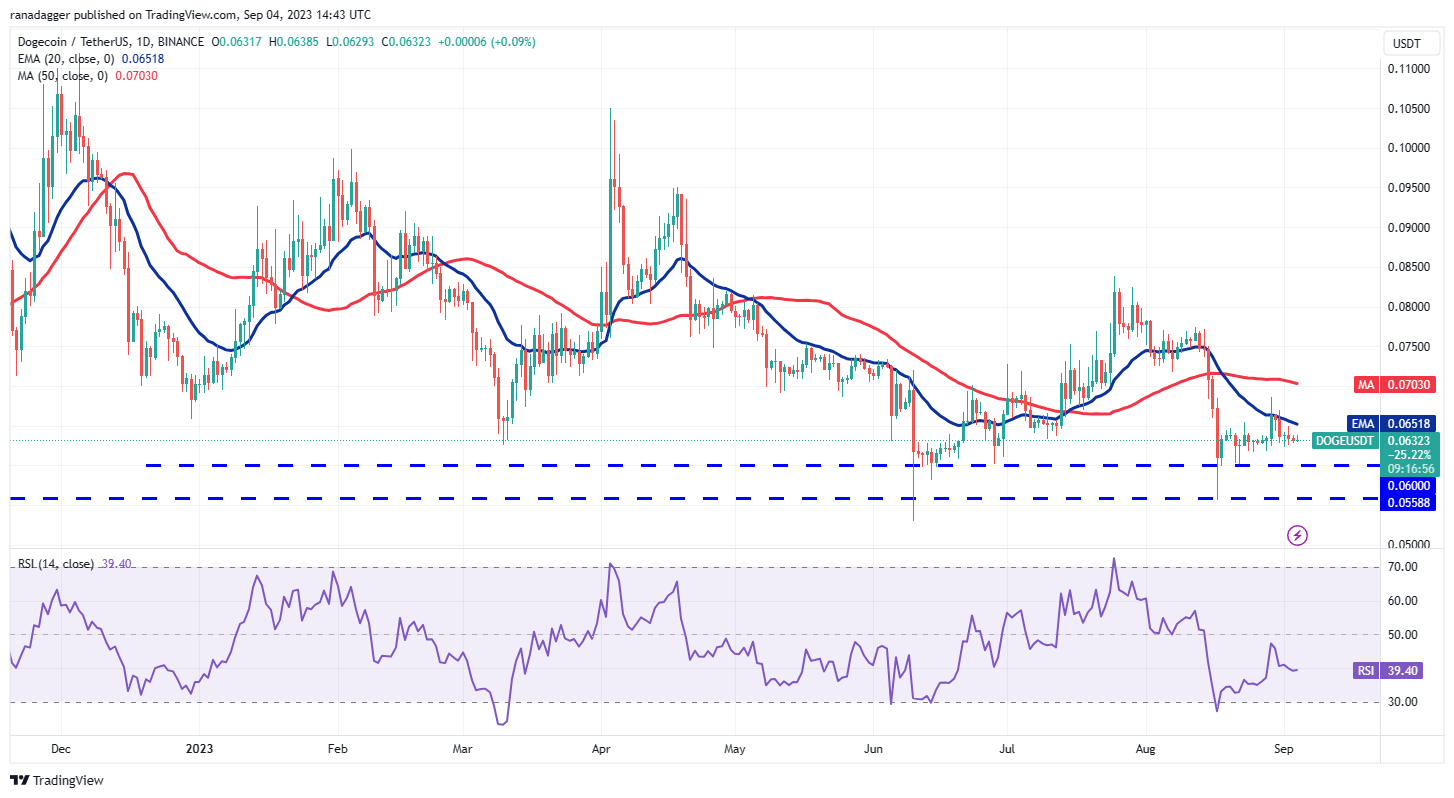 DOGE/USDT daily chart. Source: TradingView
This keeps the DOGE/USDT pair trapped between the 20-day EMA and the significant support at $0.06. The declining 20-day EMA and the RSI in the negative zone suggest an advantage for sellers. If the price breaks below $0.06, selling pressure could intensify, and the pair may drop to the next support at $0.055.
If bulls wish to avert a decline, they must swiftly push the price above the 20-day EMA. If successful, the pair could rise to the 50-day SMA ($0.07) and subsequently surge to $0.08.
Solana price analysis
Solana (SOL) is currently undergoing a significant corrective phase. Buyers are attempting to initiate a relief rally, but it is likely to encounter selling pressure at the downtrend line.
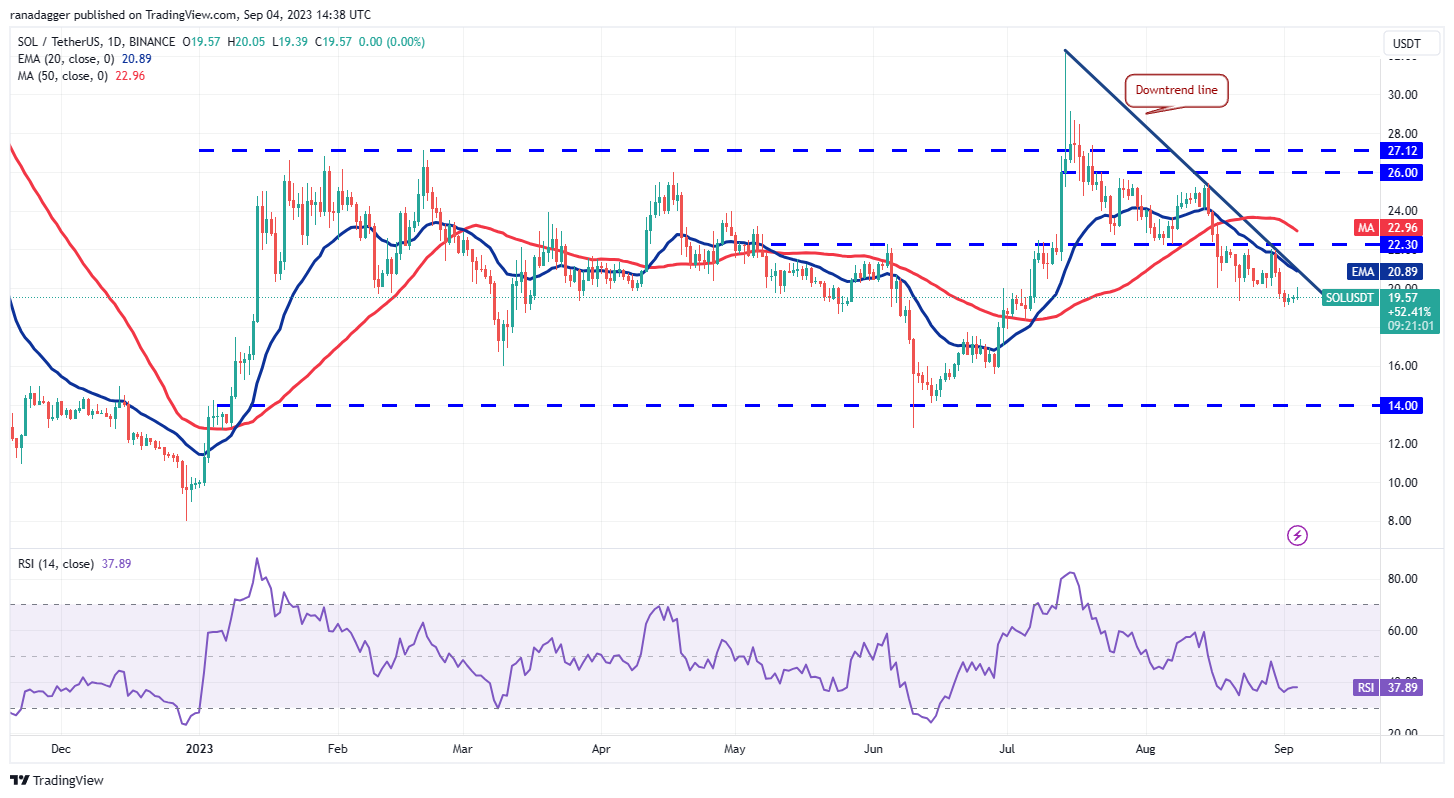 SOL/USDT daily chart. Source: TradingView
If the price sharply declines from the current level or the downtrend line, it will indicate that sentiment remains negative and traders are selling during rallies. This could pull the price down to $18.32 and then to $16.
This negative outlook could be invalidated in the near term if bulls manage to push the price above the downtrend line. The SOL/USDT pair could then attempt a rally to $22.30, where bears are likely to mount a strong defense.
Toncoin price analysis
Toncoin’s (TON) rally has stalled near the overhead resistance at $2.07, but a minor positive is that bulls have not surrendered much ground to the bears. This indicates that bulls are maintaining their positions.
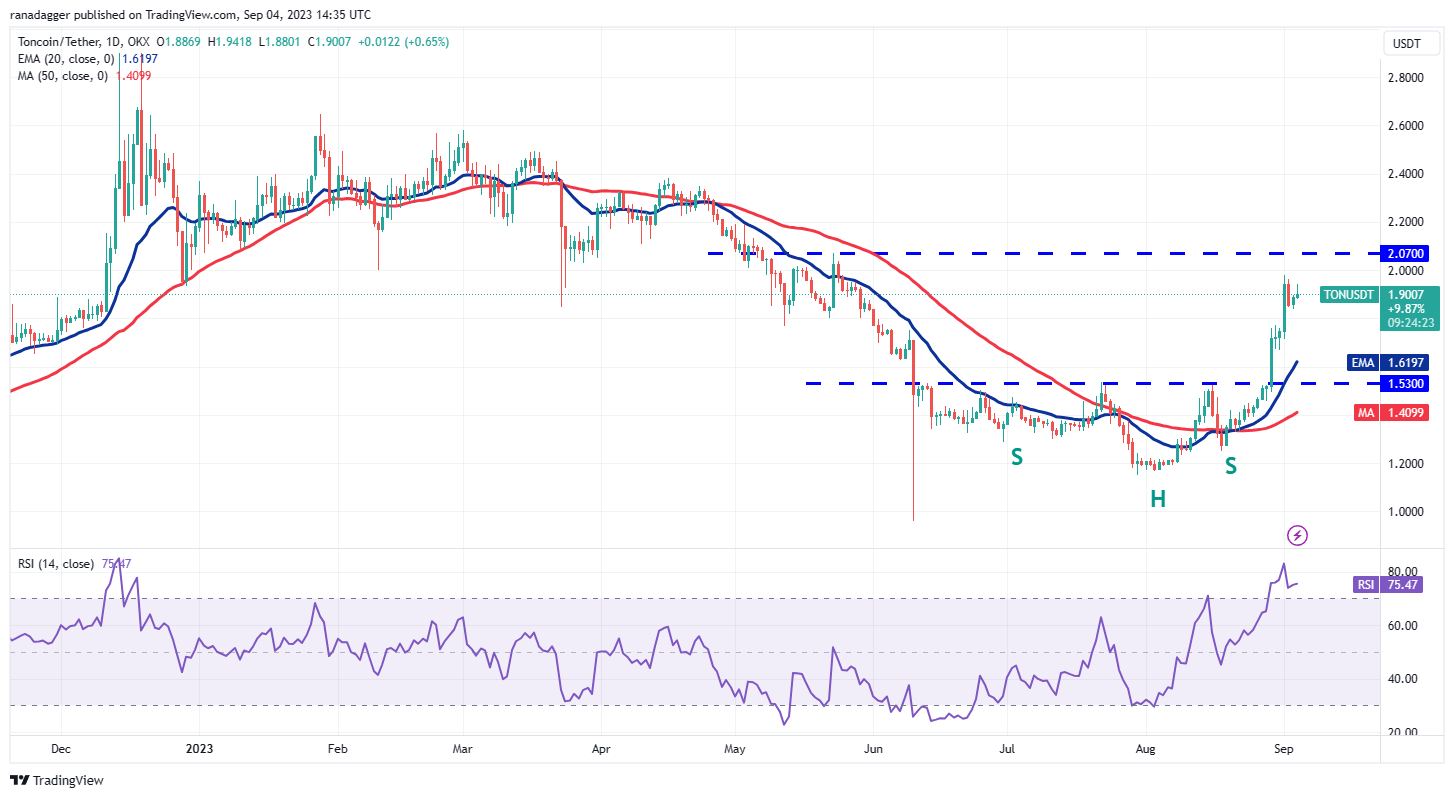 TON/USDT daily chart. Source: TradingView
The overbought conditions on the RSI suggest a potential correction or consolidation in the near future. The key support to monitor on the downside is the 20-day EMA ($1.61), as a break below it could pull the price down to $1.53 and eventually to the 50-day SMA ($1.40).
On the upside, bulls will need to overcome the obstacle at $2.07. If they succeed, the TON/USDT pair could signal the resumption of the uptrend. The pair may then attempt a rally to the $2.40-2.60 overhead zone.
This article does not contain investment advice or recommendations. Every investment and trading move involves risk, and readers should conduct their own research when making a decision.