Disclaimer: Information found on CryptoreNews is those of writers quoted. It does not represent the opinions of CryptoreNews on whether to sell, buy or hold any investments. You are advised to conduct your own research before making any investment decisions. Use provided information at your own risk.
CryptoreNews covers fintech, blockchain and Bitcoin bringing you the latest crypto news and analyses on the future of money.
The inability of bears to push Bitcoin’s (BTC) price below the $25,000 support level sparked buying activity last week. The positive trend gained further traction at the beginning of the new week, with buyers attempting to maintain Bitcoin’s price above $27,000.
Market participants appear optimistic, anticipating that the Federal Reserve will refrain from increasing interest rates this year. The CME FedWatch Tool indicates a 58% likelihood that rates will stay at their current levels even during the December meeting.
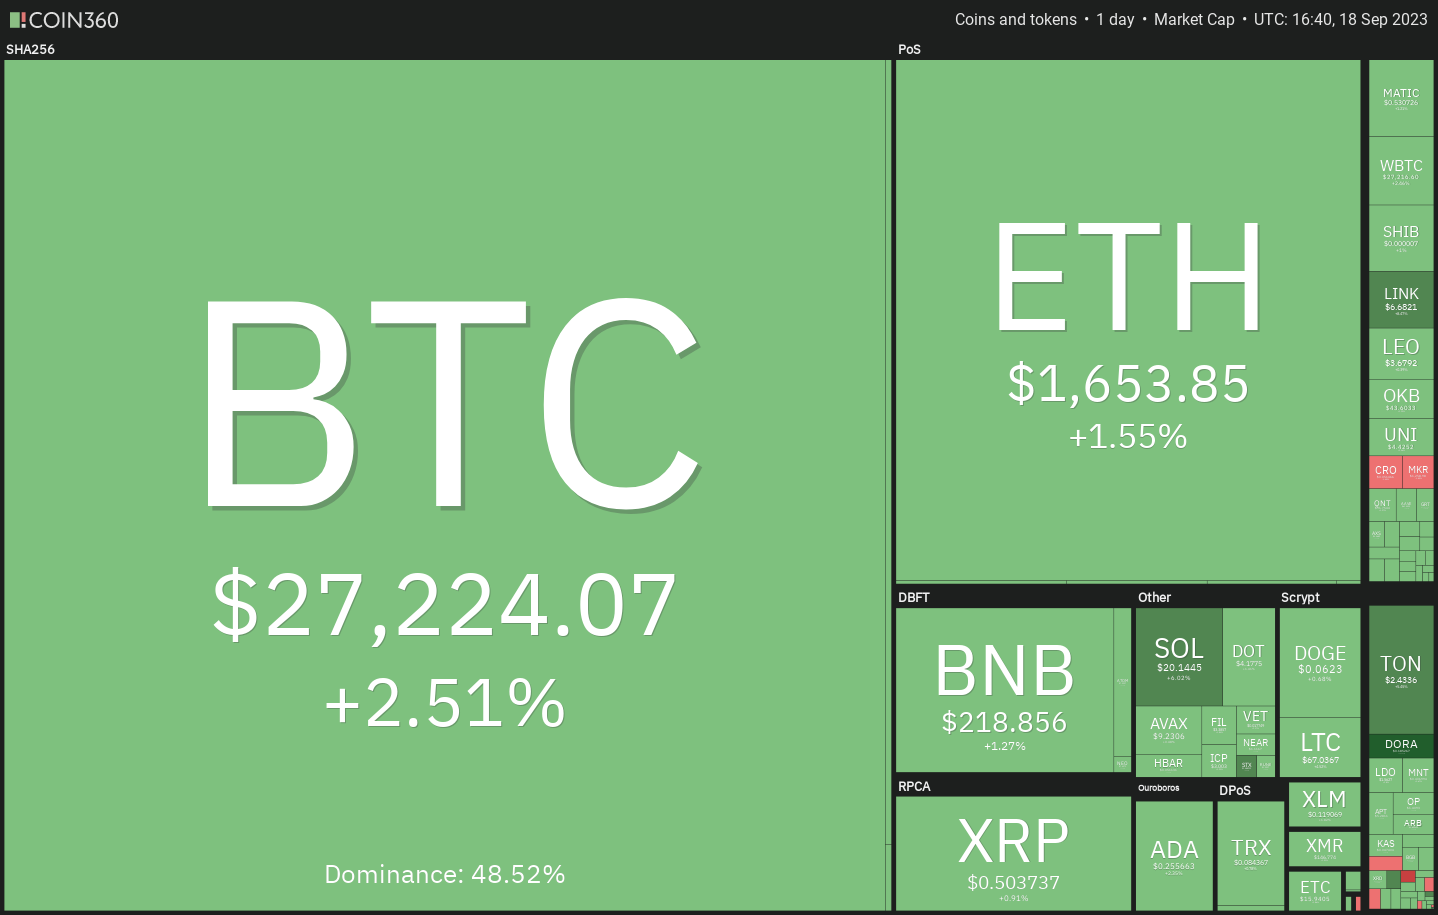 Daily cryptocurrency market performance. Source: Coin360
This could explain why the strength of the United States dollar index (DXY) has not negatively affected Bitcoin’s price. However, traders should exercise caution, as the final ten days of September are historically favorable for bears. According to the Carson Group, the S&P 500 Index (SPX) has averaged positive performance for only two days between September 20 and 30 since 1950.
Will Bitcoin and certain altcoins continue their recovery, or will bears drive the price lower? Let’s examine the charts to determine the outcome.
S&P 500 Index price analysis
The S&P 500 Index surpassed the moving averages on September 14, but the bulls were unable to maintain the momentum and overcome the resistance at the downtrend line.
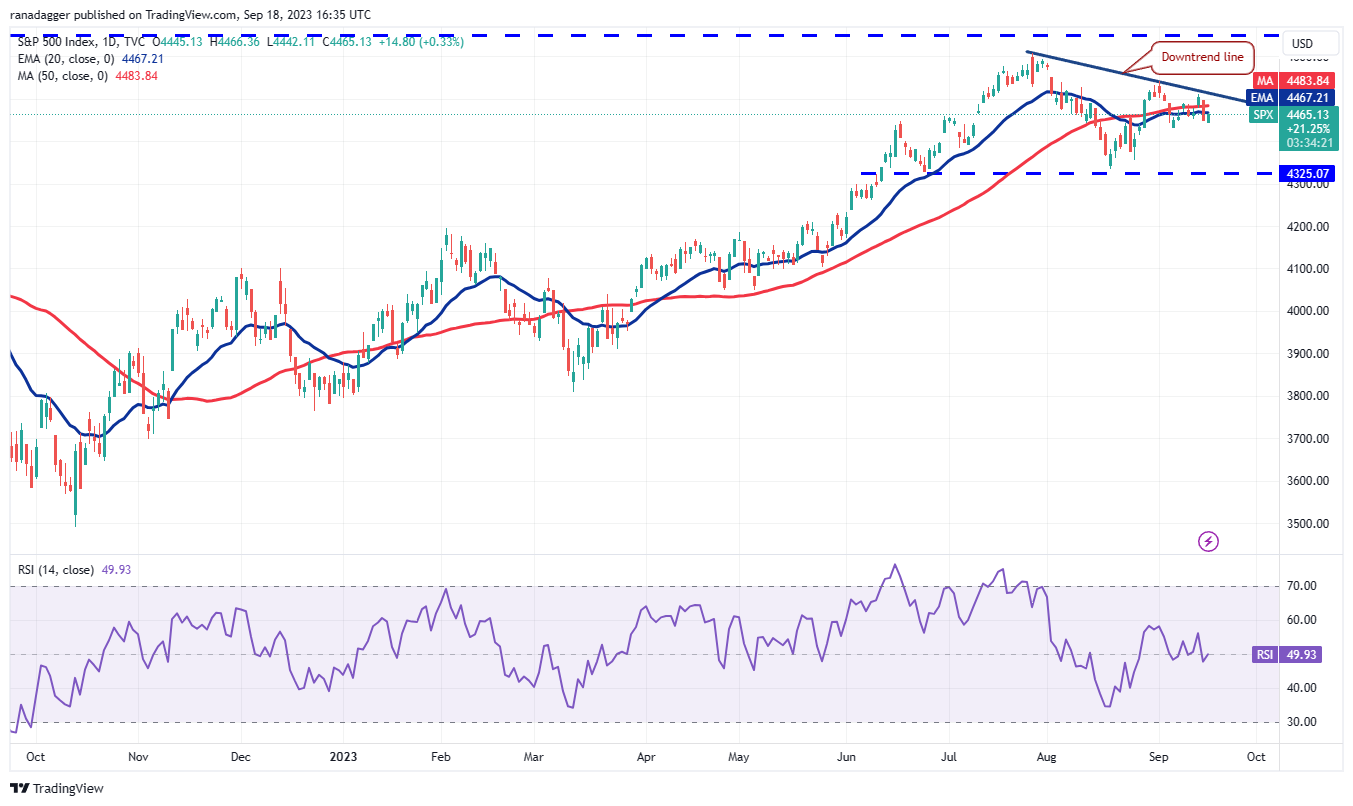 SPX daily chart. Source: TradingView
Bears aggressively sold at the downtrend line, pulling the price back below the moving averages on September 15. Sellers will aim to strengthen their position by driving the price below the next support level at 4,030. If successful, this could lead to a potential retest of the crucial support at 4,325.
For bulls to gain an advantage, they must quickly push the price above the downtrend line. There is minor resistance at 4,542, but if this level is surpassed, the index could accelerate towards 4,607.
U.S. dollar index price analysis
The U.S. dollar index has continued to rise in recent days but is likely to encounter significant resistance at 106.
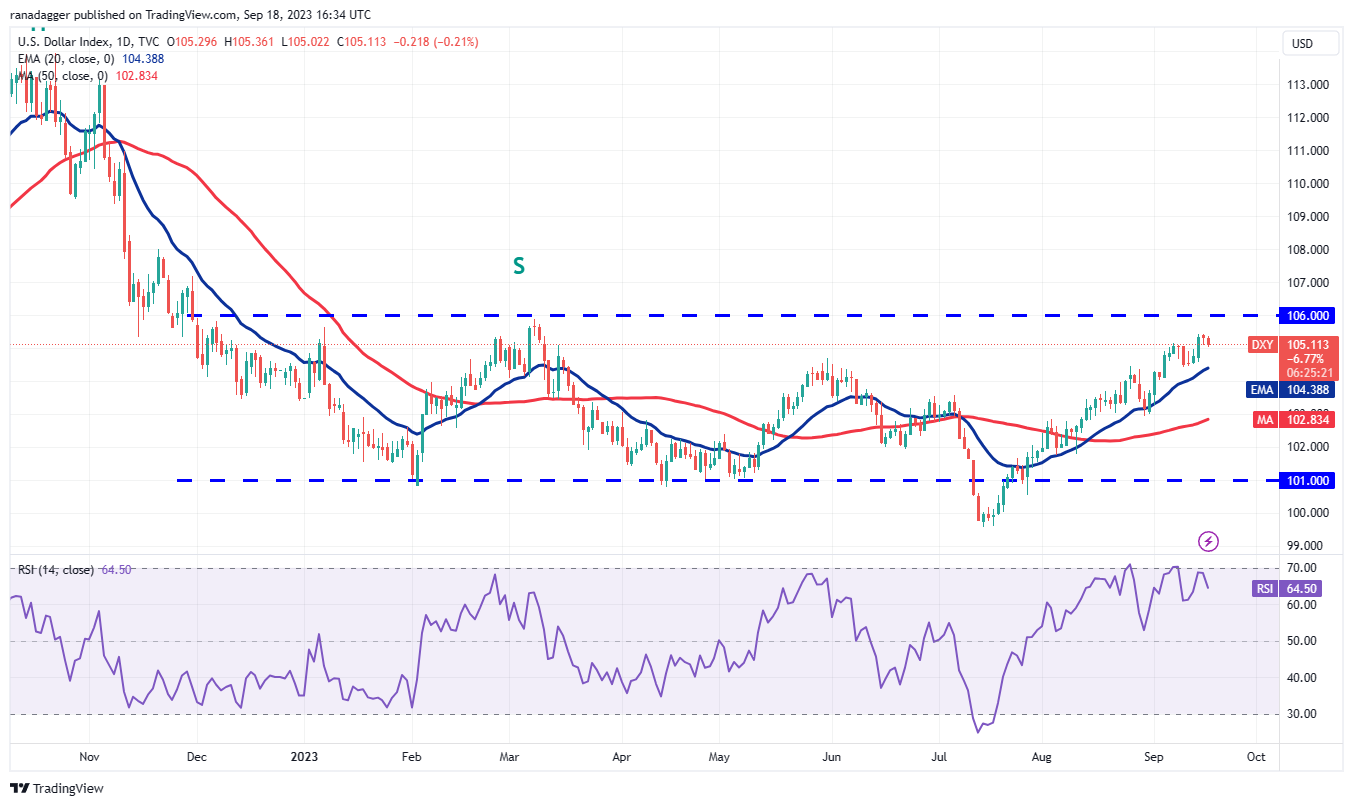 DXY daily chart. Source: TradingView
If buyers manage to prevent the price from falling below the 20-day exponential moving average (104), it will improve the chances of a rally above 106. Should this occur, the index could gain momentum and rise to 108.
Conversely, if the price sharply declines from 106, it will indicate that bears are vigorously defending this level. A drop below the 20-day EMA could push the price down to the 50-day simple moving average (102), potentially keeping the price trapped between 101 and 106 for an extended period.
Bitcoin price analysis
Bitcoin has remained above the 20-day EMA ($26,394) since September 14, suggesting that bulls have converted this level into support. Buyers are attempting to further solidify their position by pushing the price above the 50-day SMA ($27,255).
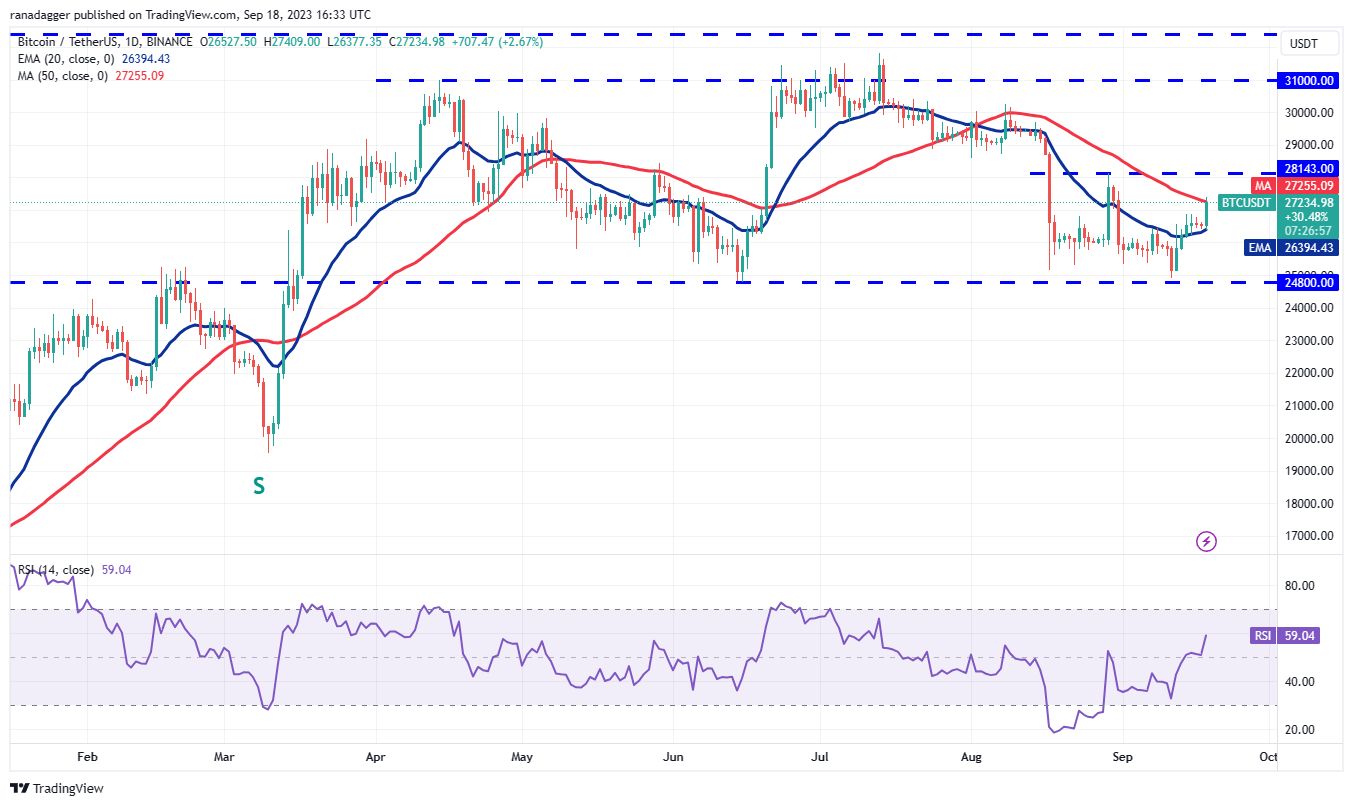 BTC/USDT daily chart. Source: TradingView
Bears are expected to present a formidable challenge in the area between the 50-day SMA and the overhead resistance at $28,143. If the price sharply declines from this zone, it will indicate that the BTC/USDT pair may remain range-bound between $24,800 and $28,143 for several days.
On the flip side, if bulls push the price above $28,143, it will clear the way for targets at $30,000 and $31,000.
Overall, time is running out for bears. If they wish to regain control, they must swiftly pull the price back below the 20-day EMA.
Ether price analysis
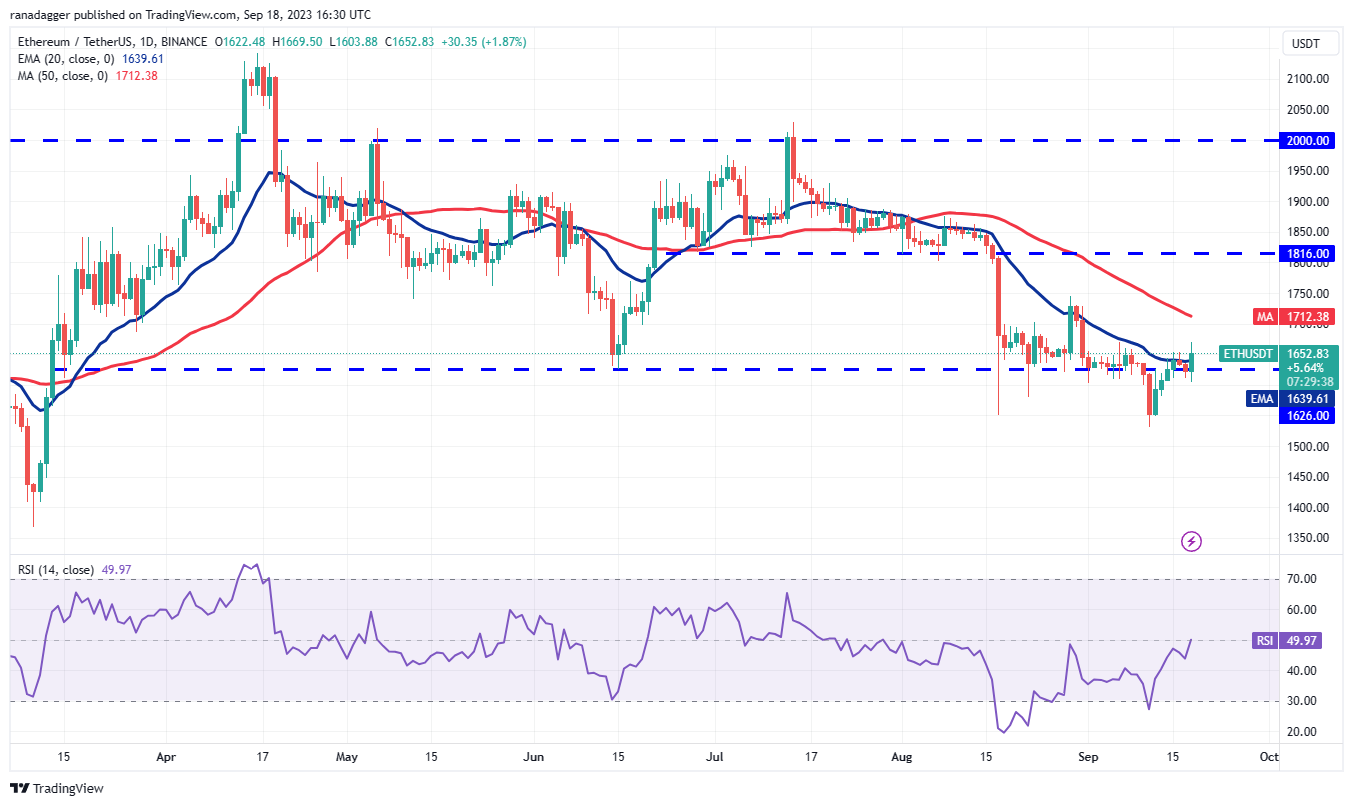
After facing challenges near the 20-day EMA ($1,639) for several days, bulls successfully pushed Ether (ETH) above the overhead resistance on September 18.
 ETH/USDT daily chart. Source: TradingView
The 20-day EMA is leveling out, and the RSI is near the midpoint, indicating that bulls are making a comeback. If buyers maintain the price above the 20-day EMA, the ETH/USDT pair could first rise to the 50-day SMA ($1,712) and then to $1,750. A breakout above this level will signal a short-term double bottom. The target for this bullish pattern is $1,959.
However, bears are likely to have other intentions. They will attempt to pull the price back below the 20-day EMA and trap aggressive bulls. A drop below $1,600 could initiate a downward move toward what is presumed to be strong support at $1,531.
BNB price analysis
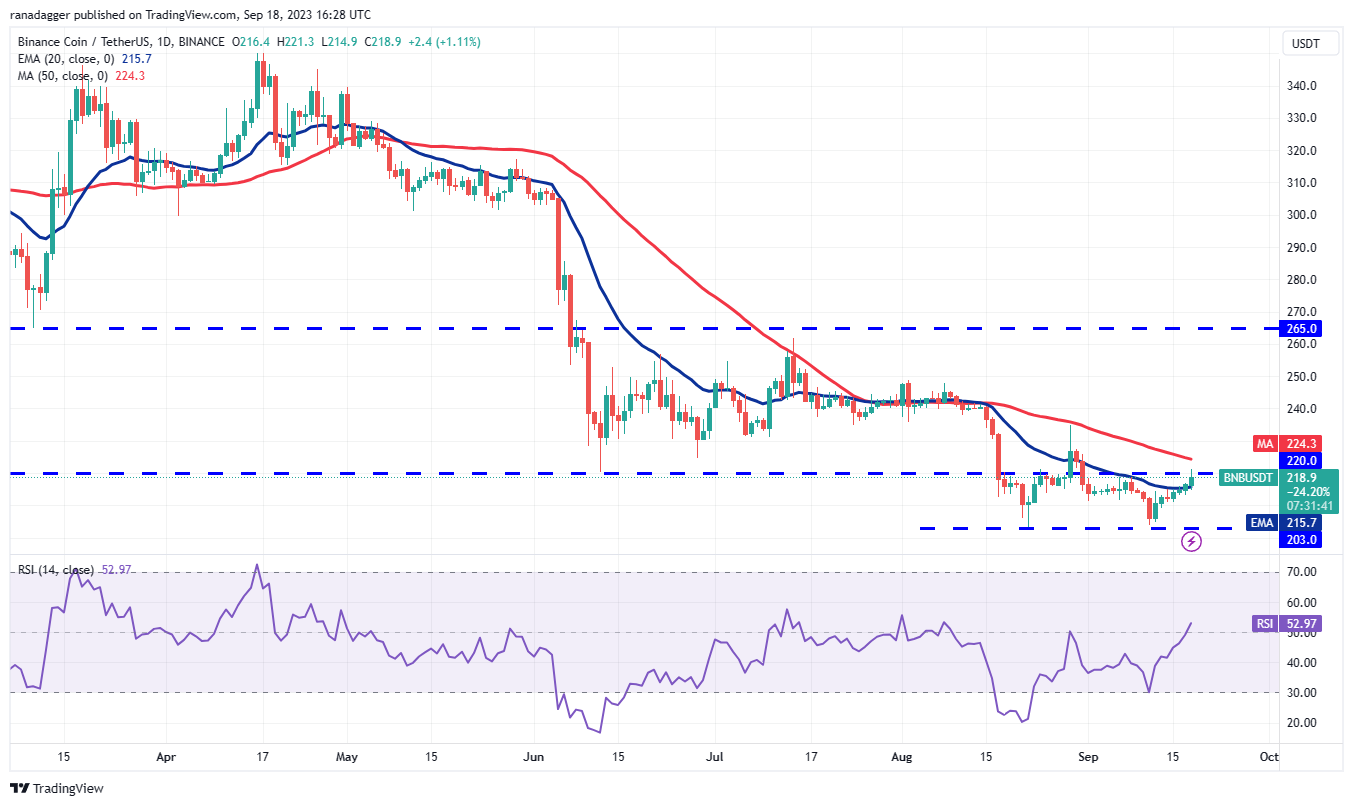
BNB (BNB) climbed above the 20-day EMA ($215) on September 17, indicating a weakening of bearish momentum. The price could next approach the 50-day SMA ($224).
 BNB/USDT daily chart. Source: TradingView
Related Posts
Bears are likely to provide strong resistance in the area between the 50-day SMA and $235. If the price declines from this zone, it will indicate that the BNB/USDT pair could remain range-bound between $200 and $235 for a period. The flat 20-day EMA and the RSI near the midpoint also suggest a potential consolidation in the near term.
If bears manage to push the price below the 20-day EMA, the pair could retest the crucial support near $200. A repeated test of a support level within a short timeframe tends to weaken it. If this level fails, the pair may drop to $183.
XRP price analysis
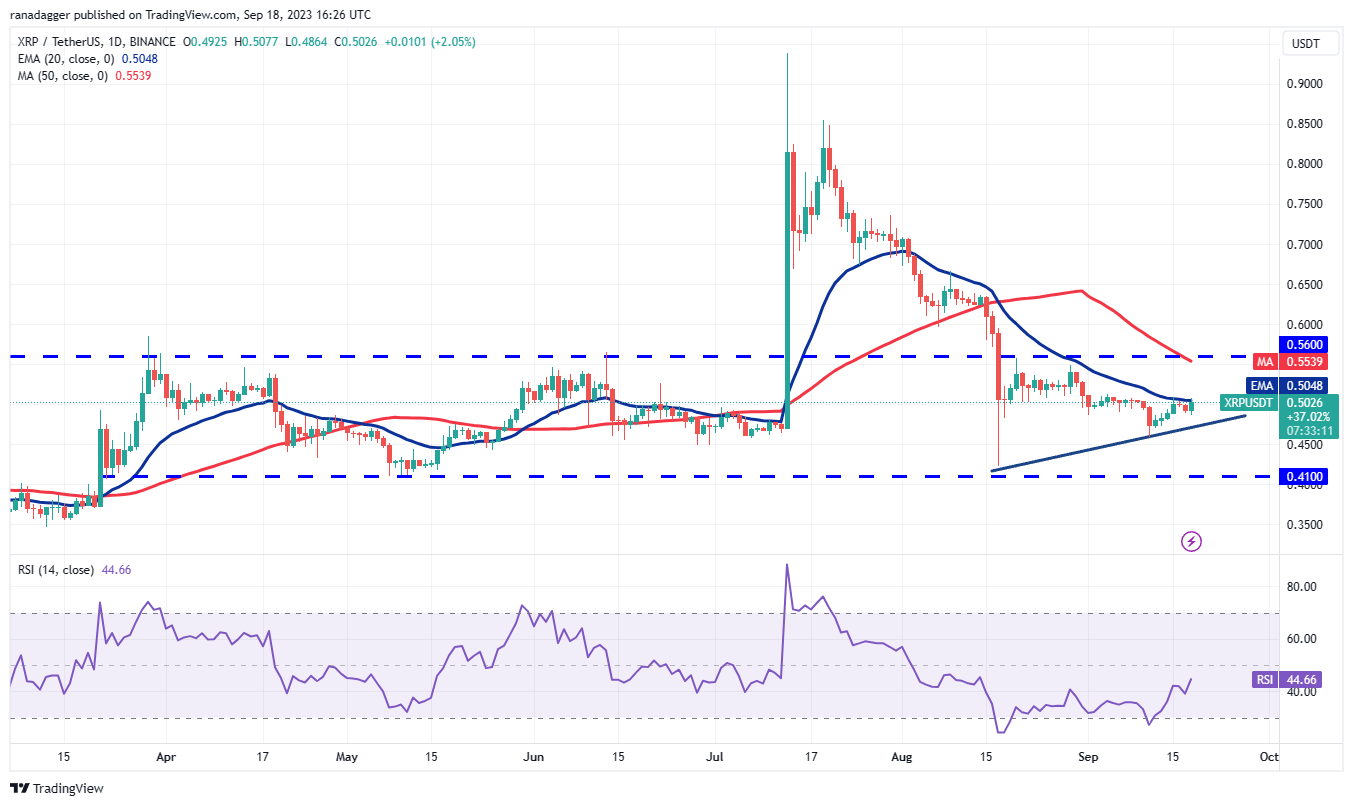
XRP’s (XRP) recovery is encountering selling pressure near the 20-day EMA ($0.50), but bulls are not backing down and are attempting to push the price above the resistance.
 XRP/USDT daily chart. Source: TradingView
If buyers manage to push the price above the 20-day EMA, the XRP/USDT pair could attempt a rally to $0.56. This level may present a significant challenge for bulls to surpass.
On the other hand, if the price declines from the current level, it will suggest that bears are fiercely defending the 20-day EMA. There is minor support at the uptrend line, but if this level fails, the pair risks dropping to $0.45 and eventually to $0.41.
Cardano price analysis
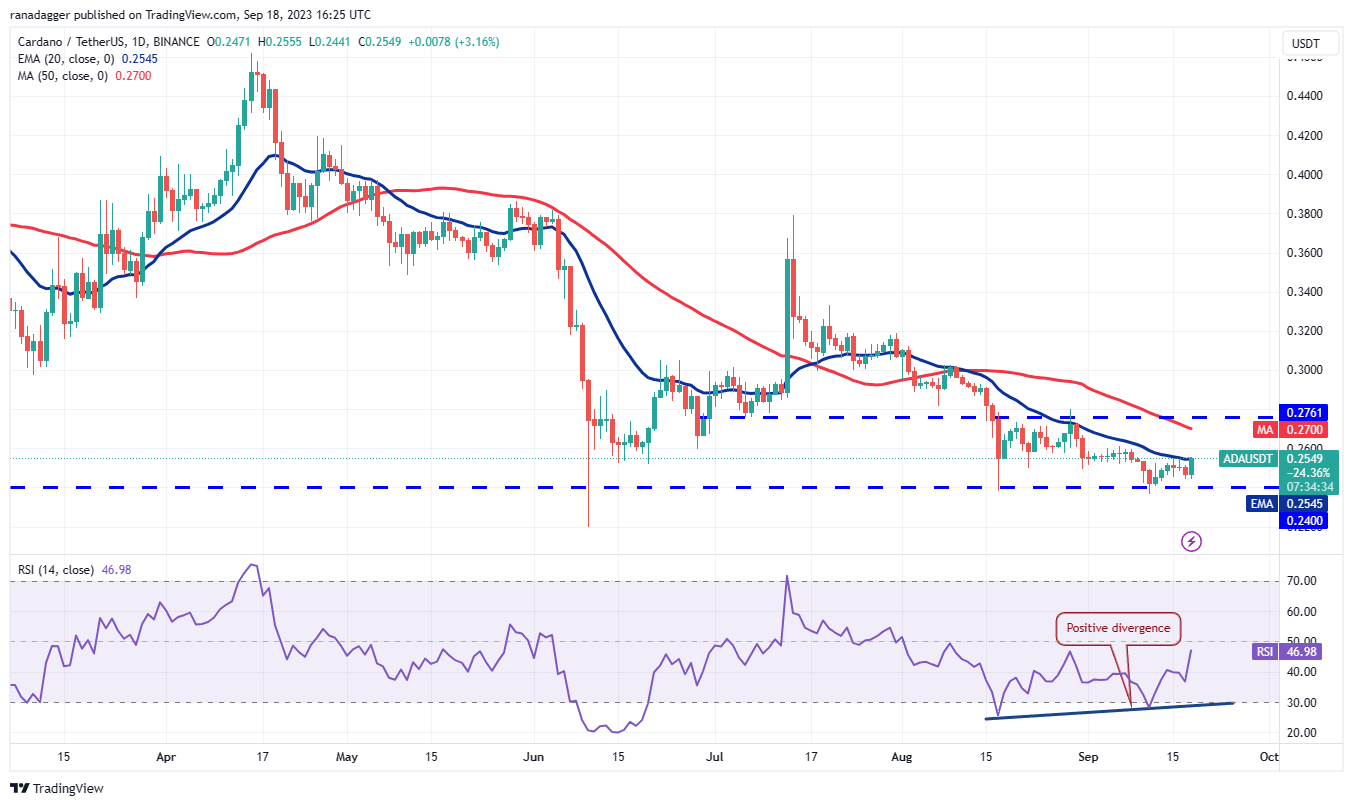
Cardano (ADA) remains trapped between the 20-day EMA ($0.25) and the critical support at $0.24. This narrow-range trading is unlikely to persist for long, and a breakout may be imminent.
 ADA/USDT daily chart. Source: TradingView
The positive divergence on the RSI indicates that selling pressure is diminishing. If the uncertainty resolves to the upside, it will create an opportunity for a potential rally to the overhead resistance at $0.28.
Conversely, if the price falls below $0.24, it will indicate that bears have taken control. This could signal the beginning of the next phase of the downtrend, with the ADA/USDT pair potentially declining to $0.22.
Related: BTC price hits $27.4K as Bitcoin open interest matches Grayscale peak
Dogecoin price analysis
Dogecoin (DOGE) has been caught between the 20-day EMA ($0.06) and the horizontal support at $0.06 for several days.
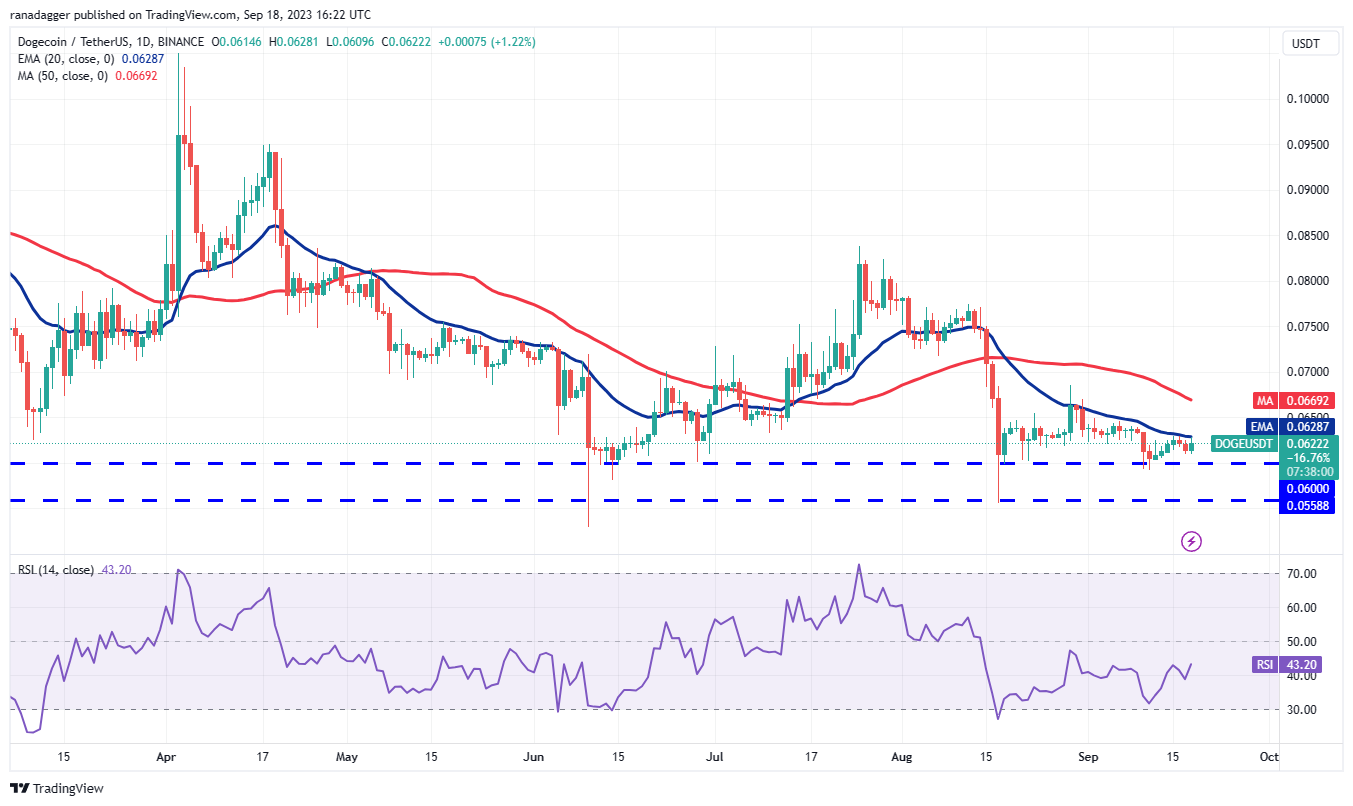 DOGE/USDT daily chart. Source: TradingView
Typically, a contraction in volatility is followed by an expansion in range. If the DOGE/USDT pair surges and closes above the 20-day EMA, it will indicate that bulls are making an effort to recover. The pair could then rise to $0.07. Buyers will need to surpass this obstacle to initiate an upward movement to $0.08.
This optimistic outlook will be negated if the price declines and falls below the $0.06 support. This could lead to a drop to the next support at $0.055, which bulls are expected to defend vigorously.
Toncoin price analysis
The long wick on Toncoin’s (TON) candlestick from September 16 and 17 indicates that traders are taking profits near the overhead resistance at $2.59.
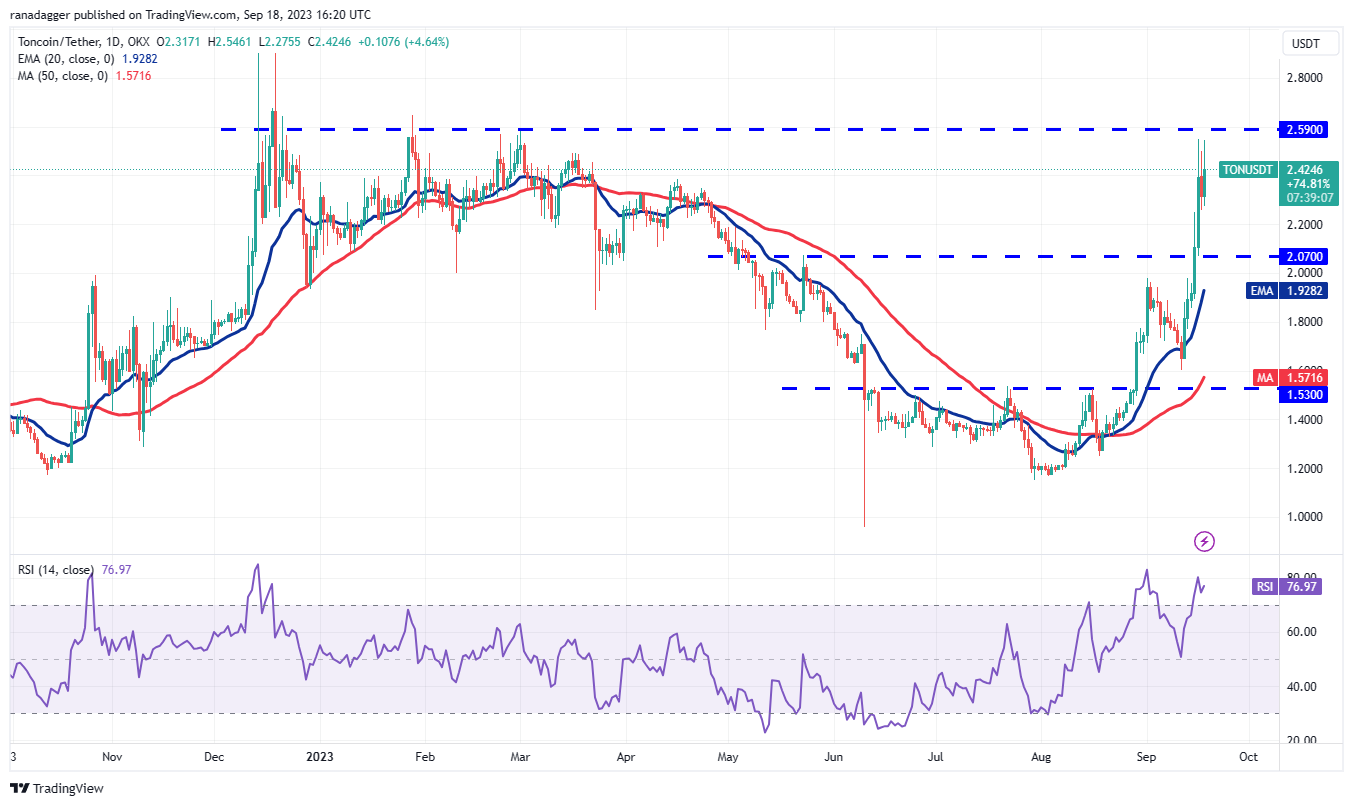 TON/USDT daily chart. Source: TradingView
The overbought condition on the RSI suggests a potential correction or range formation in the near future. However, bulls are still active and are attempting to push the TON price above $2.59. If successful, the TON/USDT pair could gain momentum and soar to $3.
The key support to monitor on the downside is $2.25. If this level is breached, the pair could begin a deeper correction toward the next support at $2.07.
Solana price analysis
After trading near the 20-day EMA ($19.47) for several days, Solana (SOL) broke above the resistance on September 18.
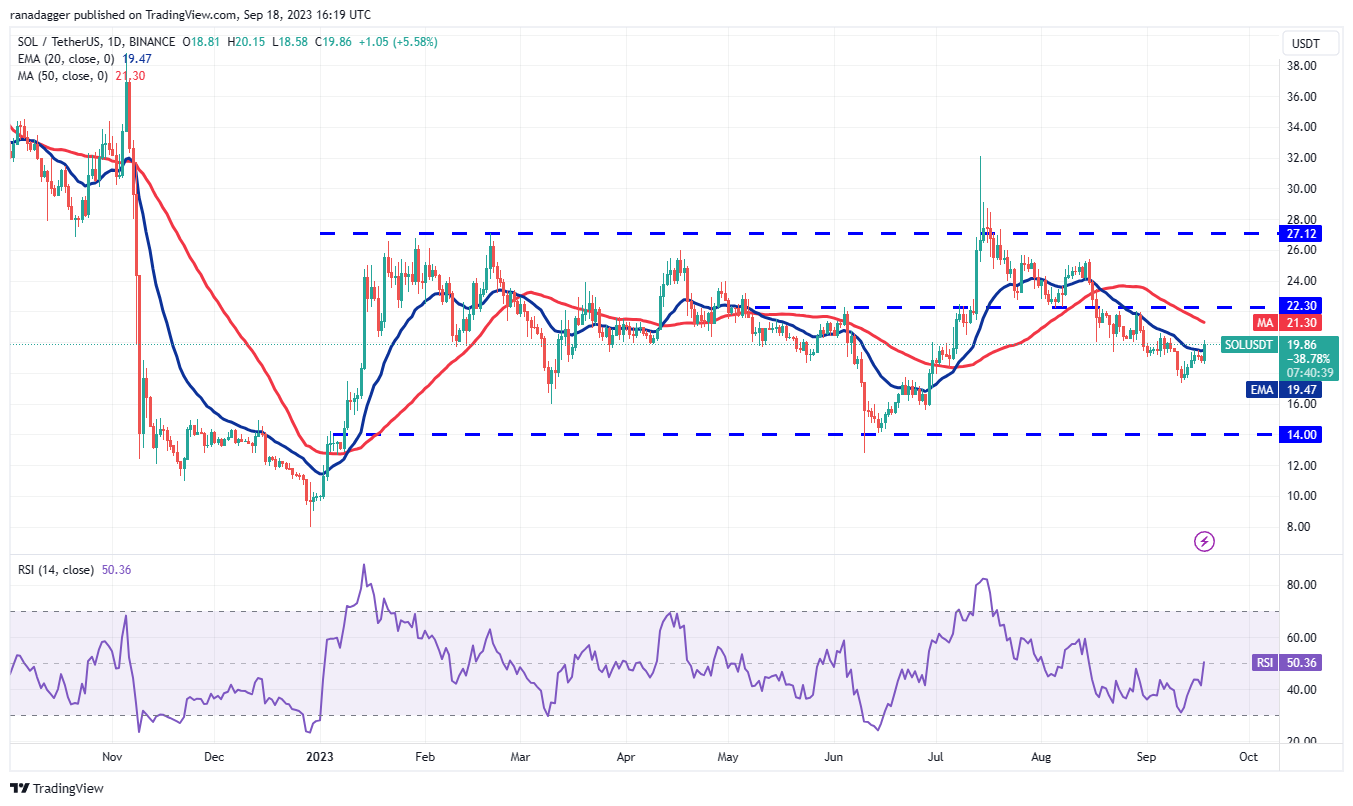 SOL/USDT daily chart. Source: TradingView
The 20-day EMA is leveling out, and the RSI is near the midpoint, suggesting that bears may be losing their grip. Buyers will aim to solidify their position further by pushing the price to the overhead resistance at $22.30, which is likely to attract sellers.
If bulls cannot maintain the price above the 20-day EMA, it will indicate that bears are selling at higher levels. The initial support on the downside is $18.50, and if this level is broken, SOL price risks falling toward the next major support at $17.33.
This article does not contain investment advice or recommendations. Every investment and trading move involves risk, and readers should conduct their own research when making a decision.