Disclaimer: Information found on CryptoreNews is those of writers quoted. It does not represent the opinions of CryptoreNews on whether to sell, buy or hold any investments. You are advised to conduct your own research before making any investment decisions. Use provided information at your own risk.
CryptoreNews covers fintech, blockchain and Bitcoin bringing you the latest crypto news and analyses on the future of money.
A narrow trading range typically culminates in a breakout, which occurred with Bitcoin on Aug. 17. Bitcoin (BTC) experienced a significant decline, leading to $1 billion in liquidations for derivatives traders, marking the largest figure since the FTX collapse in 2022.
While it is challenging to identify a definitive cause for the sell-off, analysts suggest that the uncertainty stemming from the purported write-down of SpaceX’s $373 million in Bitcoin holdings could have been a contributing factor.
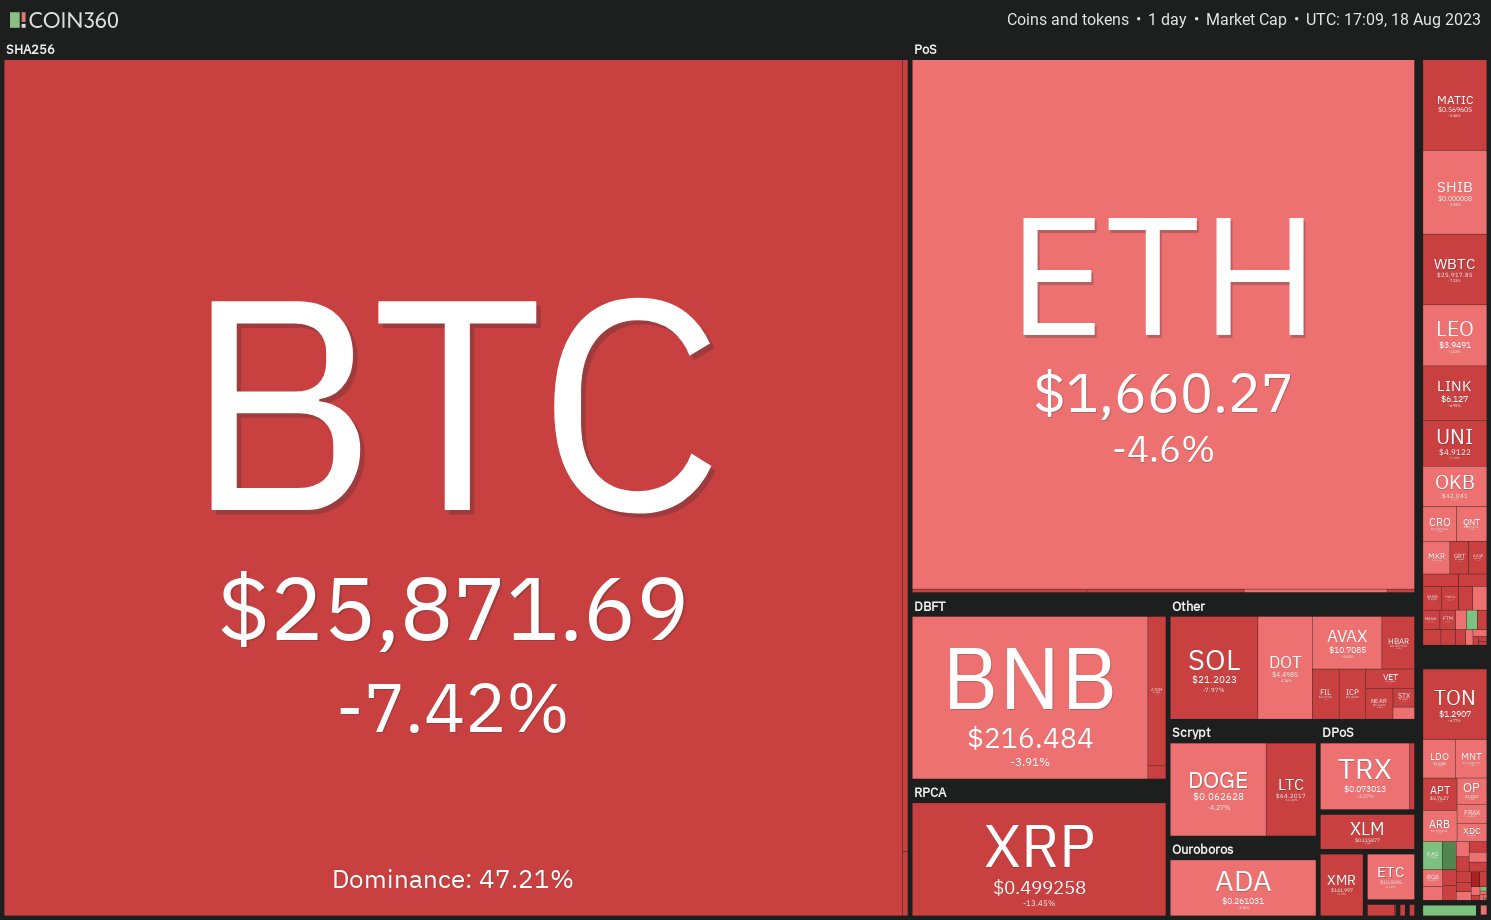 Daily cryptocurrency market performance. Source: Coin360
Regardless of the cause, the downturn has commenced. The pressing question for investors is how far Bitcoin might decline. Several analysts have adopted a bearish outlook, anticipating that Bitcoin will persist in its downward trajectory in the short term.
Will Bitcoin continue its descent, potentially dragging the broader cryptocurrency market down with it? What key support levels should be monitored? Let’s analyze the charts of the top 10 cryptocurrencies to gain insights.
Bitcoin price analysis
Bitcoin’s tight range broke to the downside on Aug. 17, prompting a long liquidation that drove the price down to $25,166.
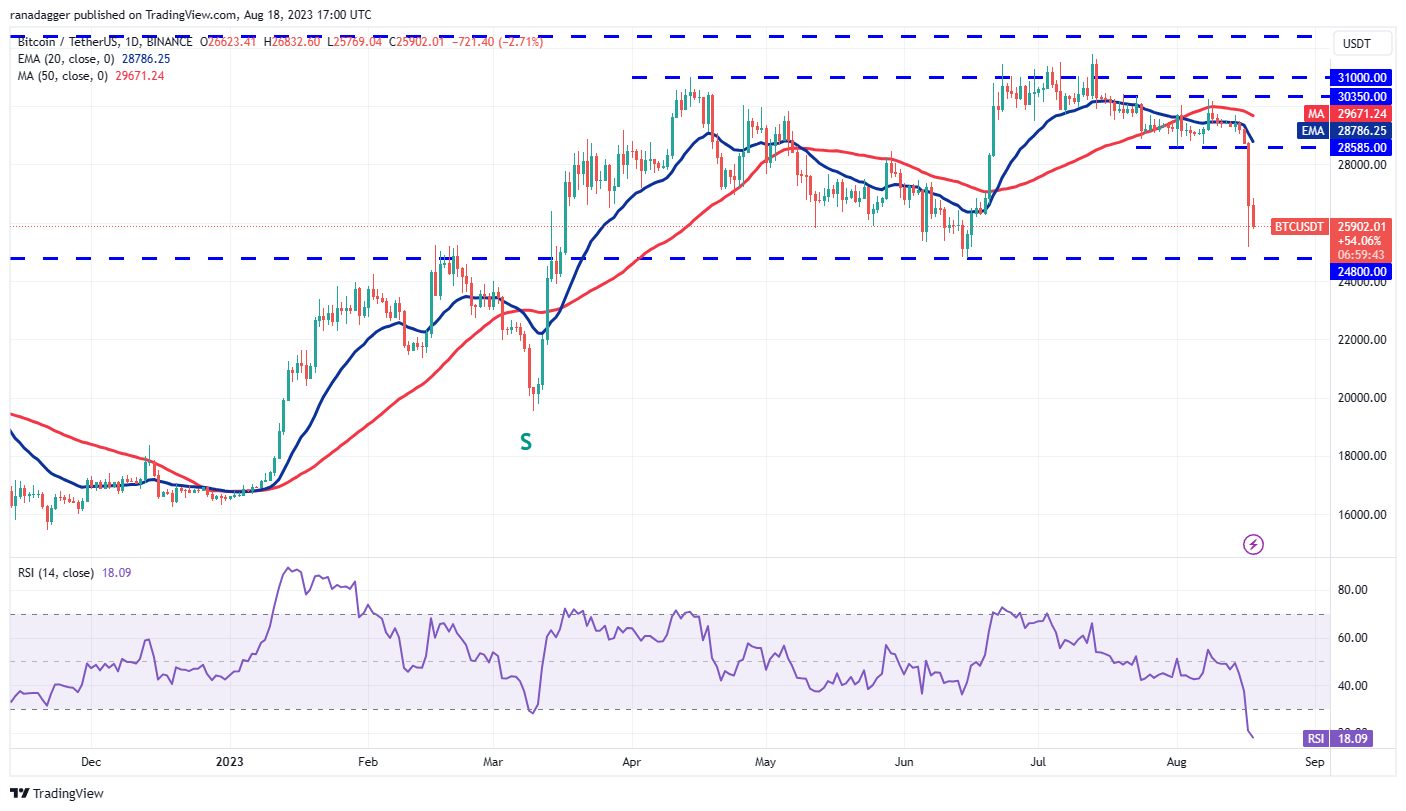 BTC/USDT daily chart. Source: TradingView
The bulls are anticipated to vigorously defend the $24,800 level. The oversold condition on the relative strength index (RSI) indicates that the BTC/USDT pair may experience a rebound or consolidation in the near future.
If the price bounces back from $24,800 with strength, it could reach the 20-day exponential moving average (EMA) of $28,786. This level is crucial to monitor. If the price declines from the 20-day EMA, it would suggest that bears are selling during rallies, increasing the chances of a drop below $24,800. Should this occur, the pair may plummet to $20,000.
The initial sign of strength will be a break and close above the 20-day EMA, indicating a potential consolidation phase in the near term.
Ether price analysis
Ether (ETH) declined and fell below the immediate support at $1,816 on Aug. 16, signaling that the bears are in control.
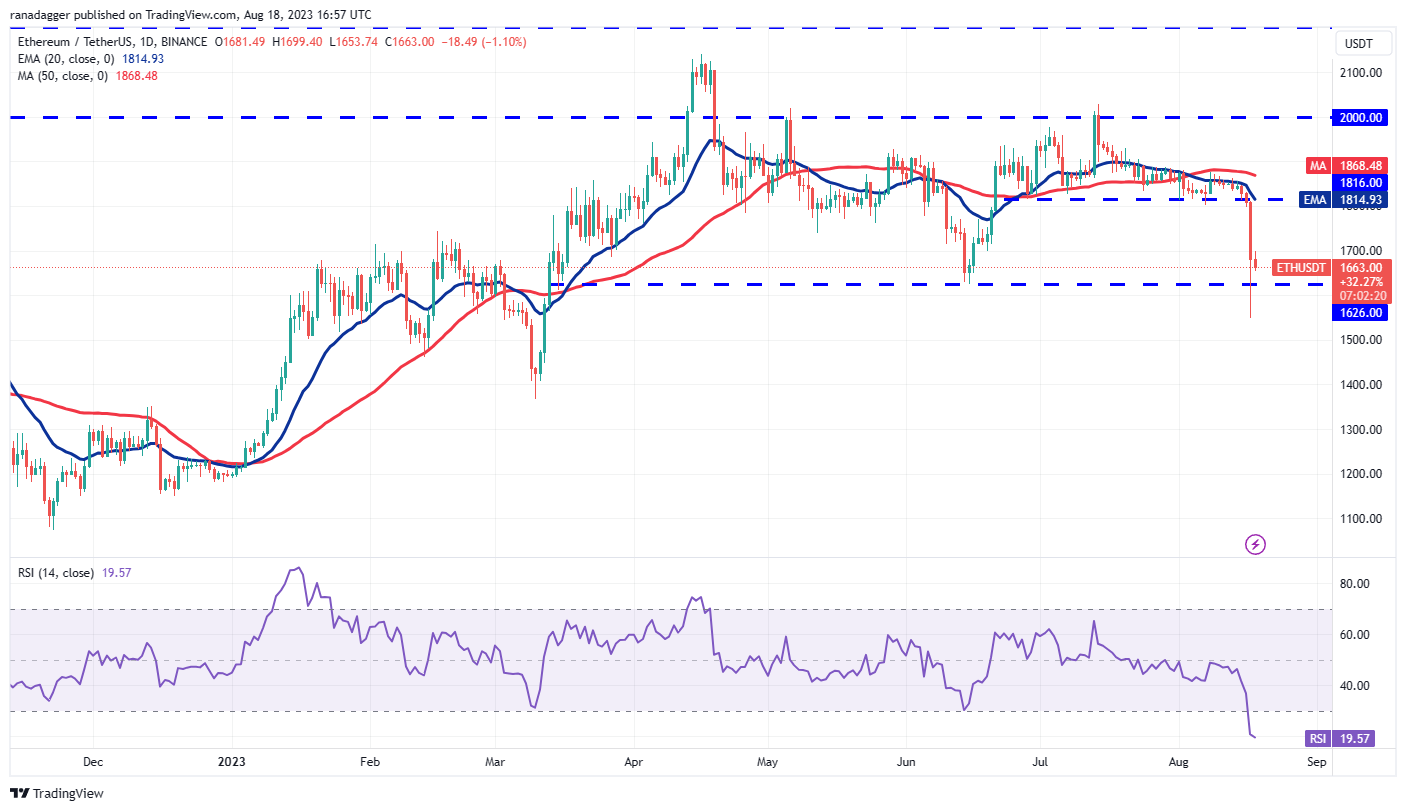 ETH/USDT daily chart. Source: TradingView
The selling pressure intensified on Aug. 17, causing the ETH/USDT pair to drop below the critical support at $1,626. Buyers attempted to capitalize on the dip but are struggling to gain traction in the rebound, indicating weak demand at higher levels.
The steep decline has pushed the RSI into oversold territory, suggesting that the selling may have been excessive in the short term. The pair may experience consolidation or a brief recovery in the coming days, potentially remaining within the broad range of $1,626 to $2,000.
This outlook will be invalidated if the price declines and falls below the support at $1,550, which could pave the way for a potential drop to $1,368.39.
BNB price analysis
BNB (BNB) broke and closed beneath the symmetrical triangle pattern on Aug. 16, indicating that the bears have gained the upper hand.
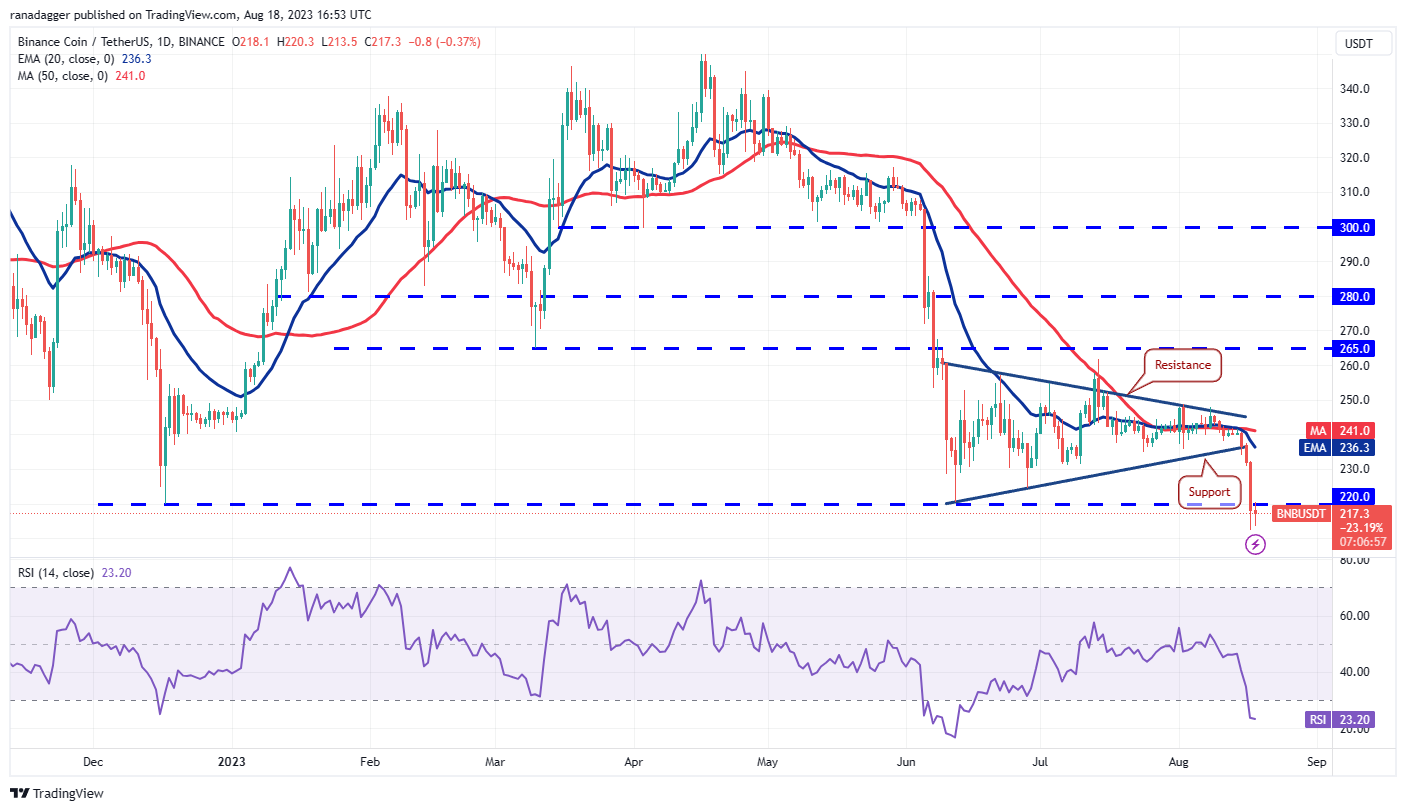 BNB/USDT daily chart. Source: TradingView
The selling intensified on Aug. 17, with the BNB/USDT pair dropping below the critical support at $220. If the bulls are unable to push the price back above $220, the bears will likely attempt to drive the pair down to the pattern target of $196 and subsequently to $183.
Conversely, if buyers manage to elevate the price above $220, a recovery to the 20-day EMA ($236) could occur. A break above this level would indicate that the breakdown below $220 may have been a bear trap, potentially keeping the pair within the $220 to $265 range for a longer period.
XRP price analysis
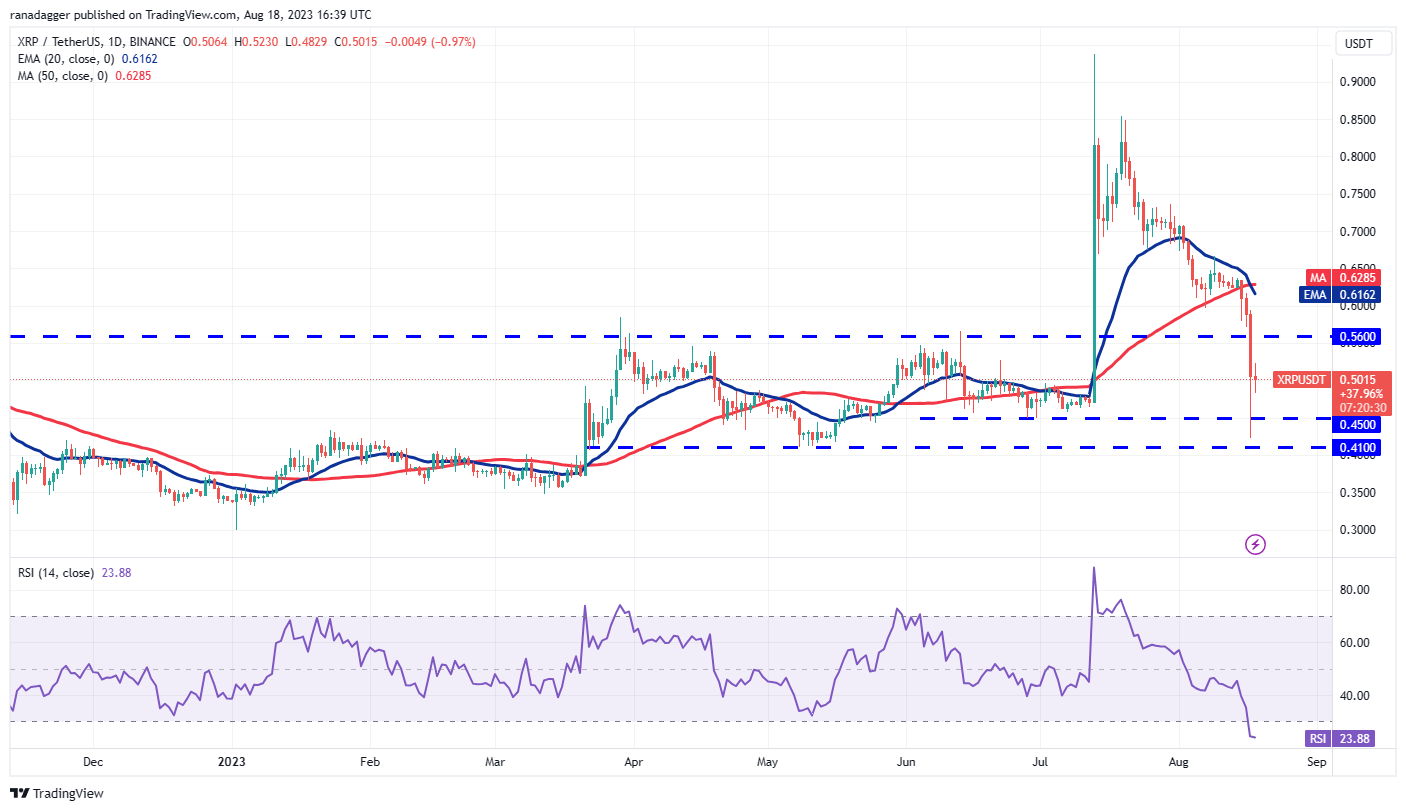
XRP (XRP) fell below the breakout level of $0.56 on Aug. 17, reflecting ongoing selling pressure from the bears.
 XRP/USDT daily chart. Source: TradingView
The decline in the XRP/USDT pair completed a full retracement of the entire rally that occurred on July 13. However, a slight positive is that the bulls bought the dip near the strong support zone of $0.45 to $0.41.
The recovery is likely to encounter resistance at $0.56 and again at the 20-day EMA ($0.61). If the price declines from this overhead zone, it will indicate that bears are selling during rallies, which may put the $0.41 support at risk of being breached.
Cardano price analysis
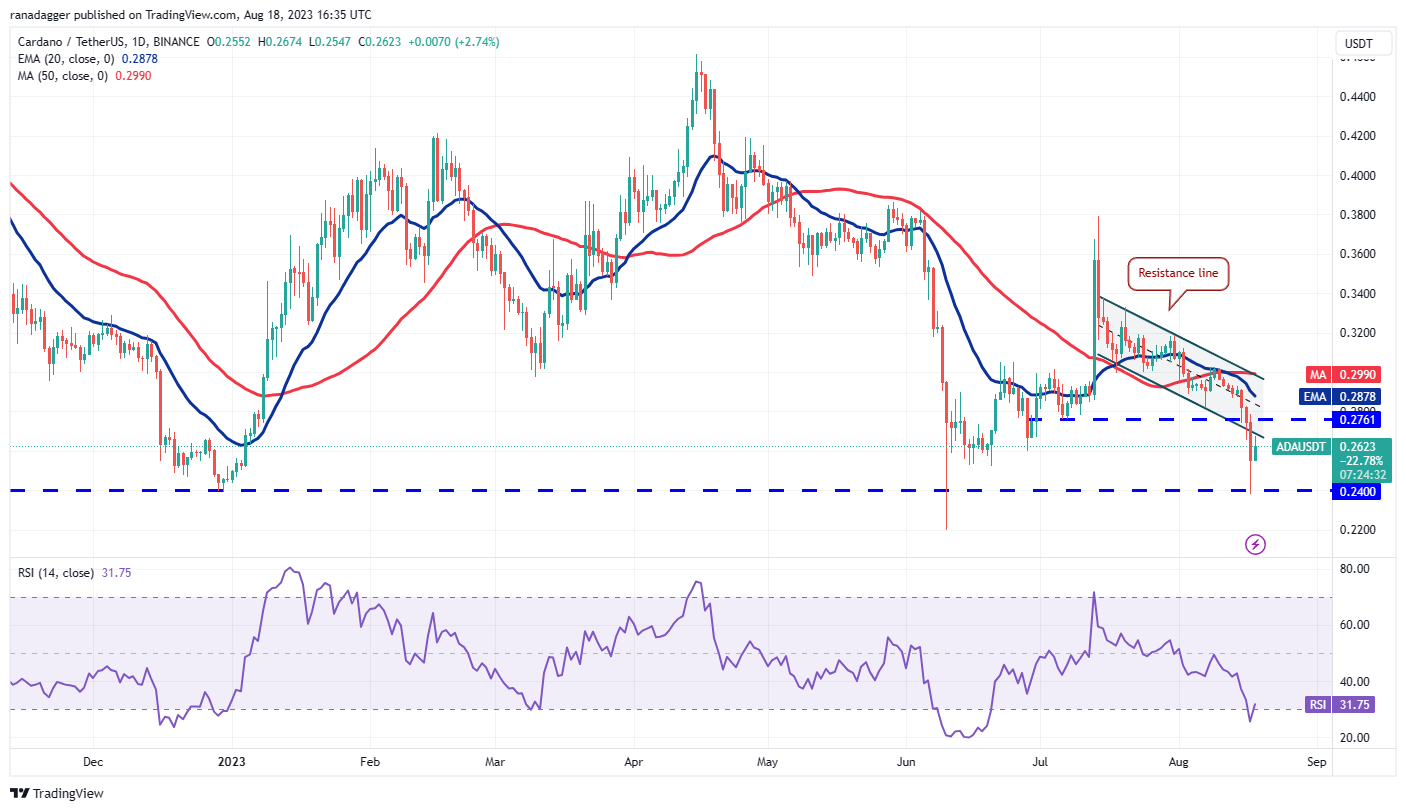
Cardano (ADA) fell below the descending channel pattern on Aug. 17, indicating that selling pressure has intensified.
 ADA/USDT daily chart. Source: TradingView
Related Posts
The bulls successfully defended the critical support at $0.24, demonstrating strong buying interest at lower levels. Buyers will attempt to push the price back into the channel. If successful, the ADA/USDT pair will aim to rally to the resistance line of the channel.
The ascent may not be straightforward, as the bulls are likely to encounter selling pressure at the 20-day EMA ($0.28). If the price declines from this level, the pair may retest the strong support at $0.24. A break below this level would indicate a resumption of the downtrend.
Solana price analysis
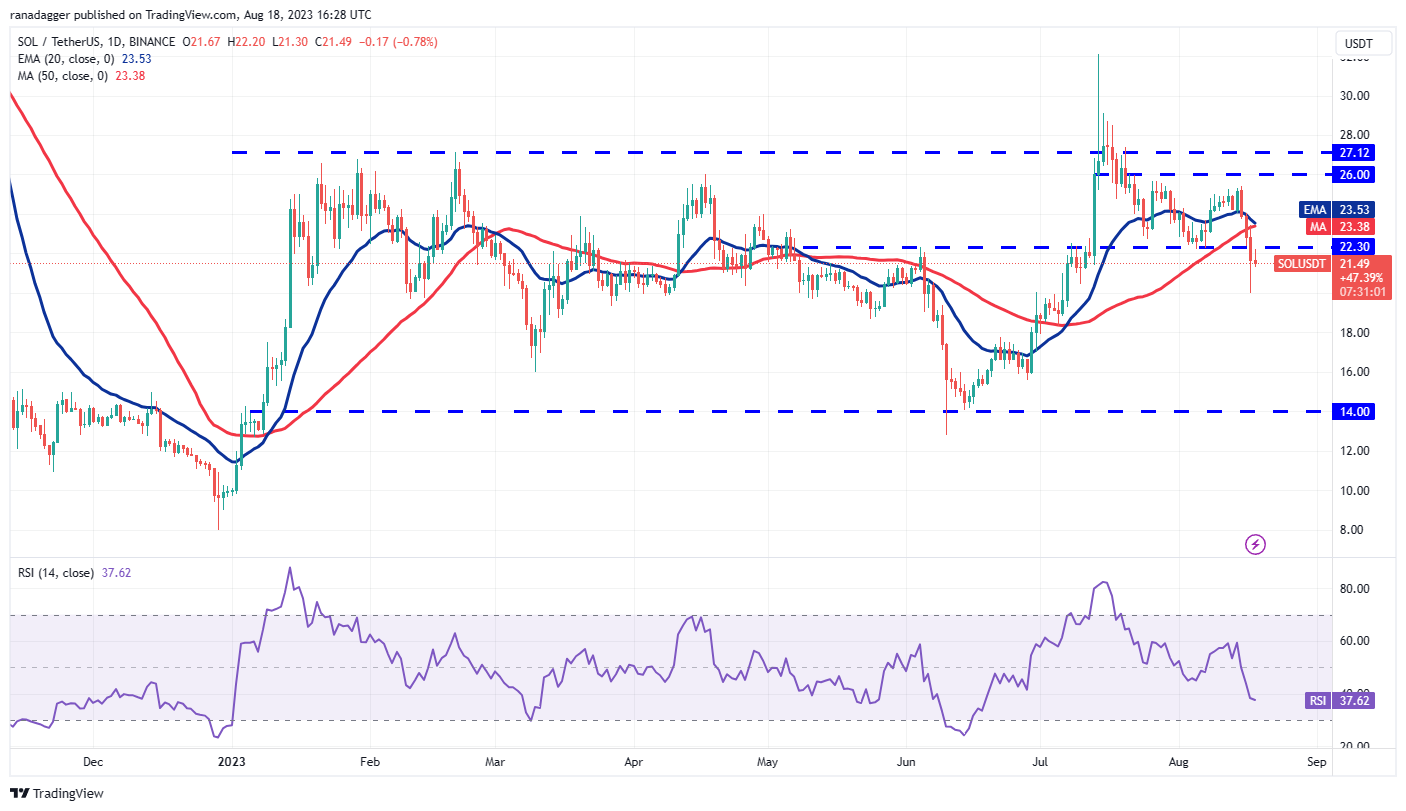
Solana (SOL) fell below the moving averages on Aug. 16 and the horizontal support at $22.30 on Aug. 17. This suggests that the price may fluctuate within the broad range of $14 to $27.12 for some time.
 SOL/USDT daily chart. Source: TradingView
The bulls are attempting to initiate a recovery, which is likely to face resistance at the moving averages. If the price declines from the 20-day EMA ($23.53), the likelihood of a drop to $18 and eventually to $14 increases.
Conversely, if buyers push the price above the moving averages, it would suggest that the break below $22.30 may have been a bear trap, potentially driving the SOL/USDT pair toward the $26 to $27.12 overhead zone.
Dogecoin price analysis
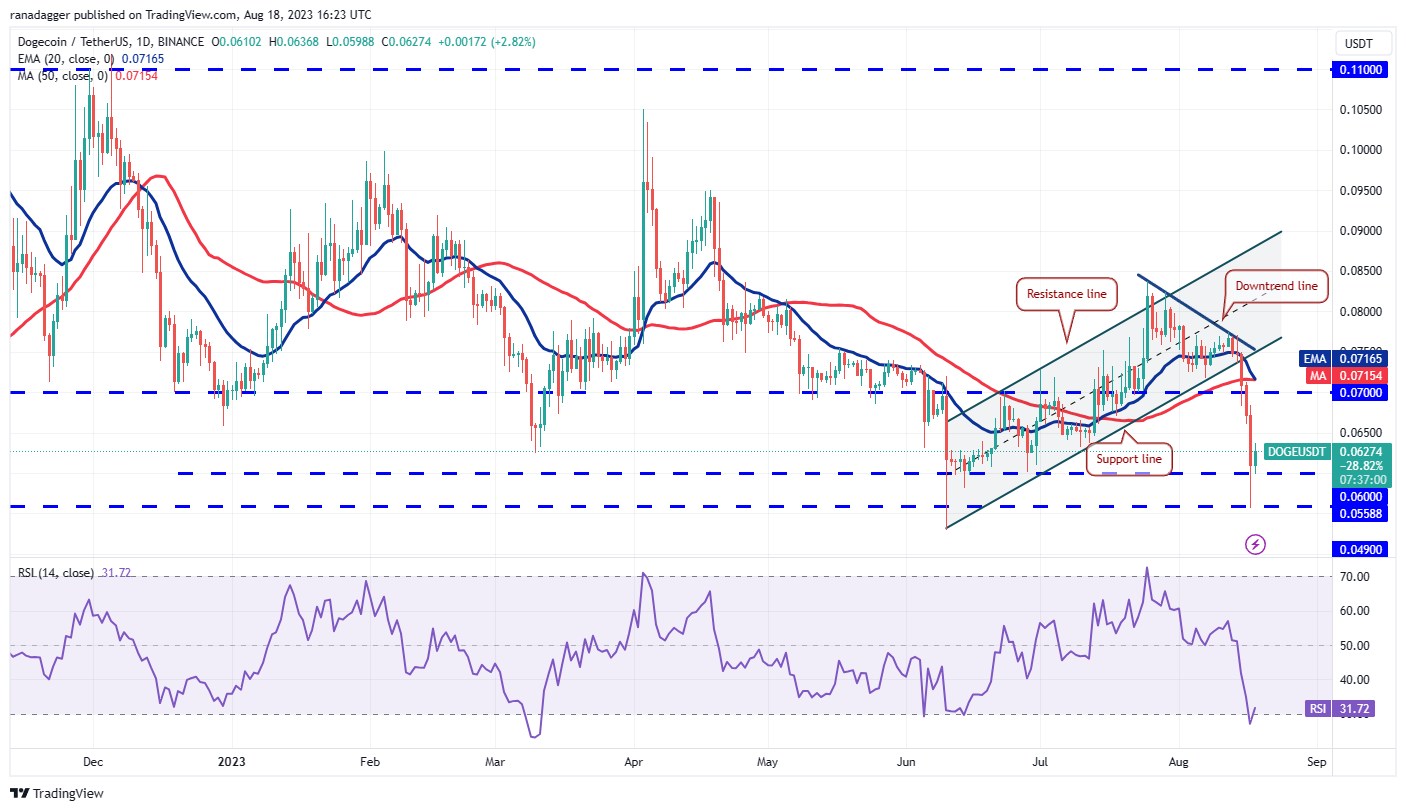
Dogecoin (DOGE) fell below the support line of the ascending channel pattern on Aug. 15. This may have triggered stop-loss orders on long positions and attracted selling from the bears.
 DOGE/USDT daily chart. Source: TradingView
The DOGE/USDT pair closed below the breakout level of $0.07 on Aug. 16, indicating that the bears are in control. The selling continued on Aug. 17, with the bears pulling the price below the critical support at $0.06. A minor positive for the bulls was the strong buying at lower levels.
The price rebounded above $0.06, and the bulls will attempt to push the price toward the overhead resistance of $0.07.
However, sellers are likely to have other intentions. They will aim to drive the price down and maintain it below $0.06. If successful, the pair may plummet toward $0.05.
Related: SpaceX Bitcoin write-down sparks confusion, Bitcoiners quiz Elon Musk
Polkadot price analysis
The tight range trading in Polkadot (DOT) expanded downward on Aug. 15, initiating a decline that nearly reached the critical support at $4.22 on Aug. 17.
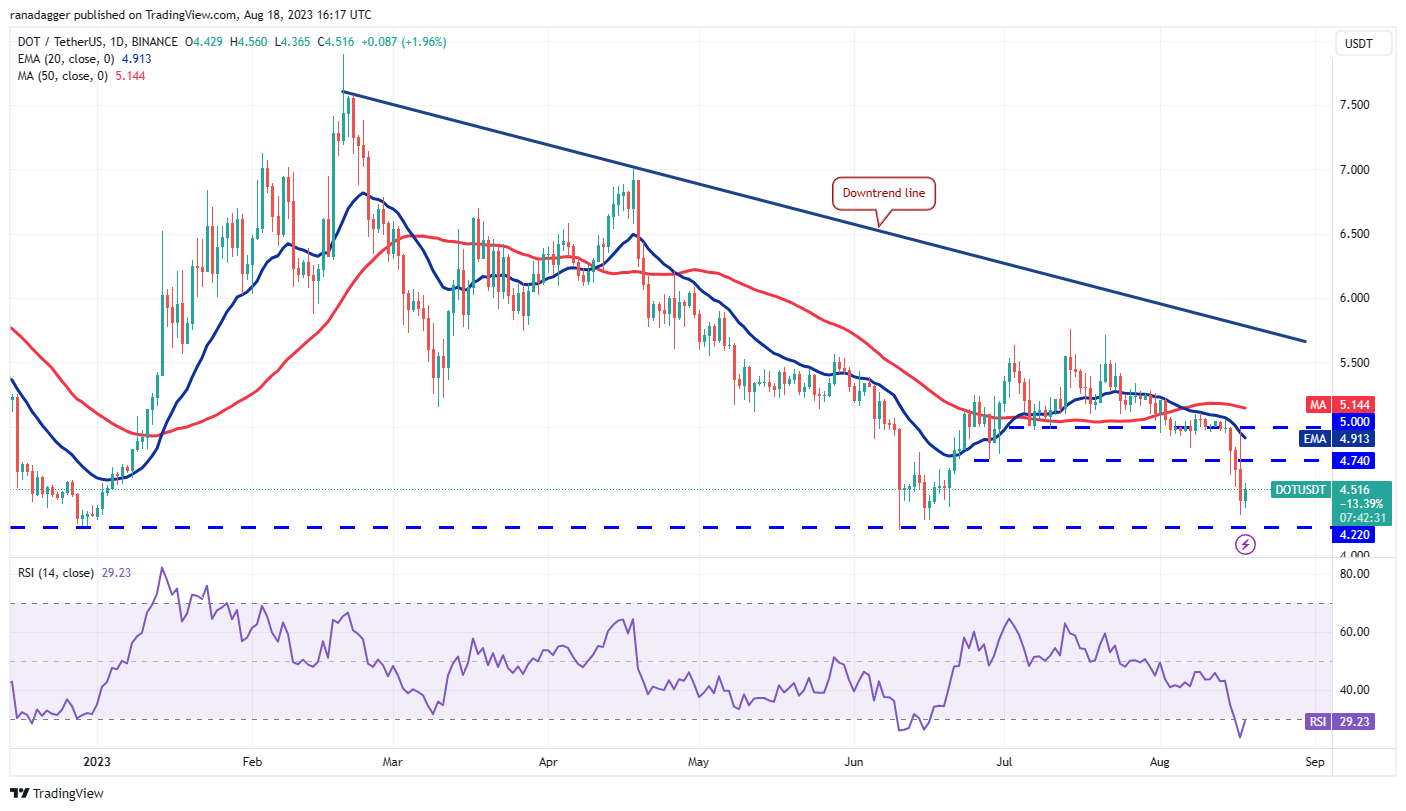 DOT/USDT daily chart. Source: TradingView
The bulls will strive to defend the $4.22 support vigorously, but any recovery is likely to encounter significant selling at the 20-day EMA ($4.91). If the price declines from this level, the bears are expected to target the $4.22 support once more. If this level fails, the DOT/USDT pair may commence the next phase of the downtrend.
Alternatively, if the price declines from the 20-day EMA but rebounds off $4.22, it would suggest that the pair may consolidate for a few days. The bulls will gain momentum if the price rises above the moving averages.
Polygon price analysis
Polygon’s (MATIC) drop below the $0.65 support triggered aggressive selling, pulling the price beneath the next significant support at $0.60 on Aug. 17.
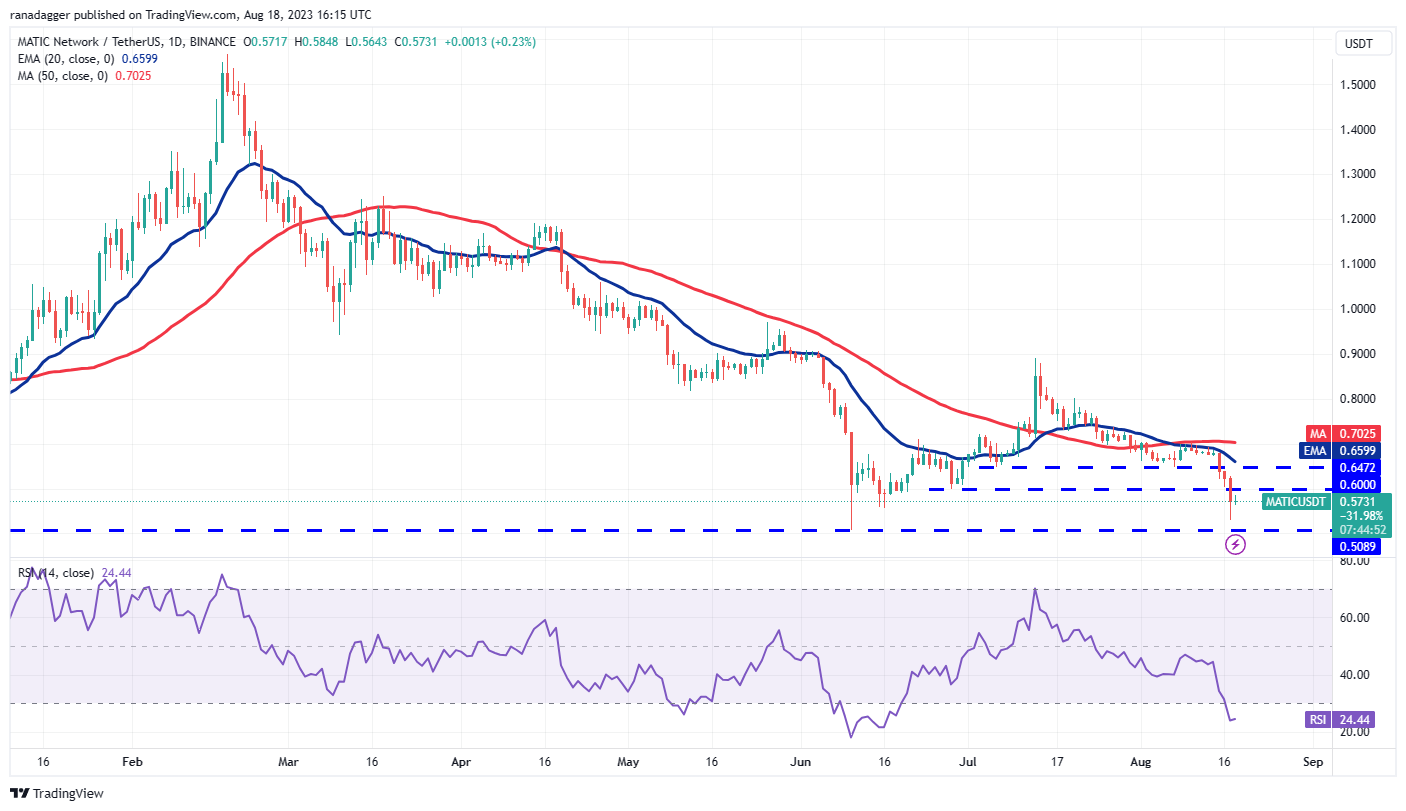 MATIC/USDT daily chart. Source: TradingView
The bulls bought the dip near $0.50, indicating strong demand at lower levels. However, buyers may encounter selling pressure at $0.60 and again at the 20-day EMA ($0.66). If the price declines from the overhead resistance, the MATIC/USDT pair may retest the crucial support at $0.50.
If this support fails, the pair could drop to $0.45 and then to $0.42. On the upside, the bulls will need to push the price above the moving averages to signal that the downtrend could be concluding.
Litecoin price analysis
Litecoin (LTC) experienced a sharp decline after breaking below the support at $81 on Aug. 15, with the price falling to $56 on Aug. 17.
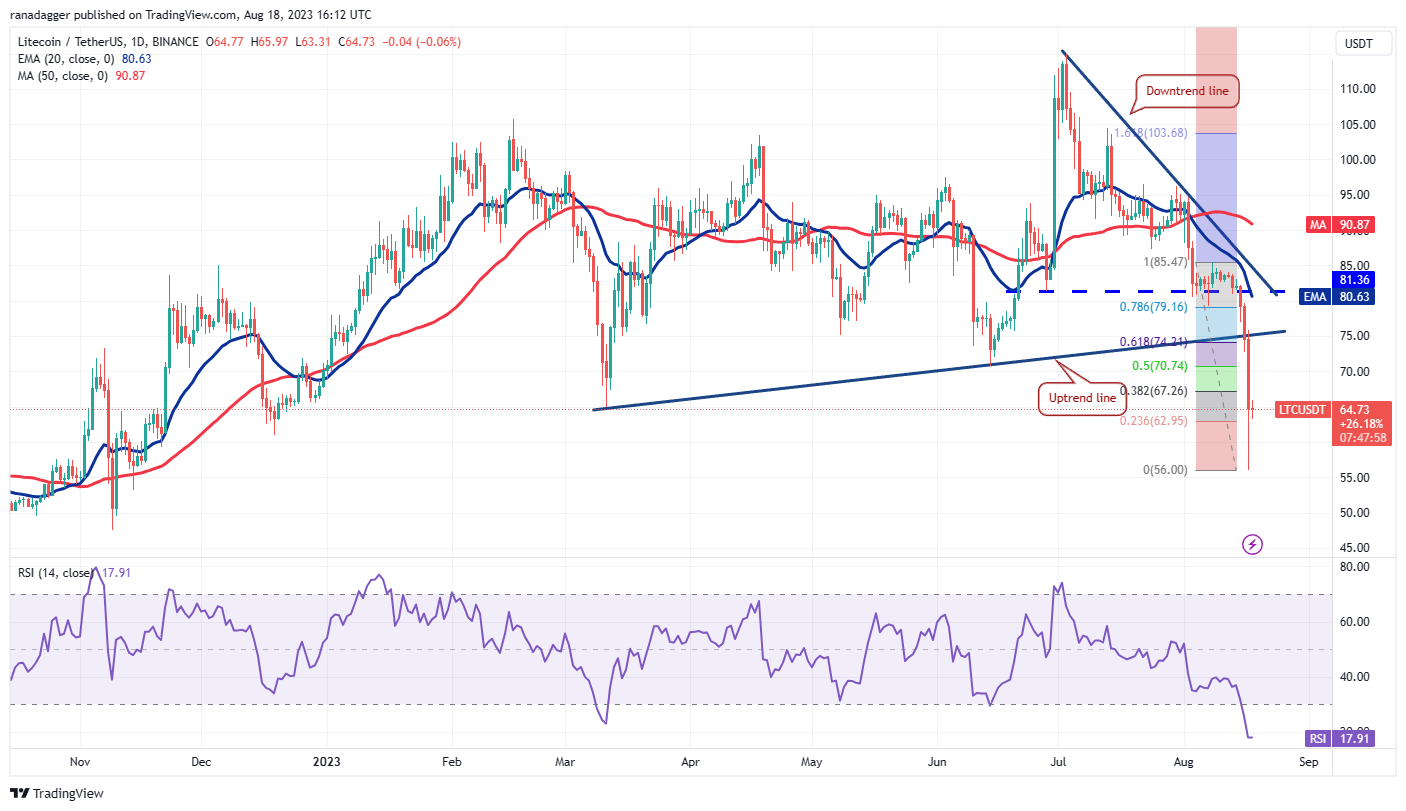 LTC/USDT daily chart. Source: TradingView
The steep drop over the past few days has pushed the RSI into oversold territory, indicating that a minor recovery or consolidation is likely in the near term. Any relief rally may face selling pressure in the zone between the 50% Fibonacci retracement level of $70 and the 61.8% retracement level of $74.
If the price declines from the overhead resistance, the LTC/USDT pair could establish a range for a few days. A break and close below the critical level of $56 could extend the decline to $50.
This article does not contain investment advice or recommendations. Every investment and trading move involves risk, and readers should conduct their own research when making a decision.