Disclaimer: Information found on CryptoreNews is those of writers quoted. It does not represent the opinions of CryptoreNews on whether to sell, buy or hold any investments. You are advised to conduct your own research before making any investment decisions. Use provided information at your own risk.
CryptoreNews covers fintech, blockchain and Bitcoin bringing you the latest crypto news and analyses on the future of money.
Bitcoin (BTC) has been trading below the $29,000 mark for several days. The analyst community is split regarding Bitcoin’s short-term outlook. Some analysts anticipate a rise to $30,000, while others believe a local peak has been reached.
Mike McGlone, a senior macro strategist at Bloomberg Intelligence, indicated that cryptocurrencies, along with the stock market, crude oil, and copper, may struggle to maintain the recent recovery due to tight bank liquidity levels.
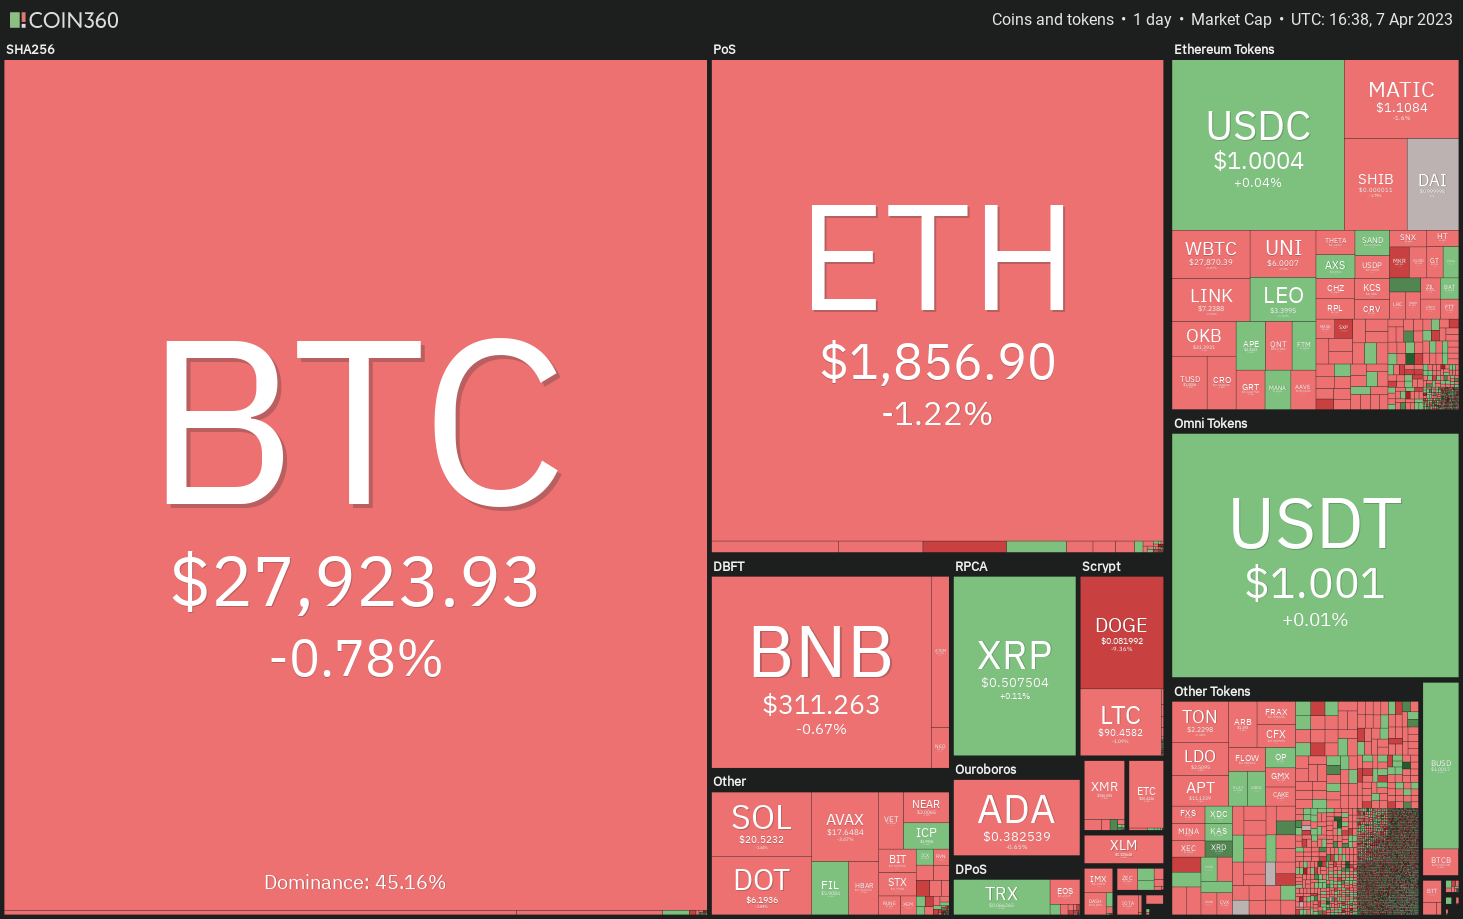 Daily cryptocurrency market performance. Source: Coin360
Conversely, Anthony Scaramucci, founder of SkyBridge Capital, mentioned in an interview with Yahoo Finance that the bear market for Bitcoin might be concluding, although he acknowledged this as speculation. He emphasized that Bitcoin has consistently outperformed other asset classes over the long term.
Will Bitcoin decline from its current position, or will bulls regroup and drive the price above $30,000? Let’s analyze the charts of the top 10 cryptocurrencies to determine the outcome.
Bitcoin price analysis
Bitcoin (BTC) has established a symmetrical triangle around $29,000, indicating uncertainty among bulls and bears regarding the next directional movement.
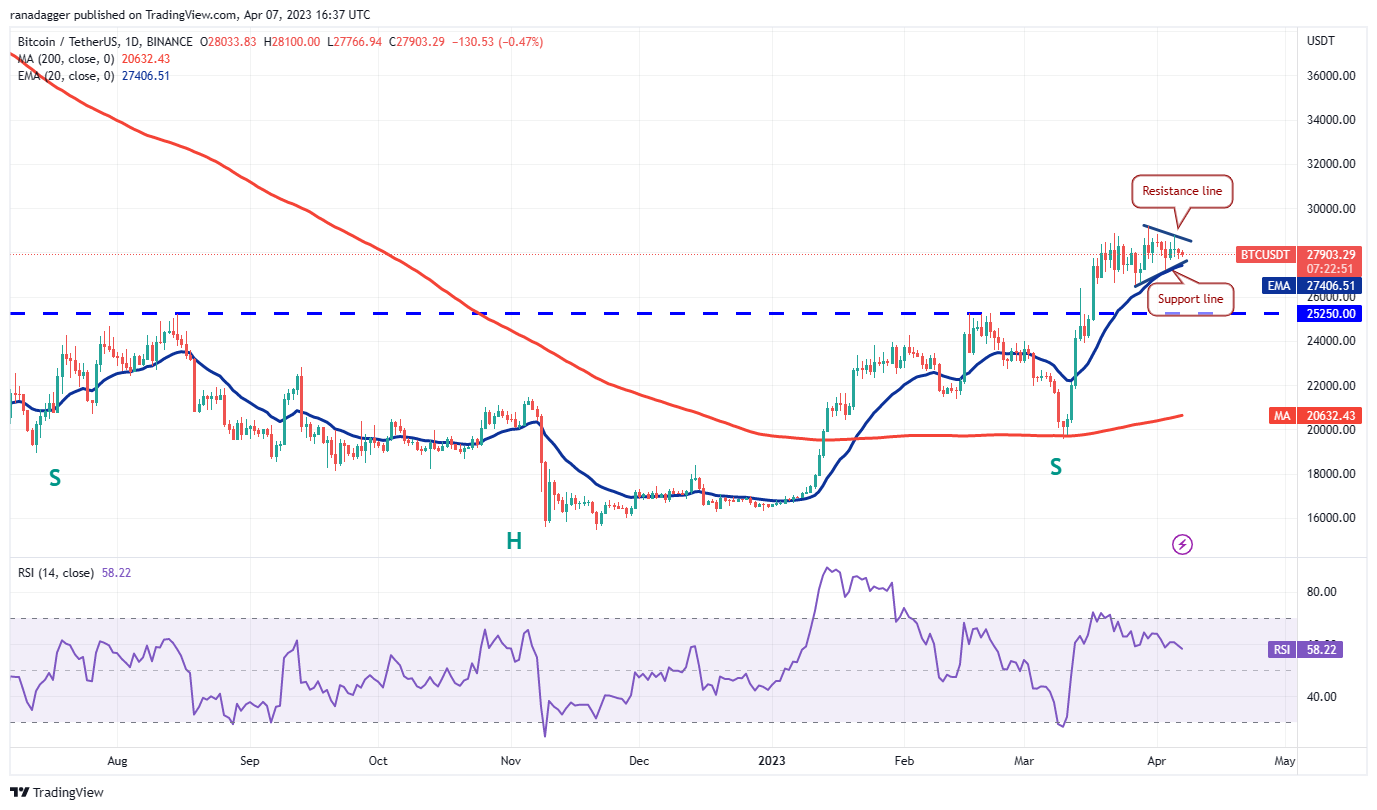 BTC/USDT daily chart. Source: TradingView
The ascending 20-day exponential moving average (EMA) ($27,406) and the relative strength index (RSI) above 58 suggest a slight advantage for the bulls. If the price bounces off the support line, buyers will attempt to push the BTC/USDT pair above the triangle.
If successful, the pair may initiate the next phase of the upward movement. The target for a breakout from the triangle is $31,280.
On the other hand, a drop below the support line would shift the short-term advantage to the bears. The pair could then fall to the breakout level of $25,250, which buyers are expected to defend vigorously.
Ether price analysis
Ether’s (ETH) rally reversed from $1,943 on April 5, indicating that bears are actively defending the psychological barrier at $2,000.
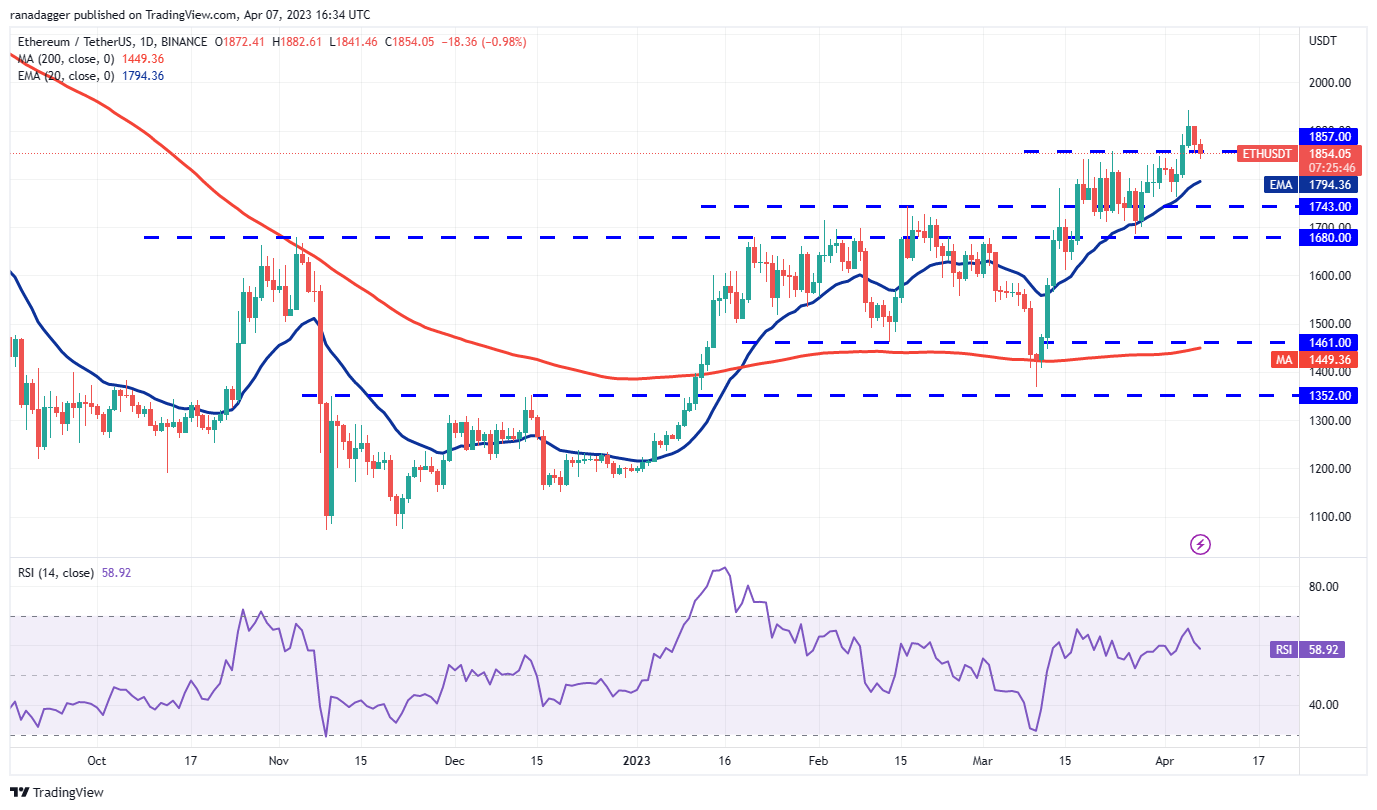 ETH/USDT daily chart. Source: TradingView
The initial support level is at $1,857. If this level is breached, the ETH/USDT pair could retreat to the 20-day EMA ($1,794), which remains a critical level for bulls to defend to maintain the upward trend.
If the price rebounds from the 20-day EMA, bulls will once again attempt to overcome the resistance at $2,000. If they succeed, the pair may rise to $2,200.
Conversely, if the price falls below the 20-day EMA, it may prompt short-term traders to take profits. The pair could then decline to $1,743 and subsequently to $1,680.
BNB price analysis
BNB (BNB) is experiencing a downturn from the 20-day EMA ($314), indicating strong resistance from bears at this level.
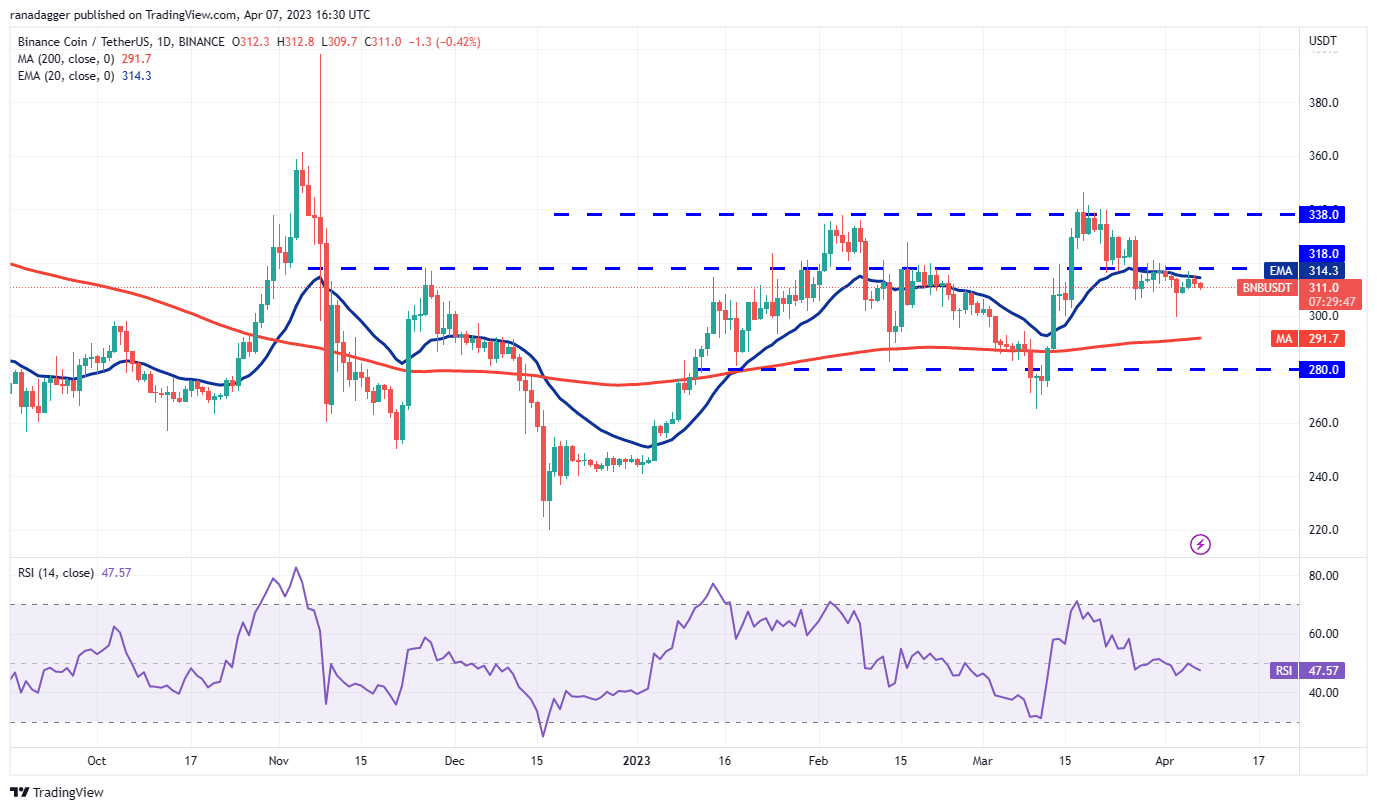 BNB/USDT daily chart. Source: TradingView
The gradually declining 20-day EMA and the RSI just below the midpoint indicate a slight advantage for the bears. If the $306 support fails, the BNB/USDT pair could drop to $300 and then to the 200-day SMA ($291).
Bulls must push the price above the immediate resistance at $318 to prevent further declines. This could pave the way for a rise to the resistance zone between $338 and $346.
XRP price analysis
XRP (XRP) has remained above the 38.2% Fibonacci retracement level of $0.49 for several days, suggesting that bulls are buying on minor dips.
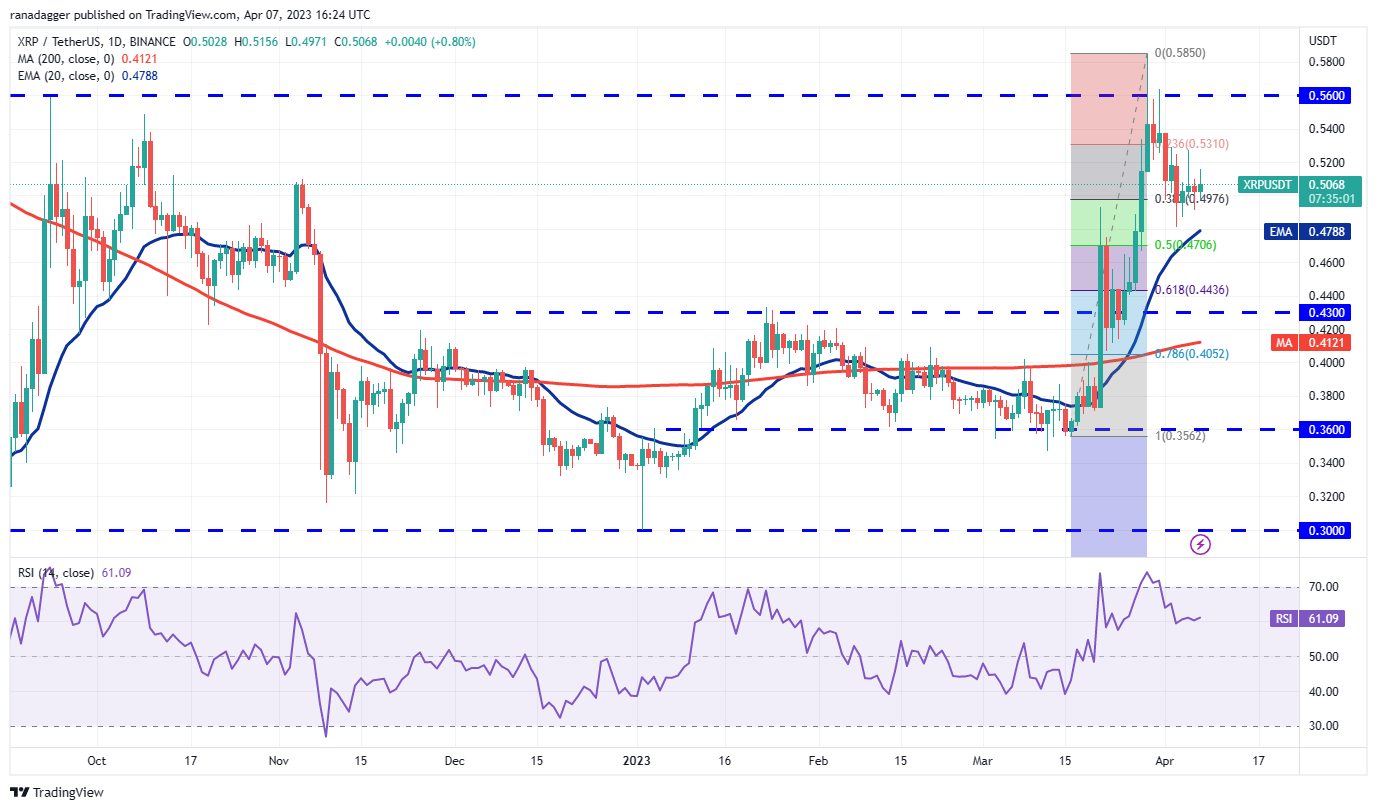 XRP/USDT daily chart. Source: TradingView
The rising 20-day EMA ($0.47) and the RSI in positive territory indicate that bulls have the upper hand. Buyers will next aim to drive the price to the resistance zone of $0.56 to $0.58. A close above this zone would signal the beginning of the next recovery phase.
On the contrary, if the price fails to surpass the overhead zone, it will indicate that bears are still active at higher levels. Sellers will then attempt to pull the price below the 20-day EMA. If that occurs, the pair may drop to $0.43.
Cardano price analysis
Bears prevented Cardano’s ADA (ADA) from breaking above the neckline and completing the inverse head-and-shoulders (H&S) pattern.
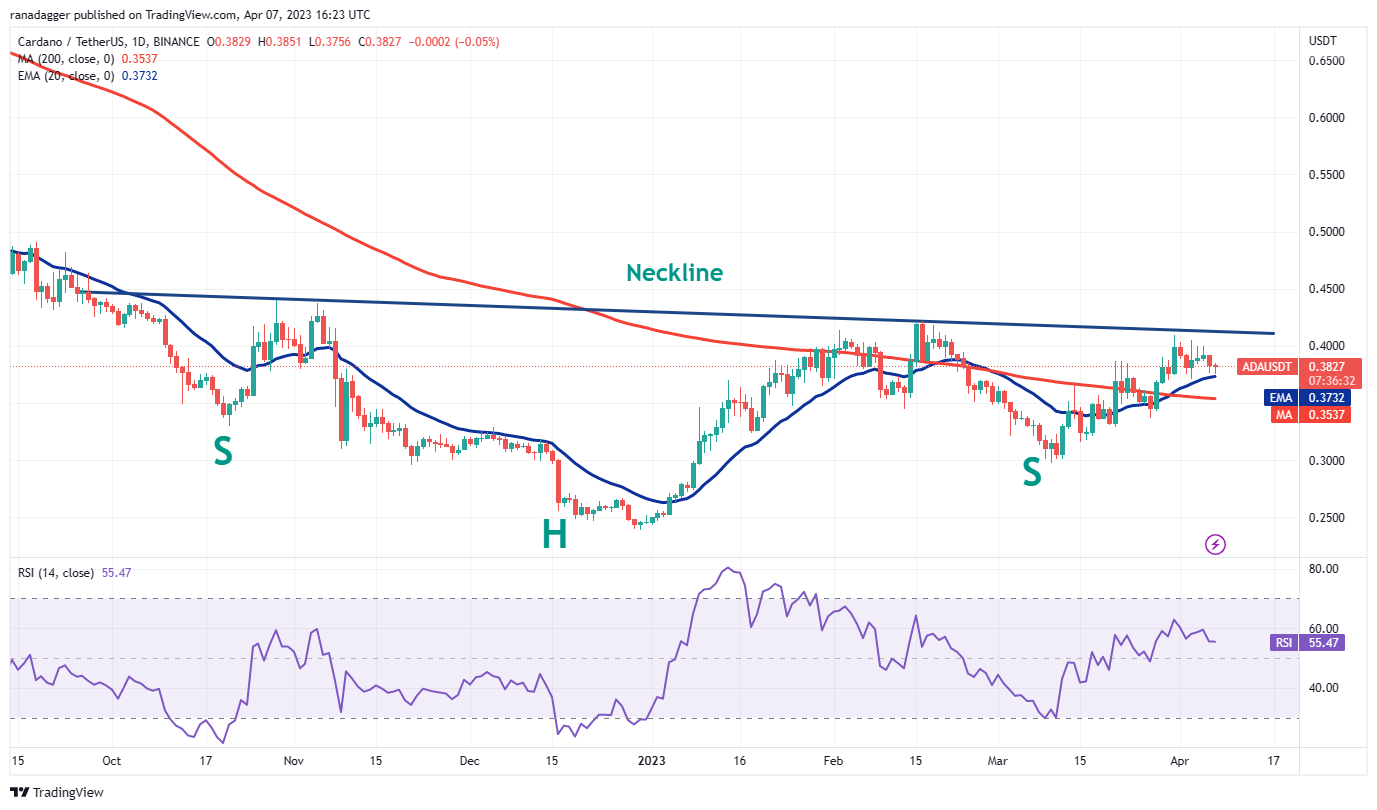 ADA/USDT daily chart. Source: TradingView
The price has reached the 20-day EMA ($0.37), which is a critical level for bulls to defend. If the ADA/USDT pair bounces off the 20-day EMA, buyers will make another attempt to breach the barrier at the neckline. If successful, it would indicate the start of a new uptrend.
Related Posts
Conversely, if the price falls below the 20-day EMA, it would suggest that short-term bulls may be taking profits. The pair could then decline to the 200-day SMA ($0.35).
Dogecoin price analysis
Traders took advantage of Dogecoin’s (DOGE) rise on April 3 to reduce their positions, indicating a continued negative sentiment and selling on rallies.
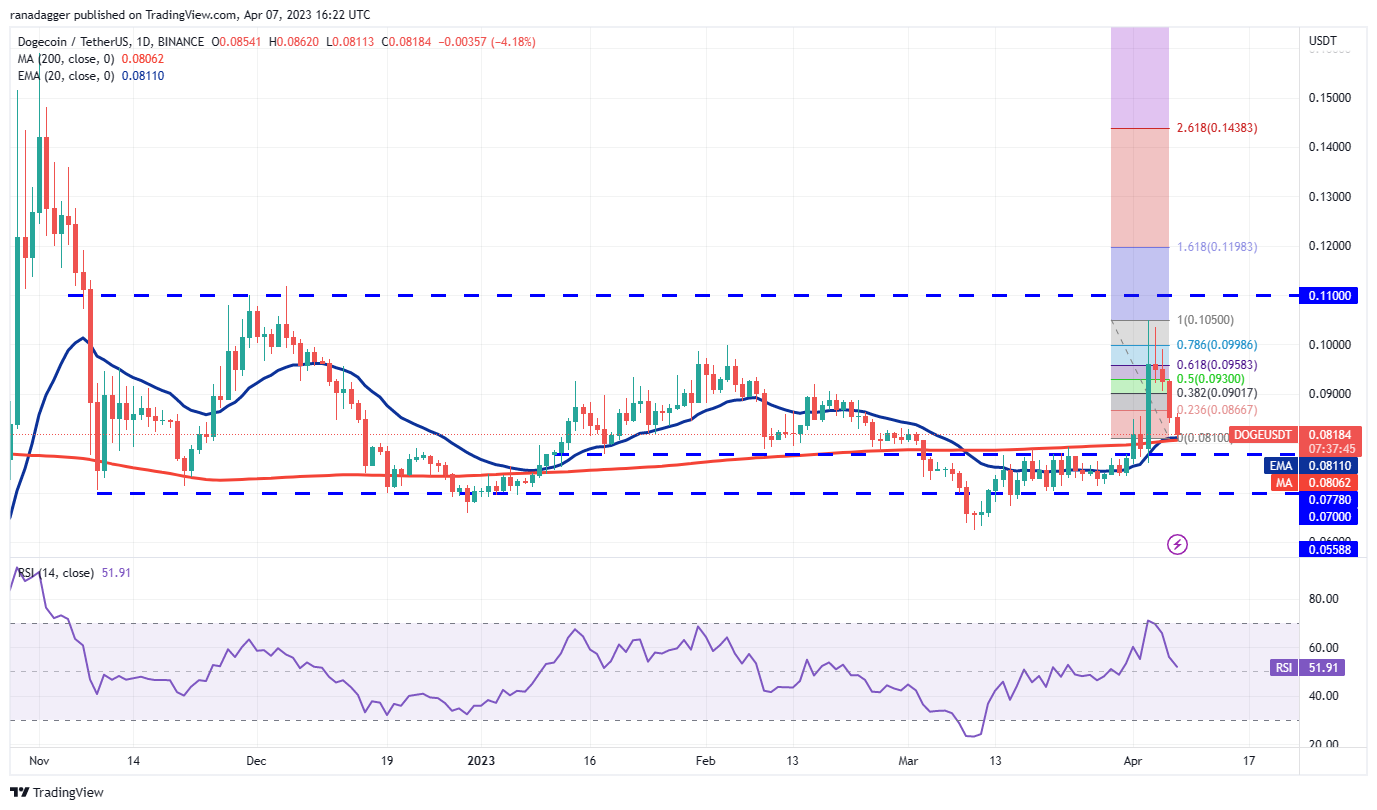 DOGE/USDT daily chart. Source: TradingView
The sharp decline over the past four days suggests that the DOGE/USDT pair will continue to trade within the broad range of $0.07 to $0.11 for some time. The price has approached the moving averages, which may serve as strong support. If the price rebounds from the current level, the pair may recover to the 50% Fibonacci retracement level of $0.09.
Alternatively, if the price falls below the moving averages, it would indicate a slight advantage for the bears. The pair may then drop to $0.07.
Polygon price analysis
Polygon’s MATIC (MATIC) has created a symmetrical triangle pattern, reflecting indecision among bulls and bears.
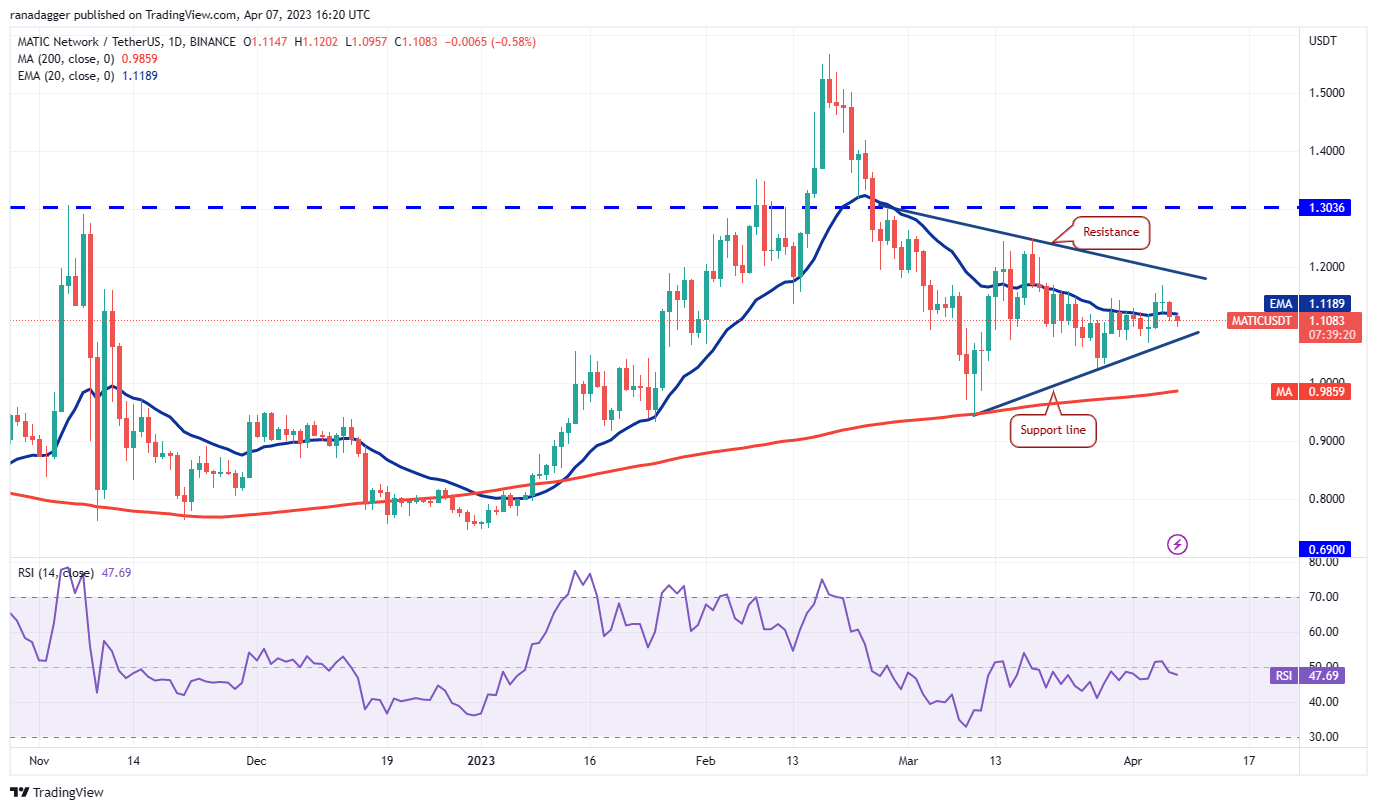 MATIC/USDT daily chart. Source: TradingView
If the price bounces off the triangle’s support line, it would indicate that bulls are defending this level. This could keep the pair within the triangle for a longer period. If the price rises above the 20-day EMA ($1.11), bulls will again attempt to drive the MATIC/USDT pair to the triangle’s resistance line.
On the downside, a break and close below the triangle’s support line would suggest that bears have gained the upper hand. This could lead to a potential drop to the 200-day SMA ($0.98).
Related: XRP price eyes 30% upside after key resistance area breaks
Solana price analysis
Buyers were unable to maintain Solana’s SOL (SOL) above the 20-day EMA ($20.81) in recent days, indicating a decrease in demand at higher levels.
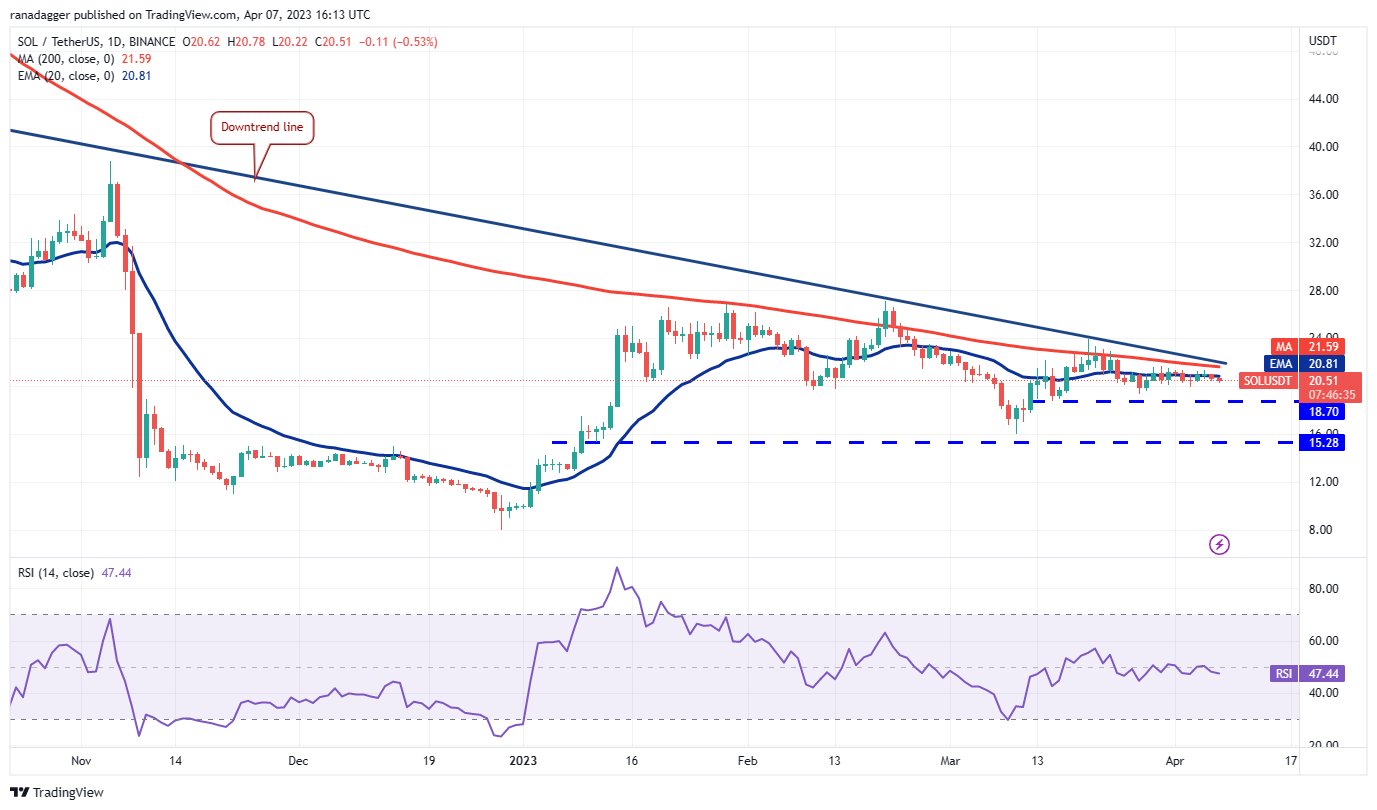 SOL/USDT daily chart. Source: TradingView
The 20-day EMA is relatively flat, and the RSI is just below the midpoint, suggesting that the SOL/USDT pair may remain between the downtrend line and $18.70 for a while. A drop below $18.70 would indicate that bears have taken control. The pair may then extend its decline to the critical support level at $15.28.
Conversely, if the price rebounds from the current level and breaks above the downtrend line, it would indicate that bulls are re-entering the market. The pair may then rise to $27.12.
Polkadot price analysis
Polkadot’s DOT (DOT) has fallen below the 20-day EMA ($6.22), indicating that bulls are losing their hold. The price could decline to the strong support level at $5.70.
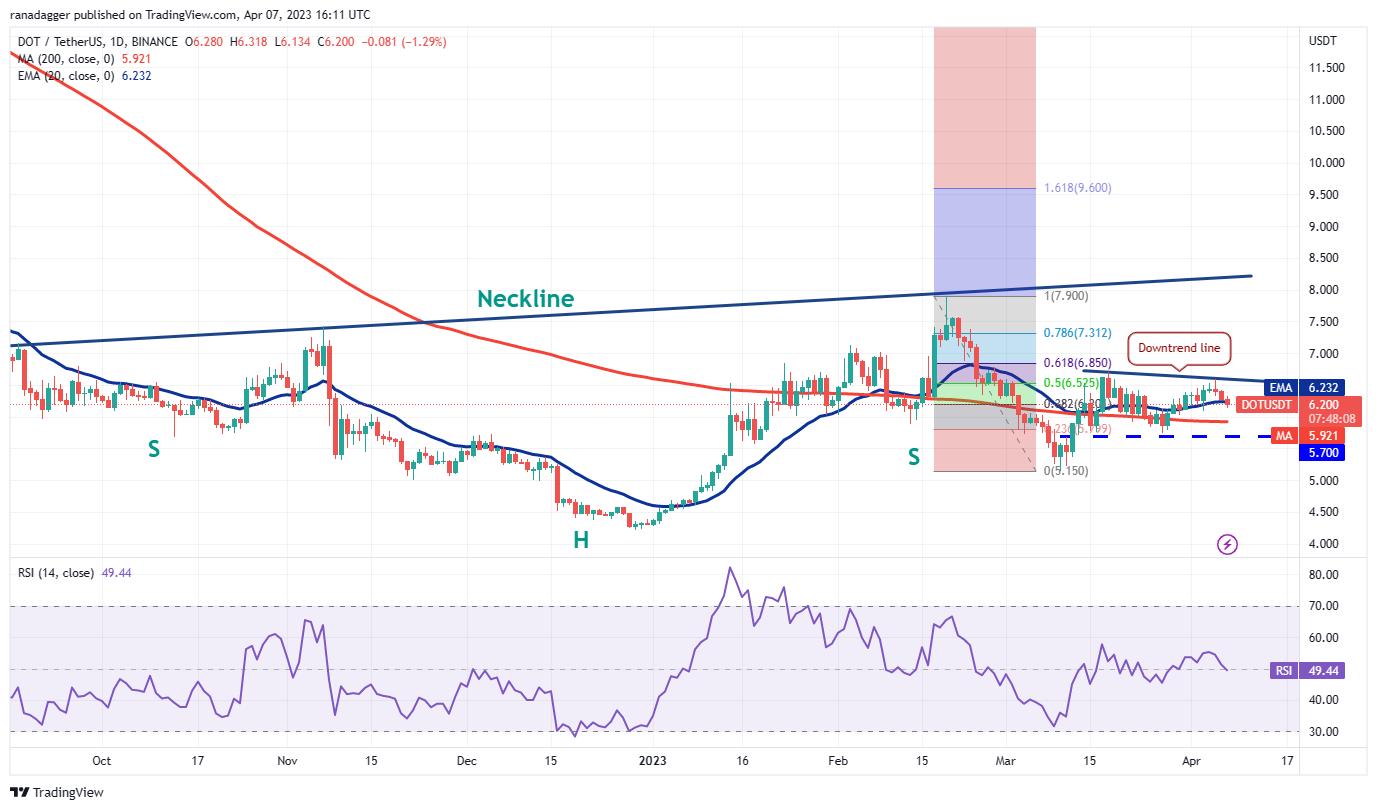 DOT/USDT daily chart. Source: TradingView
If the price bounces off $5.70, the DOT/USDT pair may attempt a rally to the downtrend line and oscillate between these two levels for a period. A rally above the downtrend line would clear the way for a potential rise to the neckline of the developing inverse H&S pattern.
Alternatively, if the price breaks below $5.70, the advantage would shift to the sellers. The pair may then decline to $5.15, a significant level to monitor, as a breach could lead to a drop to $4.50.
Litecoin price analysis
The inability of bulls to push Litecoin (LTC) above $96 has strengthened the bears, who are now attempting to pull the price below the 20-day SMA ($90).
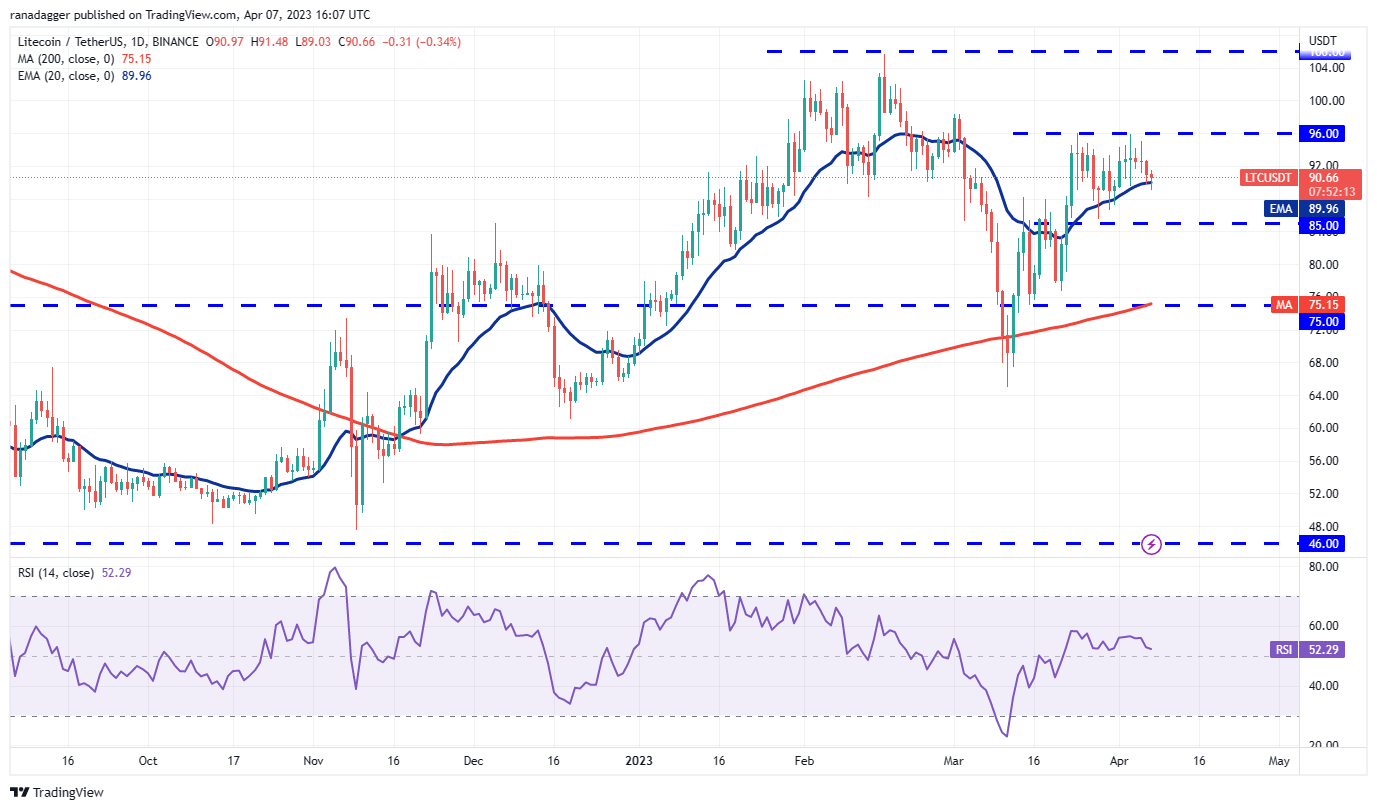 LTC/USDT daily chart. Source: TradingView
If they succeed, the next target could be $85. This is a crucial level to watch, as a break and close below it may lead to a retest of the 200-day SMA ($75).
Alternatively, if the price rebounds from the current level but fails to surpass $85, the LTC/USDT pair may remain range-bound between $85 and $96 for several days.
The 20-day EMA is gradually sloping upwards, but the RSI has approached the midpoint, indicating a potential consolidation in the near term. Buyers will need to overcome the resistance at $96 to extend the recovery to $106.
The views, thoughts, and opinions expressed here are solely those of the authors and do not necessarily reflect or represent the views and opinions of Cointelegraph.
This article does not provide investment advice or recommendations. Every investment and trading decision carries risk, and readers should conduct their own research before making any decisions.
Magazine: Best and worst countries for crypto taxes — Plus crypto tax tips