Disclaimer: Information found on CryptoreNews is those of writers quoted. It does not represent the opinions of CryptoreNews on whether to sell, buy or hold any investments. You are advised to conduct your own research before making any investment decisions. Use provided information at your own risk.
CryptoreNews covers fintech, blockchain and Bitcoin bringing you the latest crypto news and analyses on the future of money.
Bitcoin (BTC) has experienced significant fluctuations over the past three days. The increase in volatility indicates that buyers and sellers are competing for dominance.
Bitcoin made a notable recovery on April 18 but relinquished all its gains on April 19. The recent downturn may have been influenced by elevated inflation rates in the United Kingdom and ongoing regulatory ambiguity in the United States. Profit-taking was not confined to Bitcoin, as many prominent altcoins also declined.
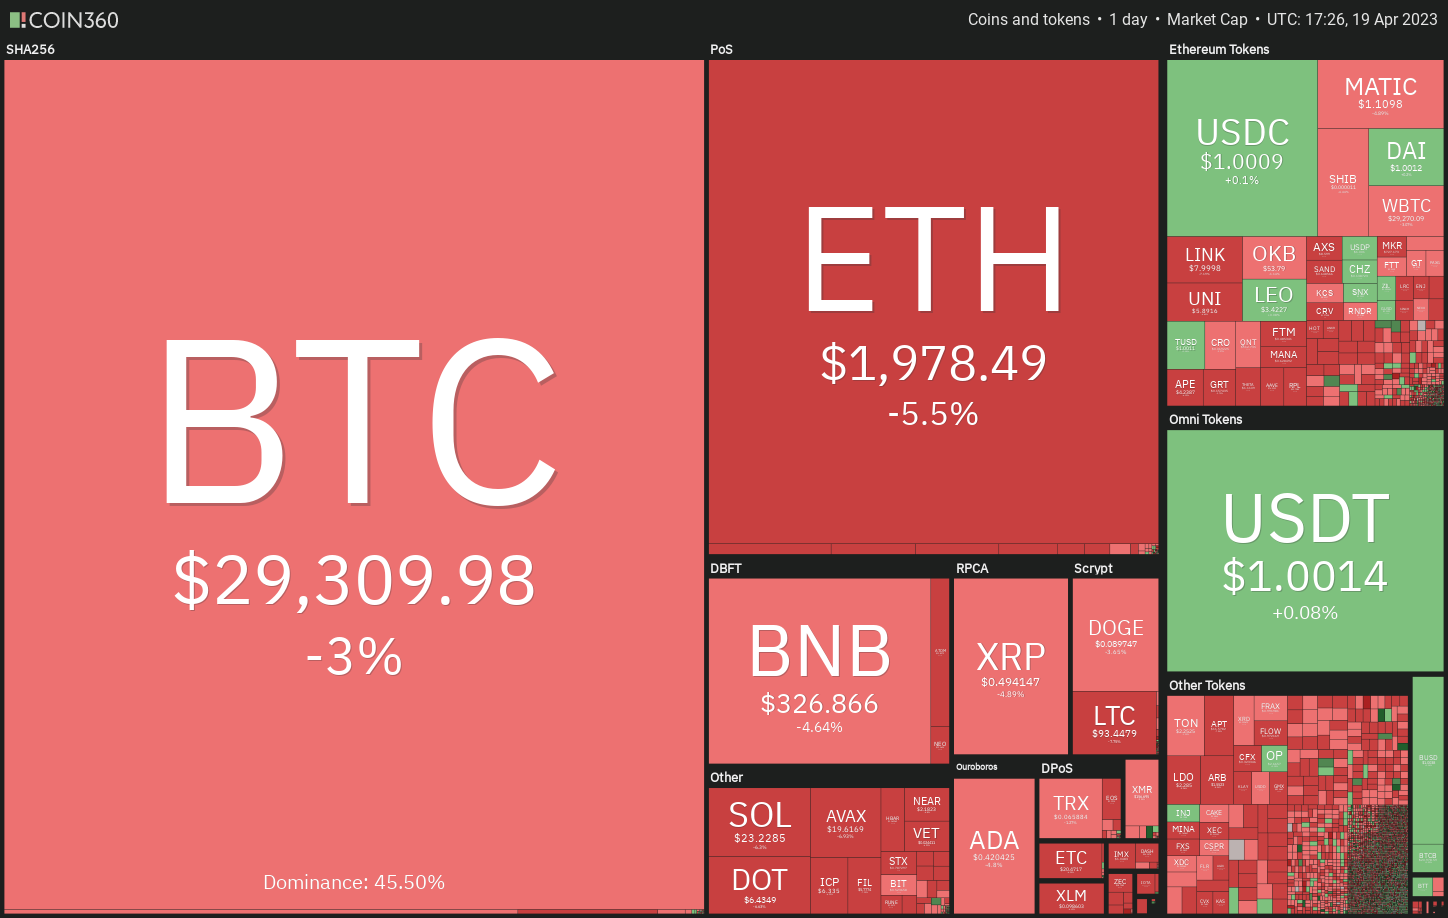 Daily cryptocurrency market performance. Source: Coin360
While a significant correction is a possibility, Glassnode noted in its April 17 analysis that various on-chain metrics suggest the conclusion of the bear market. If this holds true, the dips may be perceived as buying opportunities by long-term investors.
What are the key support levels that the bulls are likely to defend? Let’s examine the charts of the top-10 cryptocurrencies to find out.
Bitcoin price analysis
Bitcoin is currently experiencing a fierce contest between the bulls and the bears at the 20-day exponential moving average ($29,092). The bears are attempting to push the price below the 20-day EMA, while the bulls are striving to initiate a robust rebound.
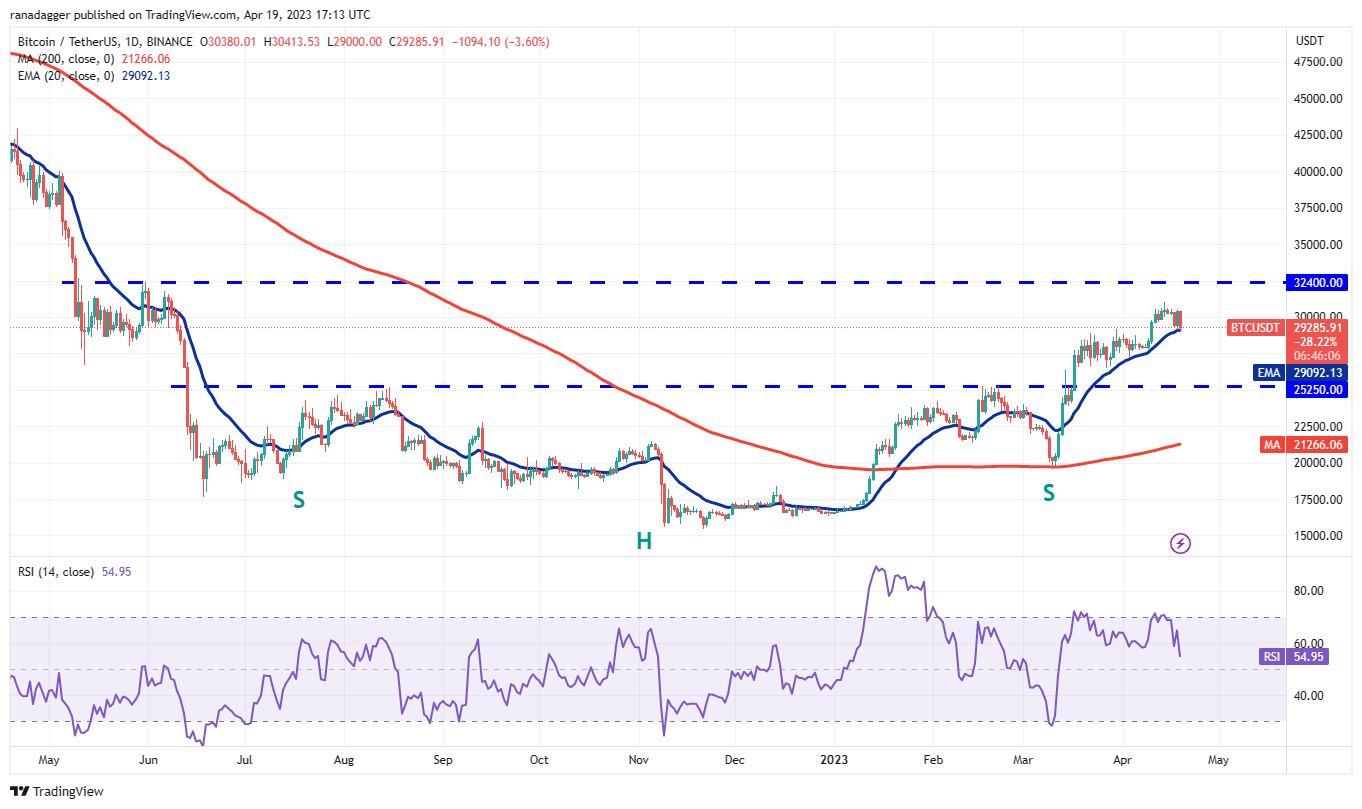 BTC/USDT daily chart. Source: TradingView
If the price rebounds from the 20-day EMA, it will indicate that the sentiment remains optimistic and that traders are viewing the dips as a buying opportunity.
The bulls will then make another attempt to surpass the resistance zone between $31,000 and $32,000. A successful breakthrough would signify the resumption of the uptrend, potentially propelling the BTC/USDT pair to $40,000.
However, the bears may have different intentions. If they manage to pull the price below the 20-day EMA, selling pressure could increase, and the pair may decline to $27,800 and subsequently to $26,500.
Ether price analysis
The bulls attempted to reignite the uptrend in Ether (ETH) on April 18, but the bears remained active sellers near the overhead resistance at $2,200.
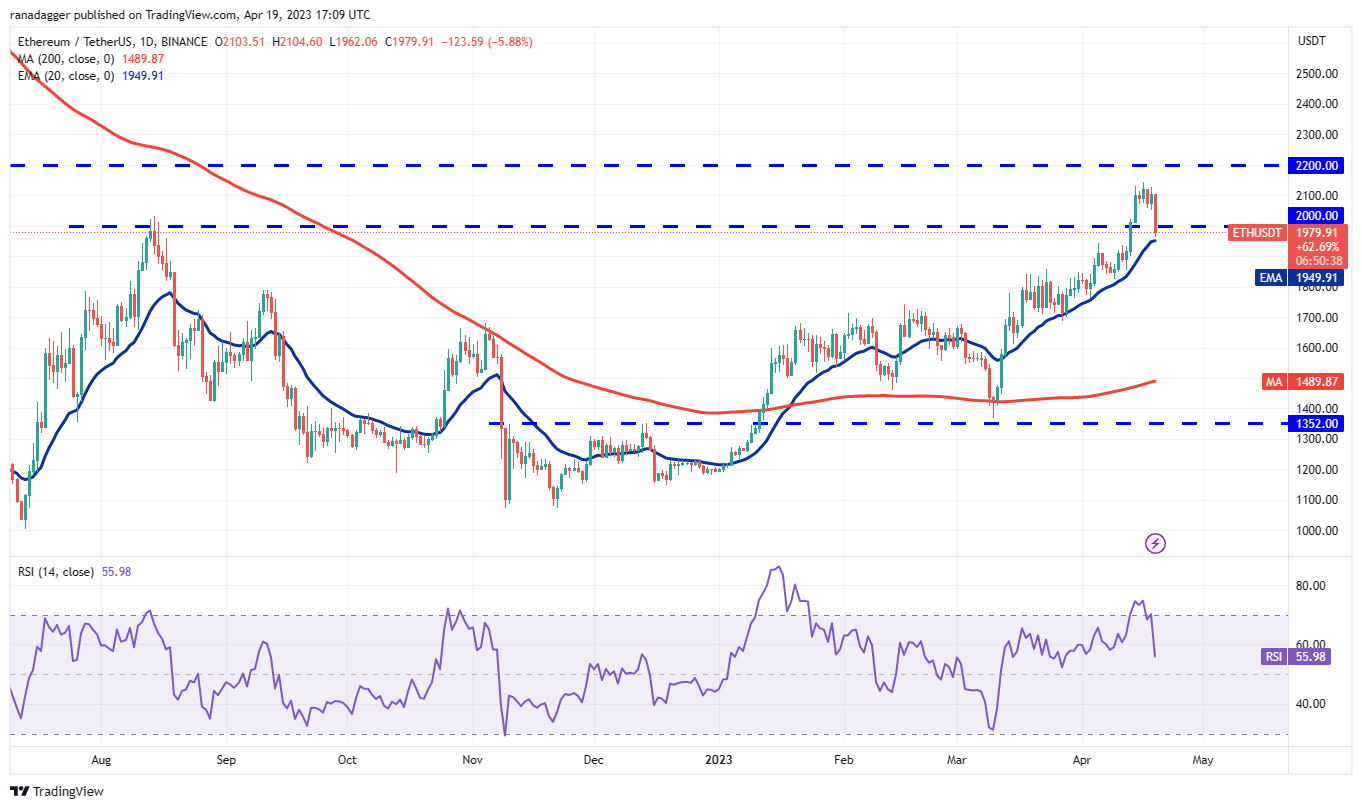 ETH/USDT daily chart. Source: TradingView
The ETH/USDT pair has retraced to the 20-day EMA ($1,949), just below the psychological support of $2,000. This level is crucial for the bulls to defend, as a break and close below it may shift the advantage to the sellers. The pair could initially drop to $1,800 and later to $1,700.
Conversely, if the price bounces off the 20-day EMA, it will indicate that the bulls are attempting to convert the $2,000 level into support. If successful, the pair may rise to $2,200. A break and close above this level would pave the way for a potential rally to $3,000.
BNB price analysis
Buyers defended the $338 level on April 17 and 18 but were unable to push the price above the $350 resistance. This may have encouraged the bears, who pulled BNB (BNB) down to the 20-day EMA ($325) on April 19.
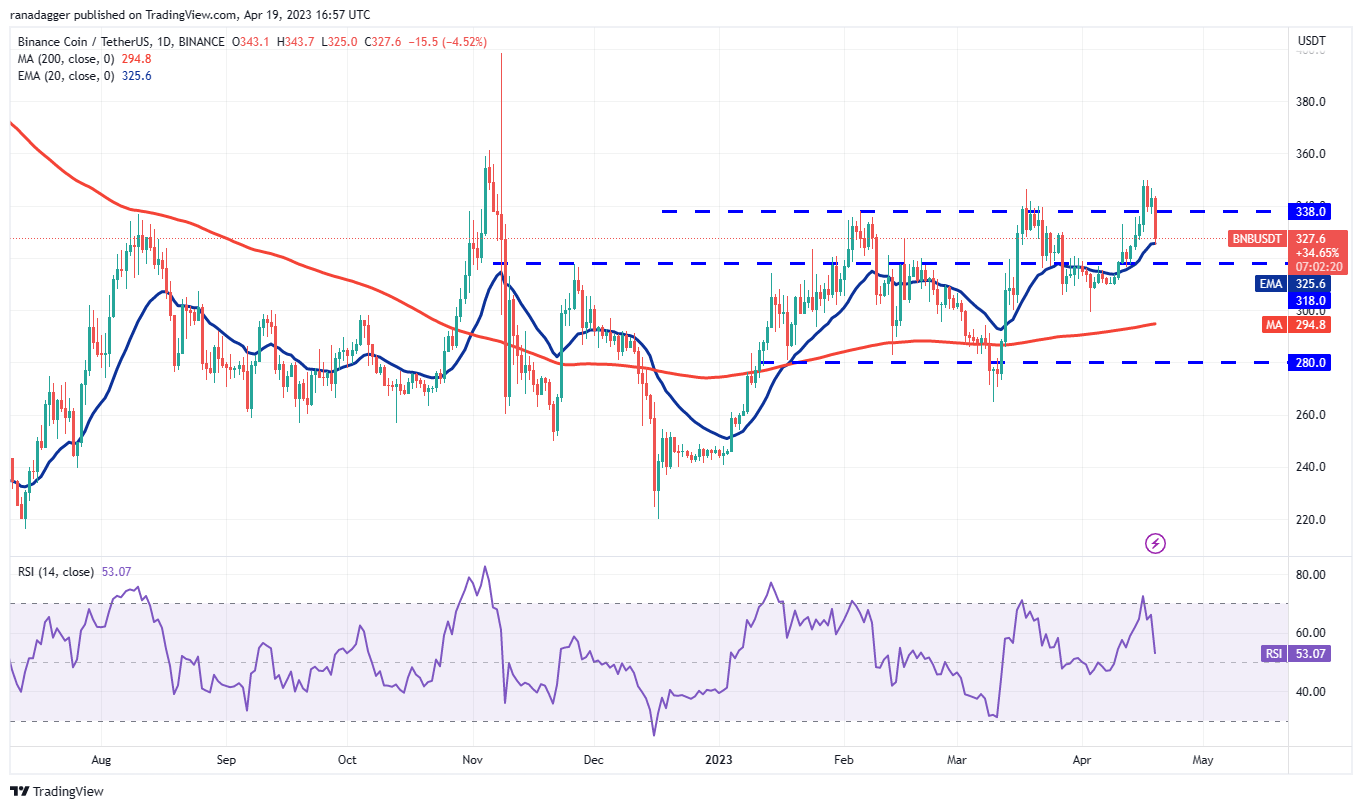 BNB/USDT daily chart. Source: TradingView
This is a critical level to monitor because if it breaks, selling could intensify, and the BNB/USDT pair may plunge to the 200-day simple moving average ($294). This level is likely to attract significant buying from the bulls.
Alternatively, if the price quickly rebounds from the 20-day EMA, it will suggest that the bulls are purchasing the dips. They will then make another attempt to push the price above $350. If successful, the pair may surge to $400.
XRP price analysis
XRP (XRP) bounced off the 20-day EMA ($0.50) on April 18, but the bulls could not overcome the overhead resistance.
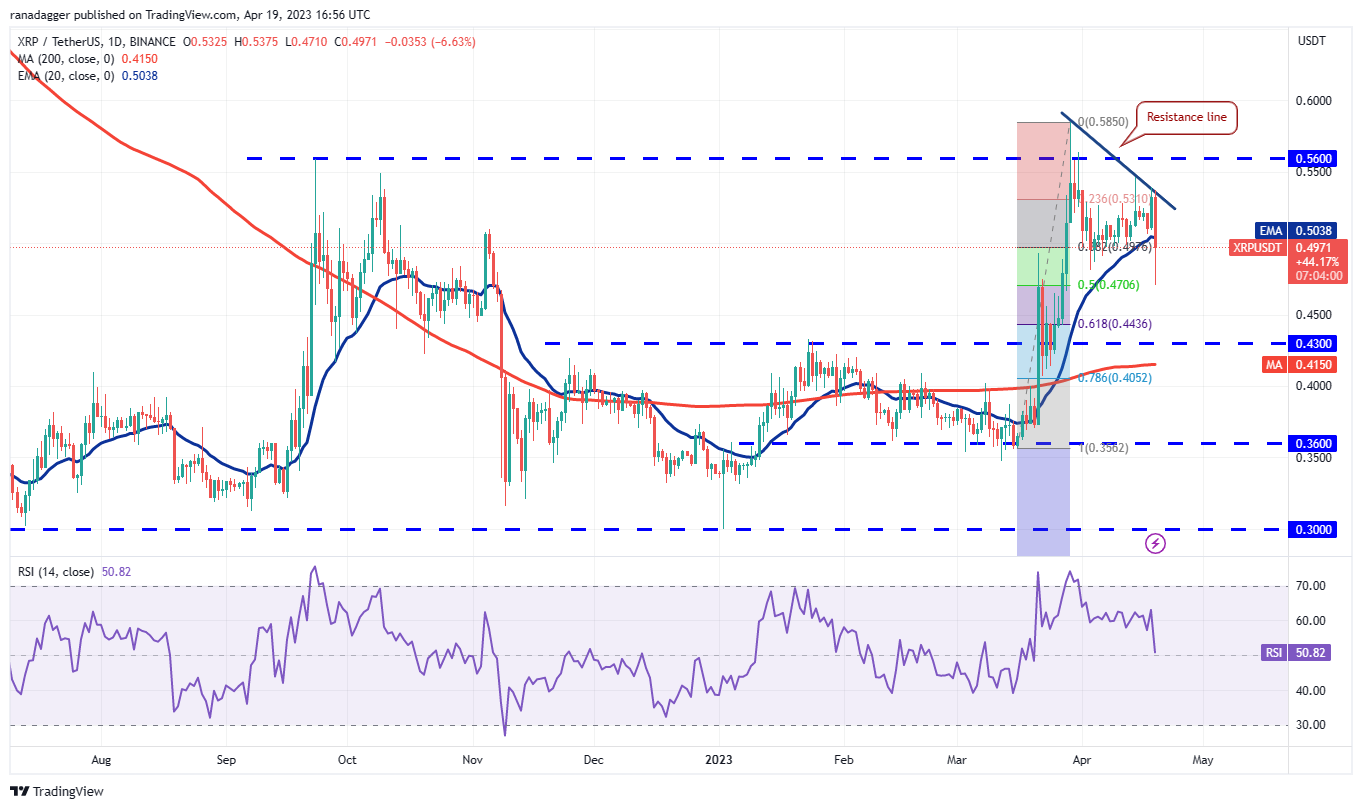 XRP/USDT daily chart. Source: TradingView
The price sharply declined on April 19, falling below the 20-day EMA ($0.50). However, the long tail on the candlestick indicates that buyers are attempting to halt the decline at the 50% Fibonacci retracement level of $0.47.
Any recovery attempt is likely to encounter strong selling pressure in the zone between the resistance line and $0.58. On the downside, a break below $0.47 could pull the XRP/USDT pair down to the 200-day SMA ($0.41). The bulls are expected to aggressively buy the dips at this level.
Cardano price analysis
Cardano (ADA) is experiencing a pullback, which has reached the breakout level of the neckline of the inverse H&S pattern.
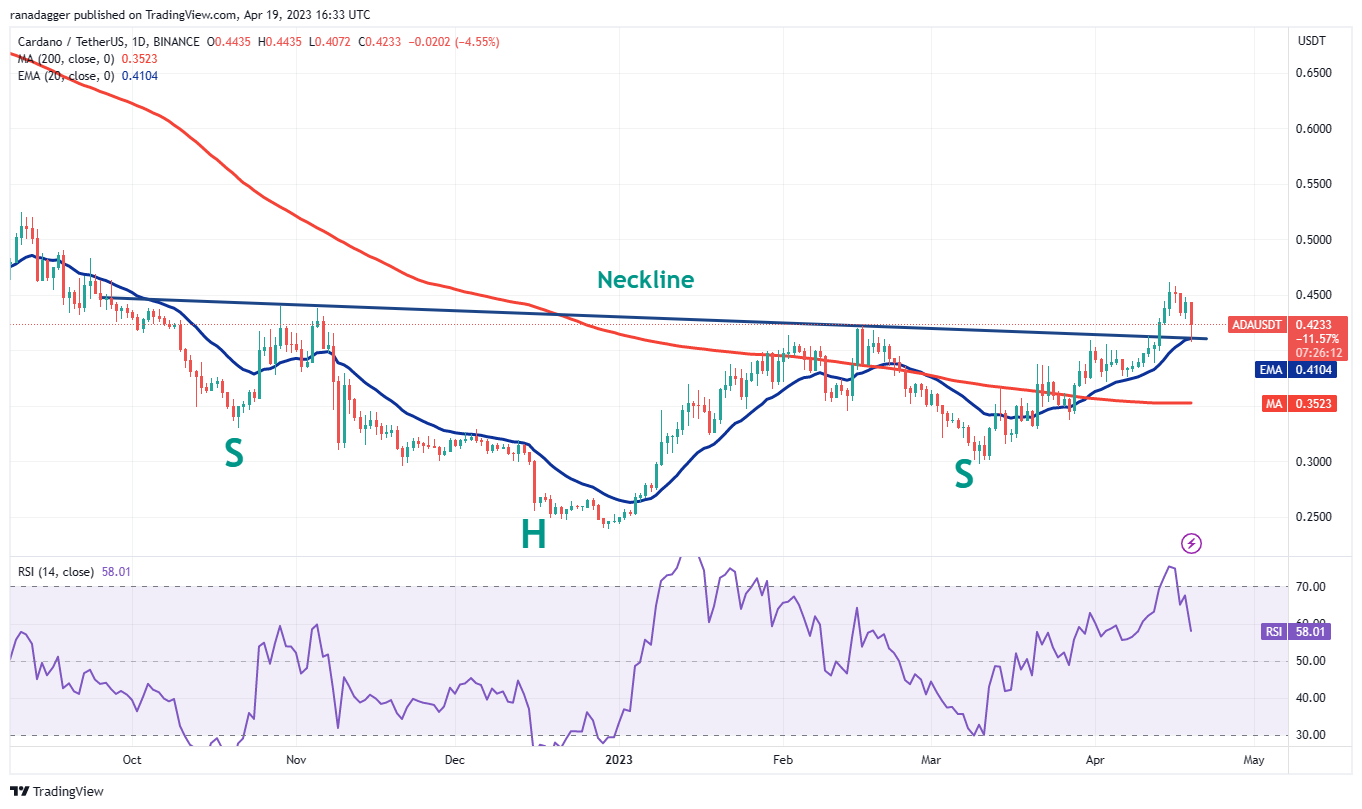 ADA/USDT daily chart. Source: TradingView
Related Posts
If the price rebounds from the neckline, it will indicate that the bulls have converted the level into support. This would enhance the chances of a breakout above $0.46. The ADA/USDT pair may then begin its ascent toward the pattern target of $0.60. The $0.52 level may act as resistance, but it is likely to be surpassed.
In contrast, if the bears manage to pull the price below the neckline, it would suggest that the breakout may have been a bull trap. The pair could then decline to the 200-day SMA ($0.35), where the bulls may intervene to halt the drop.
Dogecoin price analysis
Dogecoin (DOGE) had been steadily climbing but encountered resistance near the 61.8% Fibonacci retracement level of $0.10.
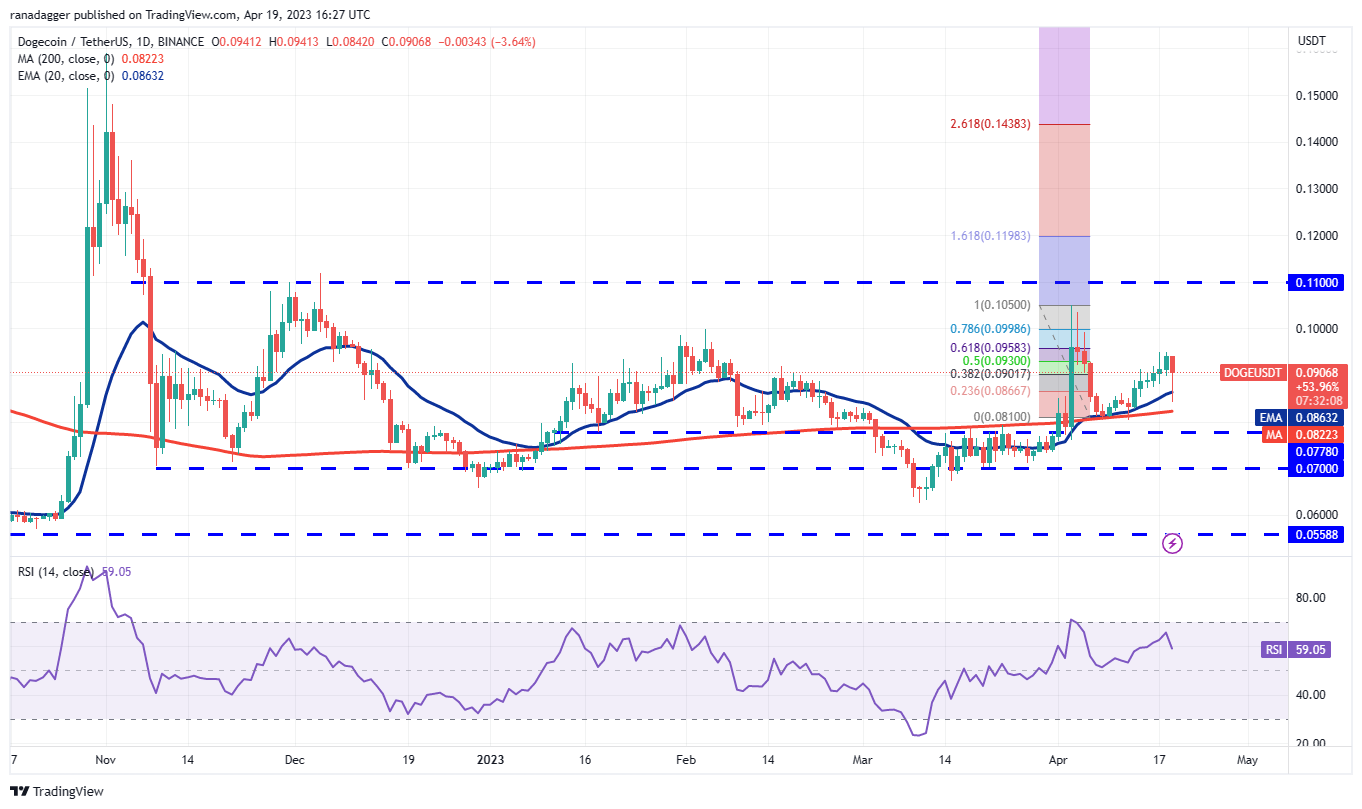 DOGE/USDT daily chart. Source: TradingView
The bears pushed the price below the 20-day EMA ($0.09), but they could not maintain the lower levels. The bulls bought the dip and initiated a recovery, as indicated by the long tail on the April 19 candlestick.
If buyers sustain the buying pressure and push the price above $0.10, the DOGE/USDT pair could reach the significant resistance at $0.11. Conversely, a break below the 200-day SMA ($0.08) may keep the pair trading within a range between $0.11 and $0.07 for a period.
Polygon price analysis
After trading near the resistance line of the symmetrical triangle pattern for several days, Polygon (MATIC) declined and reached the support line.
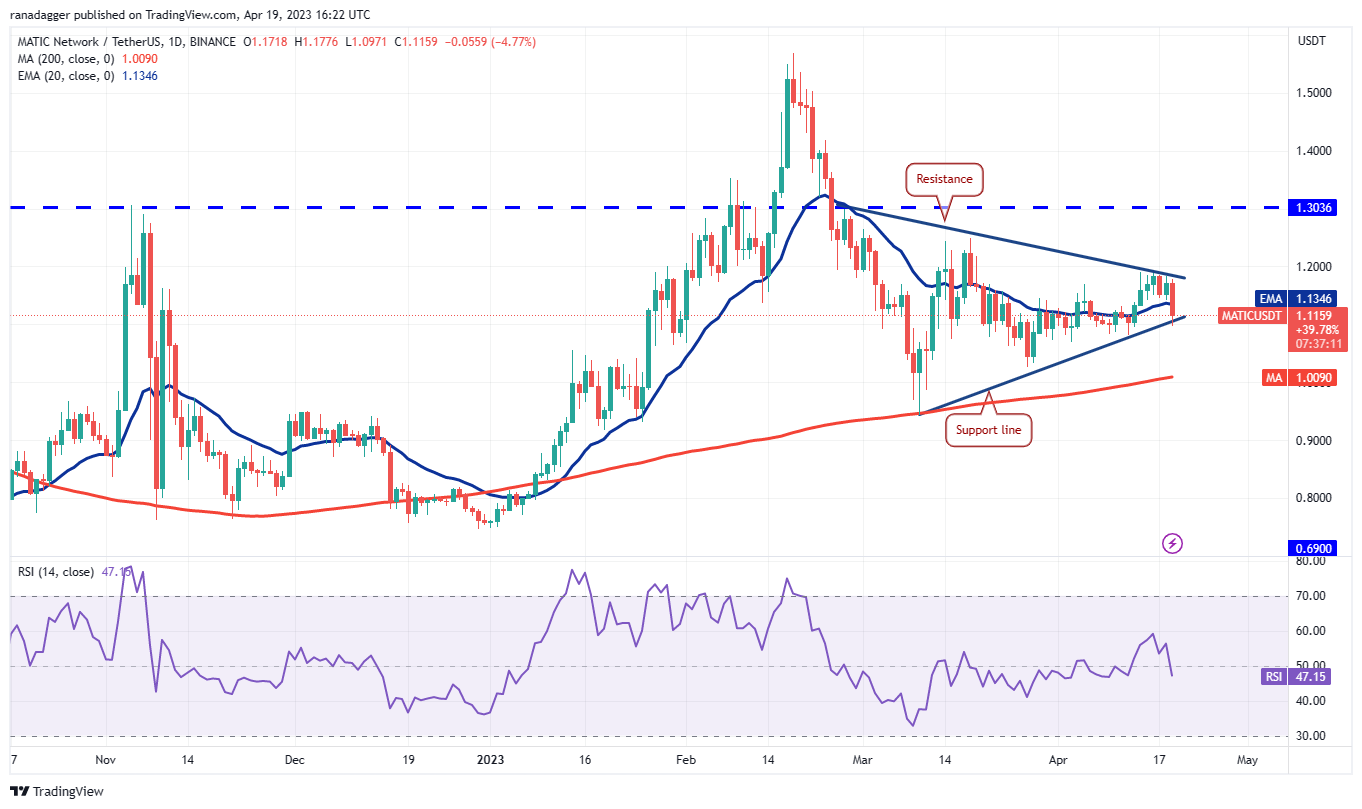 MATIC/USDT daily chart. Source: TradingView
The flattening 20-day EMA ($1.13) and the RSI below 50 suggest that the bulls may be losing their hold. If the price breaks below the support line, it will shift the short-term advantage to the bears. The MATIC/USDT pair may then drop to the 200-day SMA ($1), where buyers are likely to mount a strong defense.
The first indication of strength will be a break and close above the resistance line, which could open the way for a potential rally to $1.30.
Related: Can Bitcoin reclaim $30K? Watch these BTC price levels next
Solana price analysis
The inability of the bulls to push Solana (SOL) above the $27.12 resistance may have prompted short-term bulls to take profits.
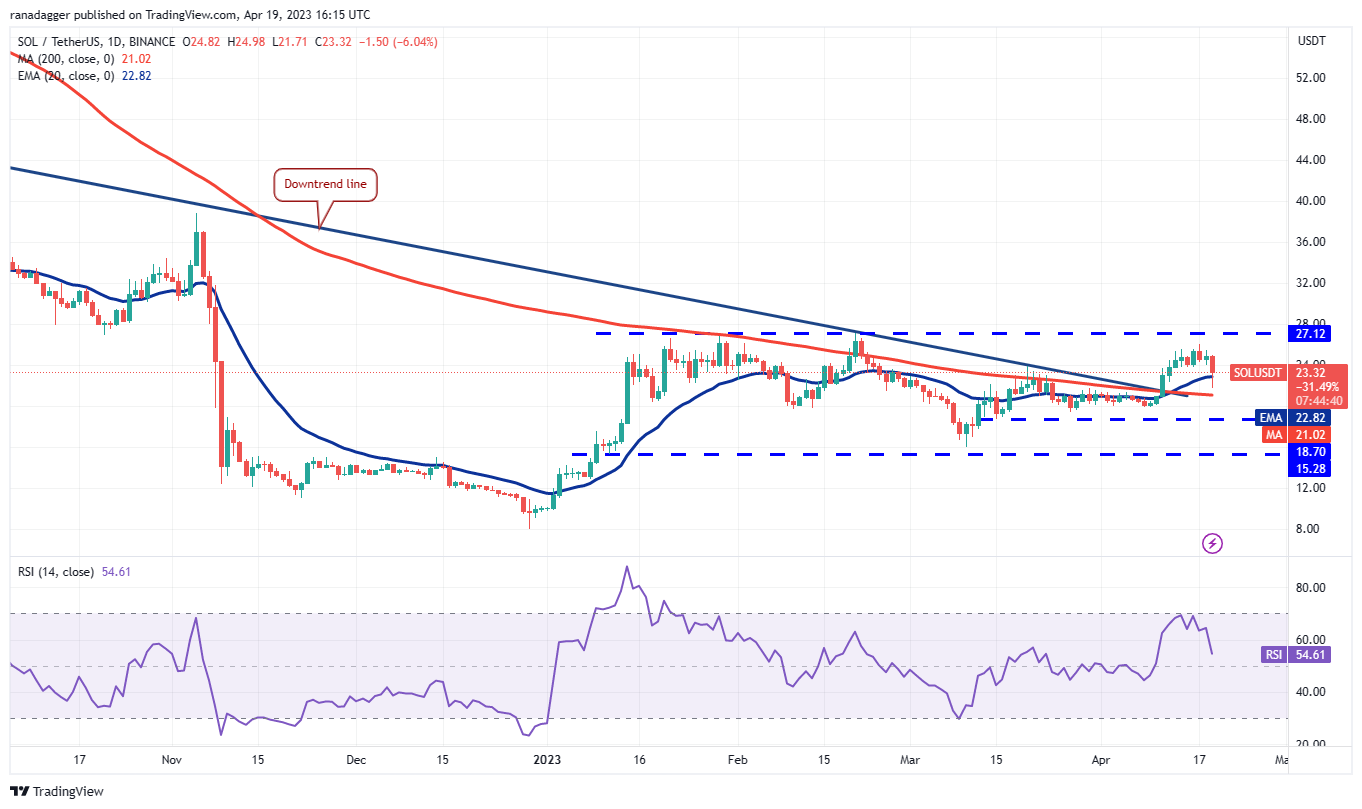 SOL/USDT daily chart. Source: TradingView
The SOL/USDT pair fell below the 20-day EMA ($22.82) on April 19, but the long tail on the candlestick indicates that the bulls are attempting to defend the level. If the price rebounds from the current level, buyers will again try to push the pair above $27.12 and begin the ascent toward $39.
Conversely, if the price breaks below the 200-day SMA ($21.02), it will indicate that the pair may consolidate between $27.12 and $15.28 for a few days.
Polkadot price analysis
Polkadot (DOT) bounced off the 20-day EMA ($6.49) on April 18, but the bears continued to defend the 61.8% Fibonacci retracement level of $6.85.
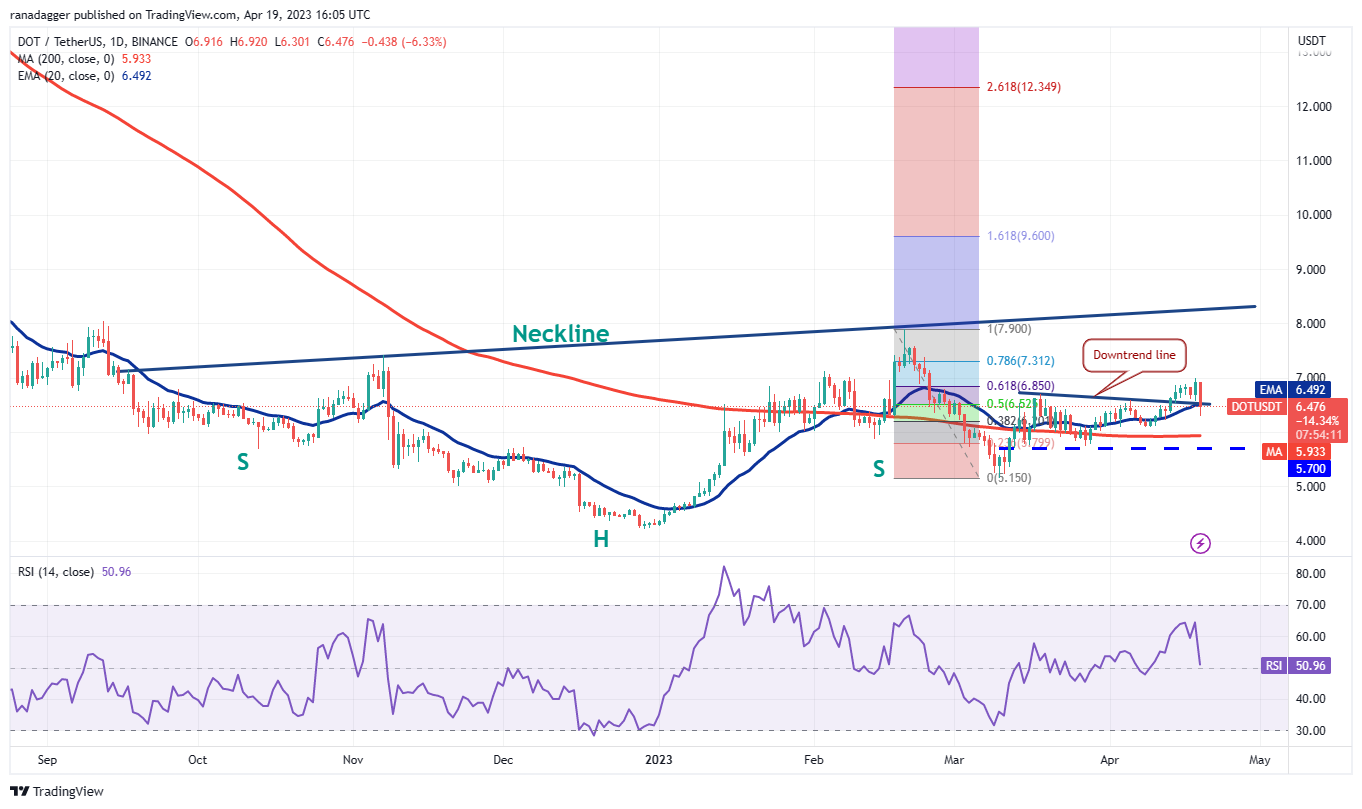 DOT/USDT daily chart. Source: TradingView
Strong selling from the bears pulled the price below the 20-day EMA on April 19, but the bulls are attempting to protect the uptrend line. If the price rebounds from the uptrend line, buyers will again try to continue the upward movement and drive the DOT/USDT pair to the neckline of the inverse H&S pattern.
Conversely, if the uptrend line fails, the bears will aim to push the pair down to $5.70. This is a critical level to watch, as a drop below it could lead to a decline to $5.15.
Litecoin price analysis
Litecoin (LTC) rose above the immediate resistance of $96 on April 14 and reached $103 on April 18, but the bulls were unable to maintain those higher levels.
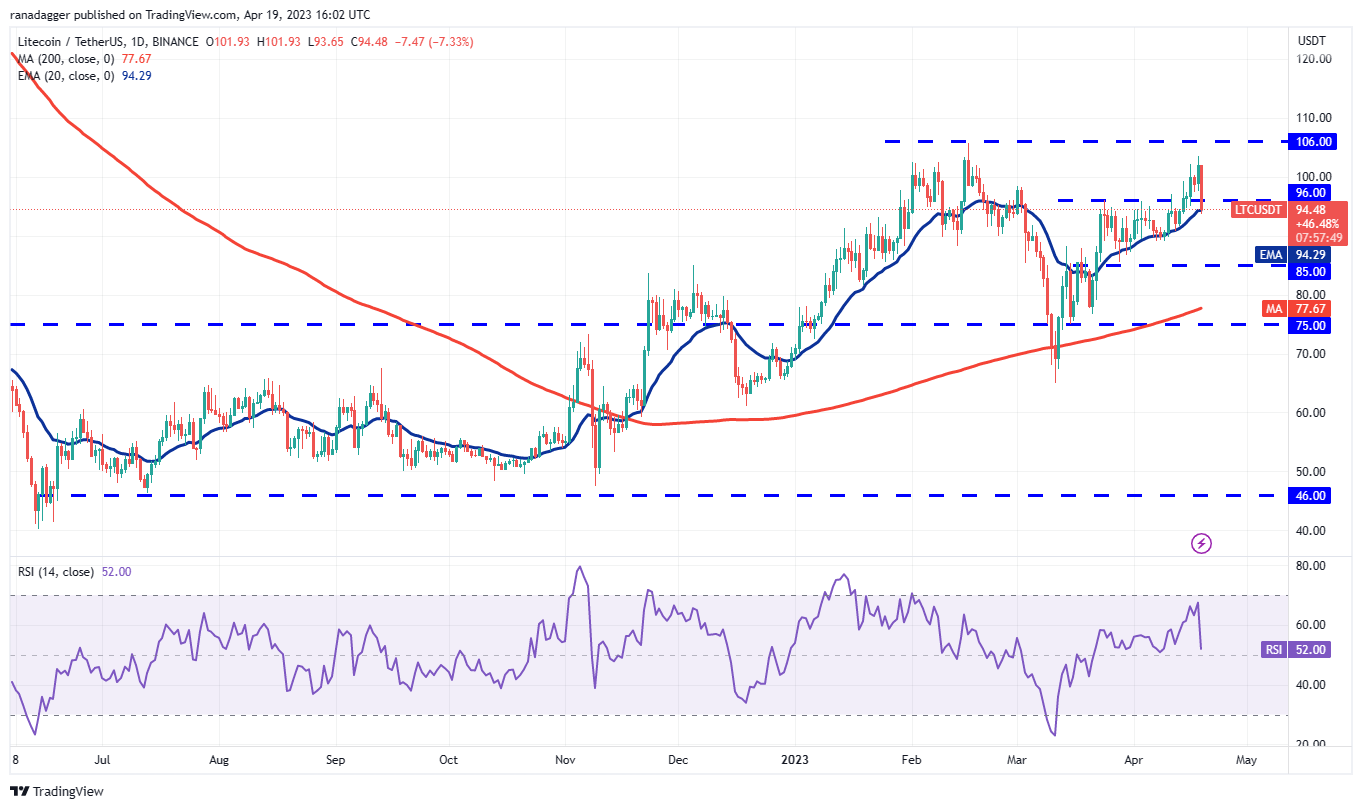 LTC/USDT daily chart. Source: TradingView
Intense profit-taking by the bears pulled the price back below the support at $96, indicating that the bulls may be rushing to exit. Selling could further accelerate if the price dips and remains below the 20-day EMA ($94). The LTC/USDT pair could then extend its decline to $85.
On the other hand, if the price rebounds from the current level, it will suggest that bulls are still accumulating at lower levels. The bulls will then attempt to push the price back to the significant overhead resistance at $106.
This article does not contain investment advice or recommendations. Every investment and trading move involves risk, and readers should conduct their own research when making a decision.
Cointelegraph does not endorse the content of this article nor any product mentioned herein. Readers should do their own research before taking any action related to any product or company mentioned and carry full responsibility for their decisions.