Disclaimer: Information found on CryptoreNews is those of writers quoted. It does not represent the opinions of CryptoreNews on whether to sell, buy or hold any investments. You are advised to conduct your own research before making any investment decisions. Use provided information at your own risk.
CryptoreNews covers fintech, blockchain and Bitcoin bringing you the latest crypto news and analyses on the future of money.
Bitcoin (BTC) continues to hover beneath the psychologically significant threshold of $30,000 as cryptocurrency traders seek positive catalysts. Nevertheless, this has not deterred business intelligence company MicroStrategy from acquiring an additional 1,045 Bitcoin, bringing its total holdings to 140,000 Bitcoin.
Despite the notable rebound from the low in November 2022, monitoring resource Material Indicators posits that the current upward movement is merely a bear market rally.
Typically, a bear market rally does not reverse until the last bear has capitulated. This implies that Bitcoin’s recovery might have further momentum before it declines to eliminate the weaker participants.
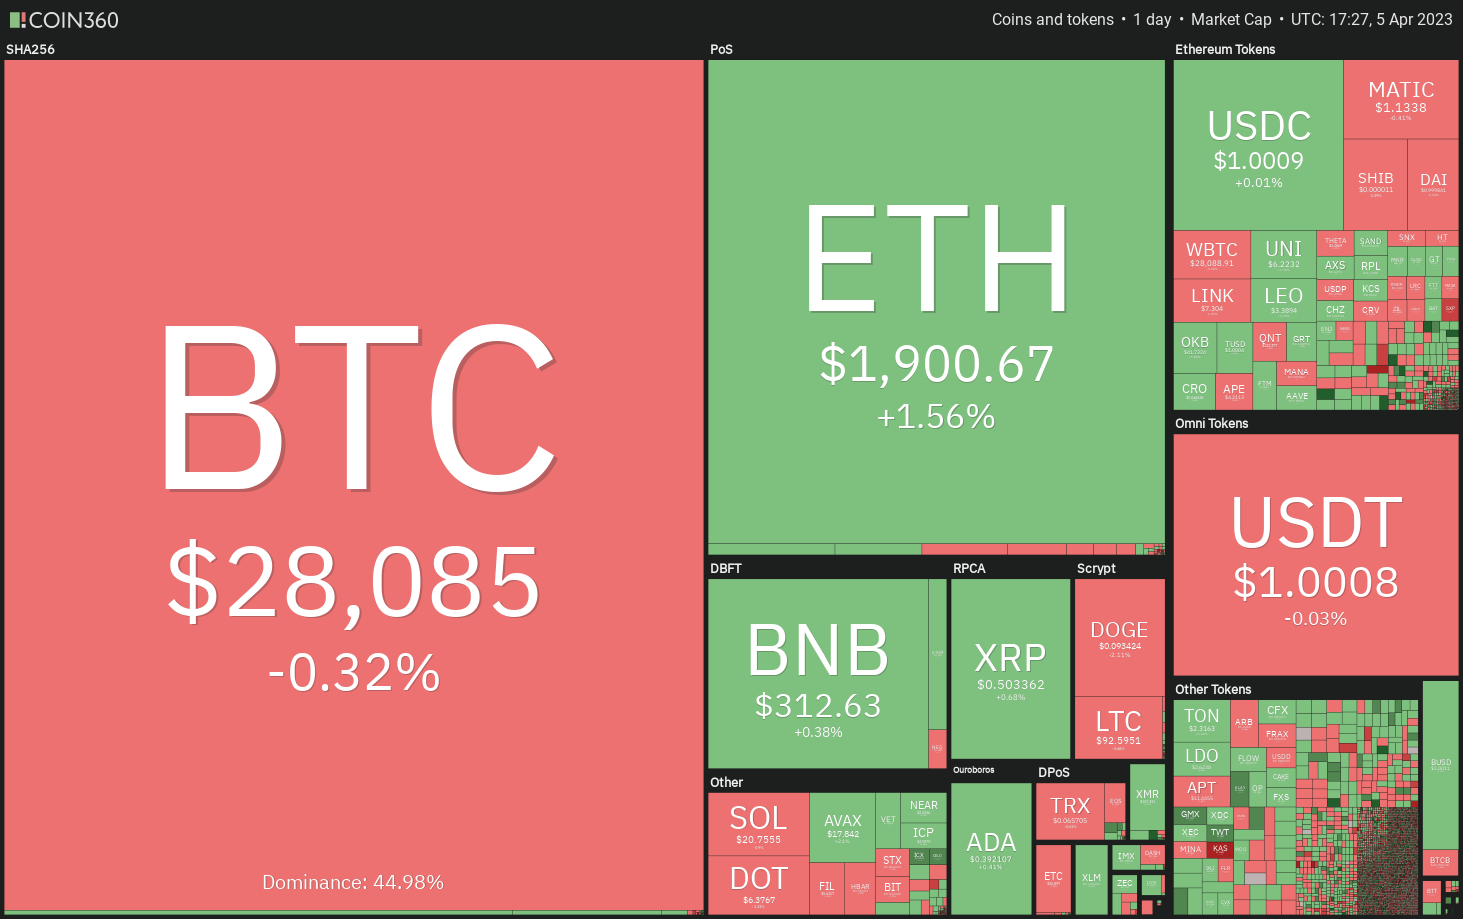 Daily cryptocurrency market performance. Source: Coin360
A survey by financial services firm Brown Brothers Harriman indicates that institutional investors remain engaged in the cryptocurrency sector despite the ongoing crypto winter. The survey revealed that 74% of institutional investors expressed “extremely/very interested” in increasing their exposure to exchange-traded funds linked to cryptocurrencies.
Will Bitcoin persist in its upward trajectory and surpass $30,000? Will such a movement elevate altcoins as well? Let’s analyze the charts of the top-10 cryptocurrencies to uncover the answers.
Bitcoin price analysis
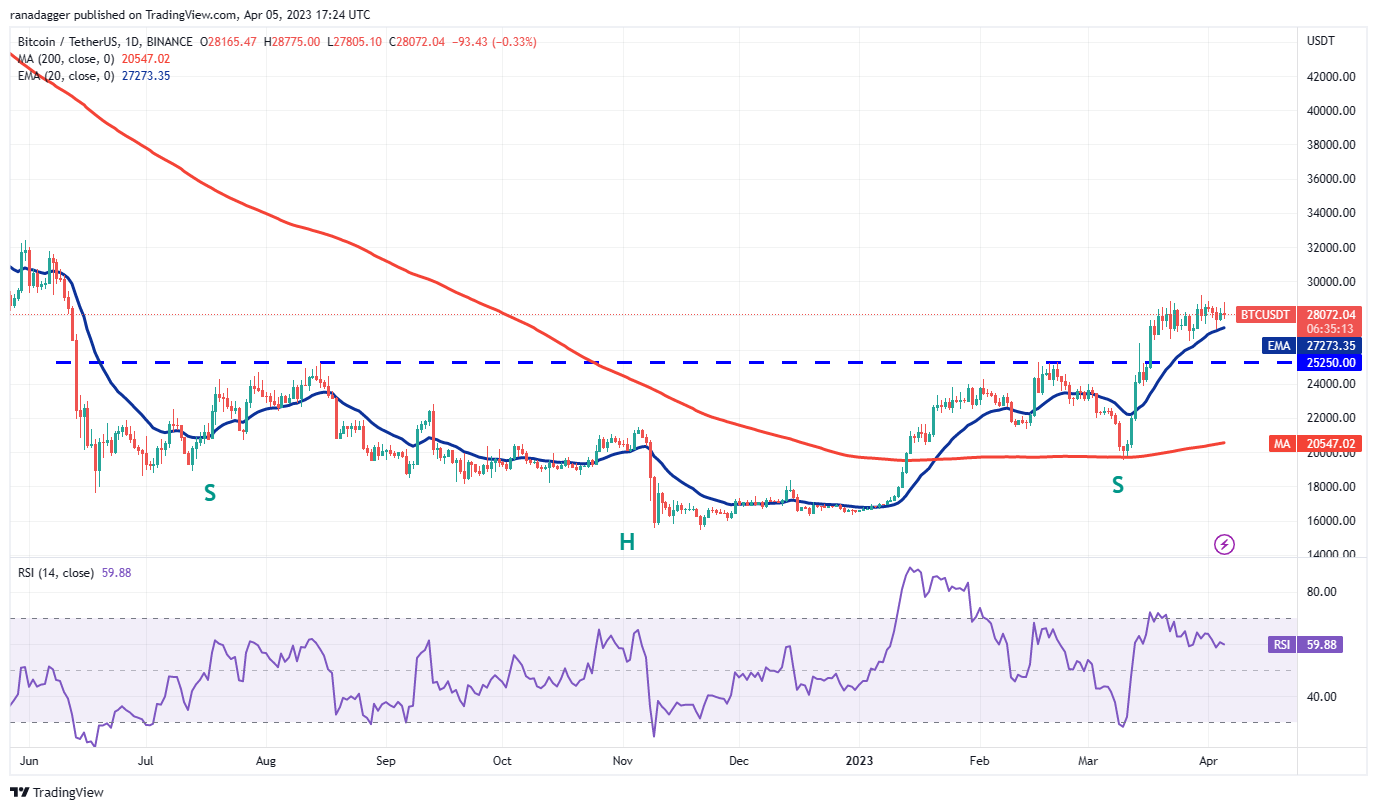
The bulls made another attempt to push Bitcoin above $29,000 on April 5, but the long wick on the candlestick indicates significant selling pressure from the bears at elevated levels.
 BTC/USDT daily chart. Source: TradingView
The bears will aim to capitalize on their advantage by driving the price below the 20-day exponential moving average ($27,273), which is a critical level to monitor. Should this support fail, numerous short-term bulls may exit their positions, potentially leading to a retest of the neckline of the inverse head and shoulders (H&S) pattern at $25,250.
On the other hand, if the price bounces off the 20-day EMA, it will indicate that bulls are vigorously defending this level. This could improve the chances of breaking through the overhead resistance at $29,185. If this occurs, the BTC/USDT pair may rise to $30,000 and subsequently to $32,500.
Ether price analysis
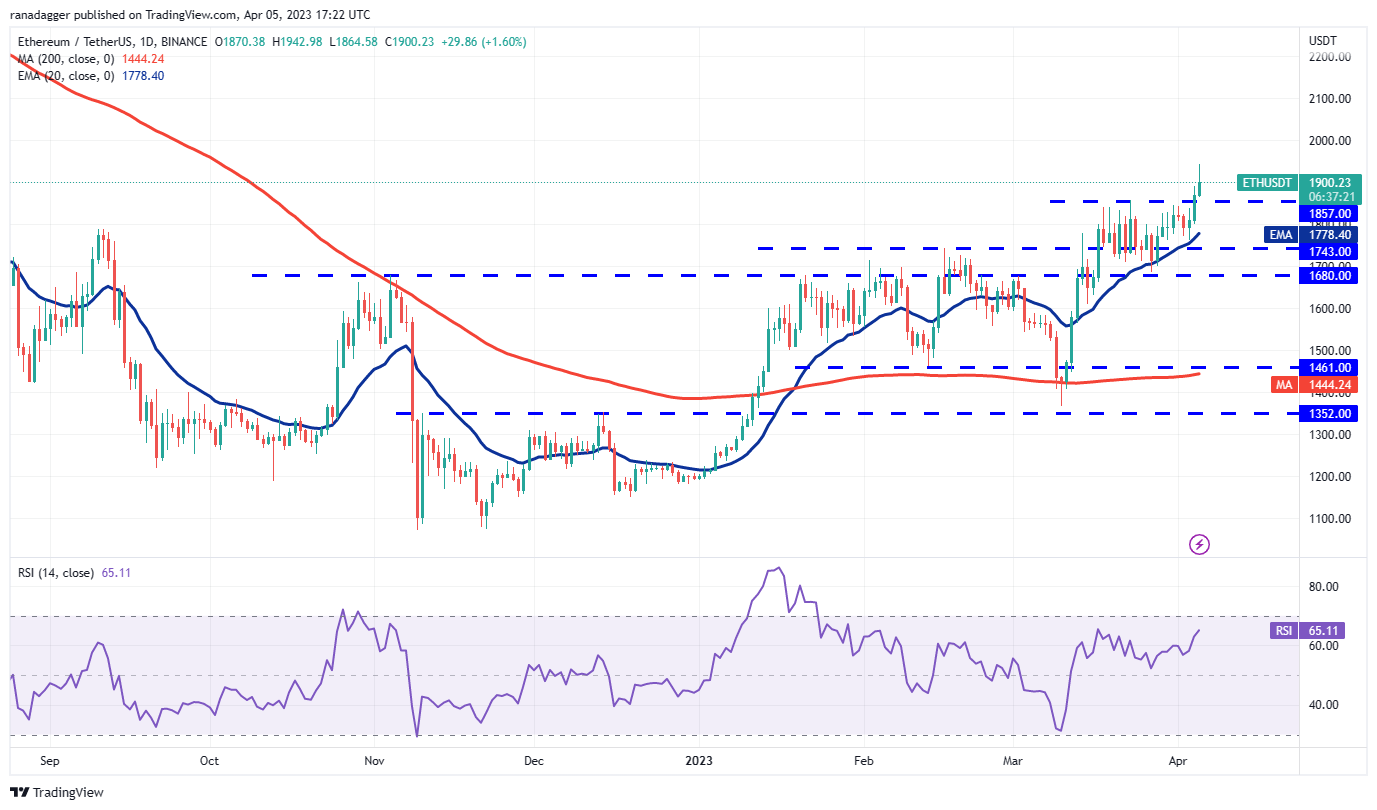
Ether (ETH) rebounded from the 20-day EMA ($1,778) on April 3 and surpassed the overhead resistance at $1,857. This indicates the commencement of the next phase of the upward movement.
 ETH/USDT daily chart. Source: TradingView
The path appears clear for a potential rally to $2,000. This level is expected to serve as a strong resistance, but if bulls manage to convert the $1,857 level into support during the next decline, it will suggest that buyers are in control. The ETH/USDT pair could then aim for a rally to $2,200.
The bears are running out of time. If they intend to mount a comeback, they must halt the rally and pull the price below $1,857. If they succeed, aggressive bulls may find themselves trapped. The pair could initially drop to the 20-day EMA and then to $1,680.
BNB price analysis
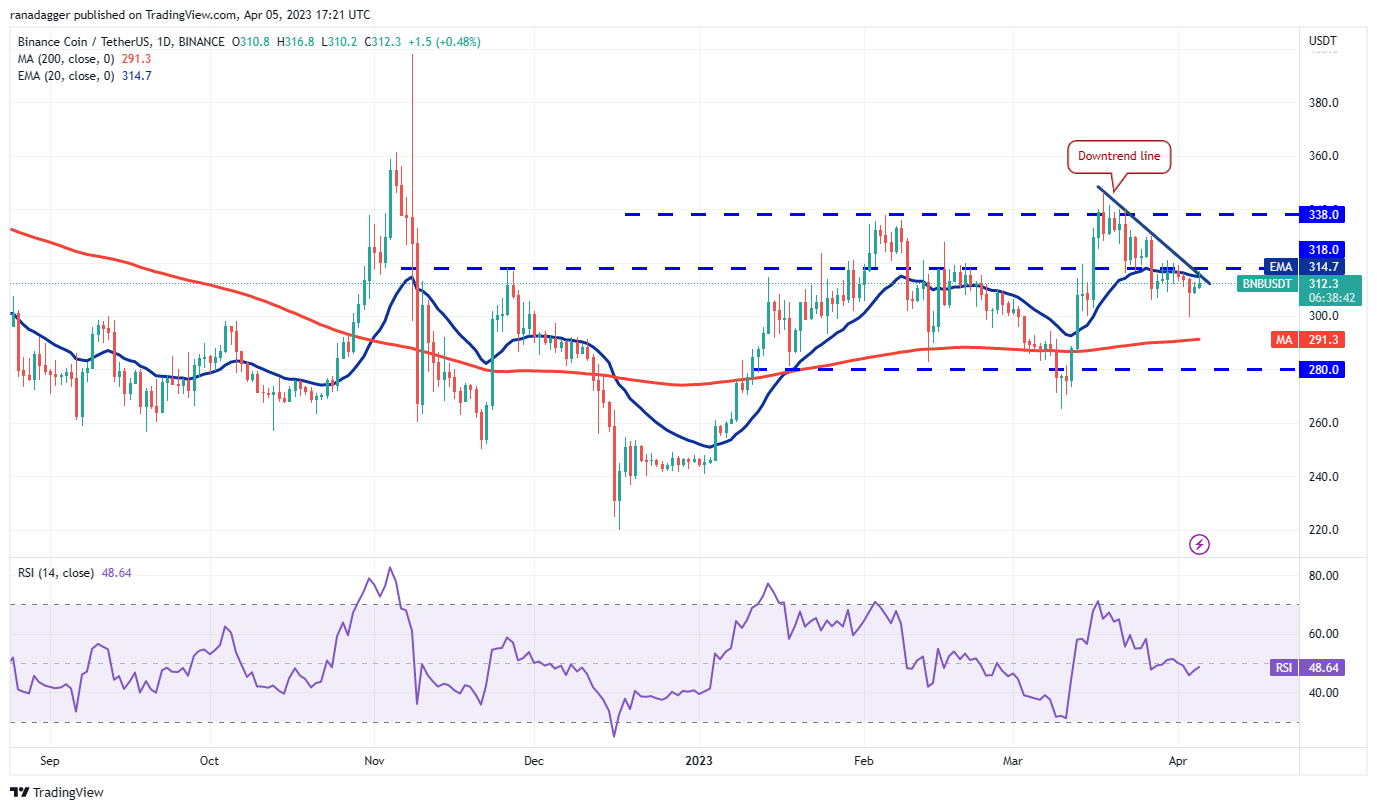
BNB’s (BNB) decline below the $306 support was met with strong buying from the bulls, as evidenced by the long tail on the April 3 candlestick.
 BNB/USDT daily chart. Source: TradingView
The bulls are attempting to further solidify their position by pushing the price above the overhead resistance of $318. If they succeed, it will indicate that the corrective phase may have concluded. The BNB/USDT pair could first rise to $330 and then to the significant resistance at $338.
<pConversely, if the price fails to surpass the barrier at $318, it will suggest that the bears are utilizing every minor rally to sell. This may pull the pair down to the 200-day SMA ($291), which is likely to serve as strong support.
XRP price analysis
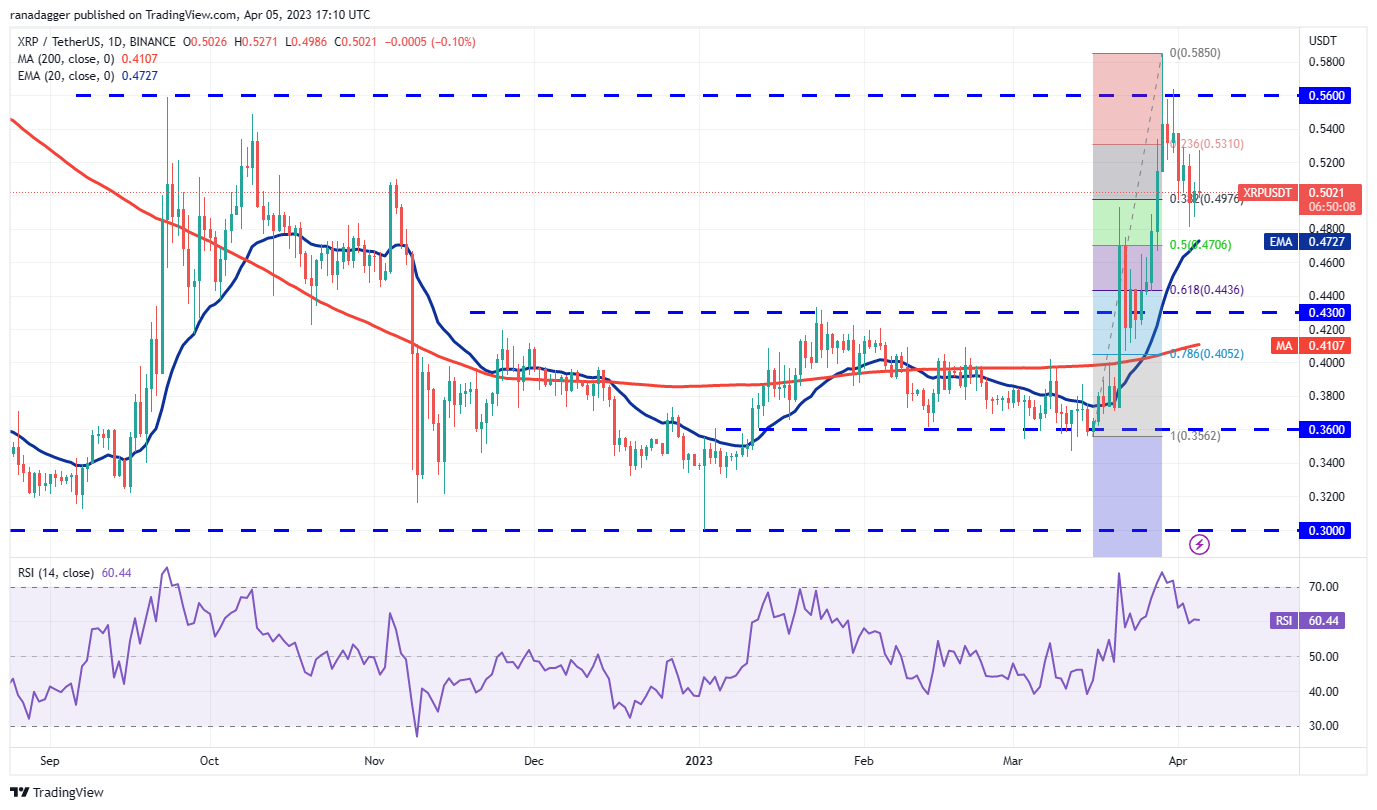
XRP (XRP) fell below the 38.2% Fibonacci retracement level of $0.49 on April 3, but the long tail on the candlestick indicates robust buying at lower levels.
 XRP/USDT daily chart. Source: TradingView
The price increased on April 4, and the bulls attempted to push it toward the overhead resistance at $0.56, but the long wick on the April 5 candlestick shows that sellers are presenting a strong challenge to the bulls near $0.53.
If the price continues to decline, the bears will again attempt to drive it below the 20-day EMA ($0.47). If this level fails, the XRP/USDT pair may drop to $0.43.
Conversely, if buyers manage to push the price above the $0.56-to-$0.58 overhead zone, the pair may surge to $0.65 and then to $0.80.
Cardano price analysis
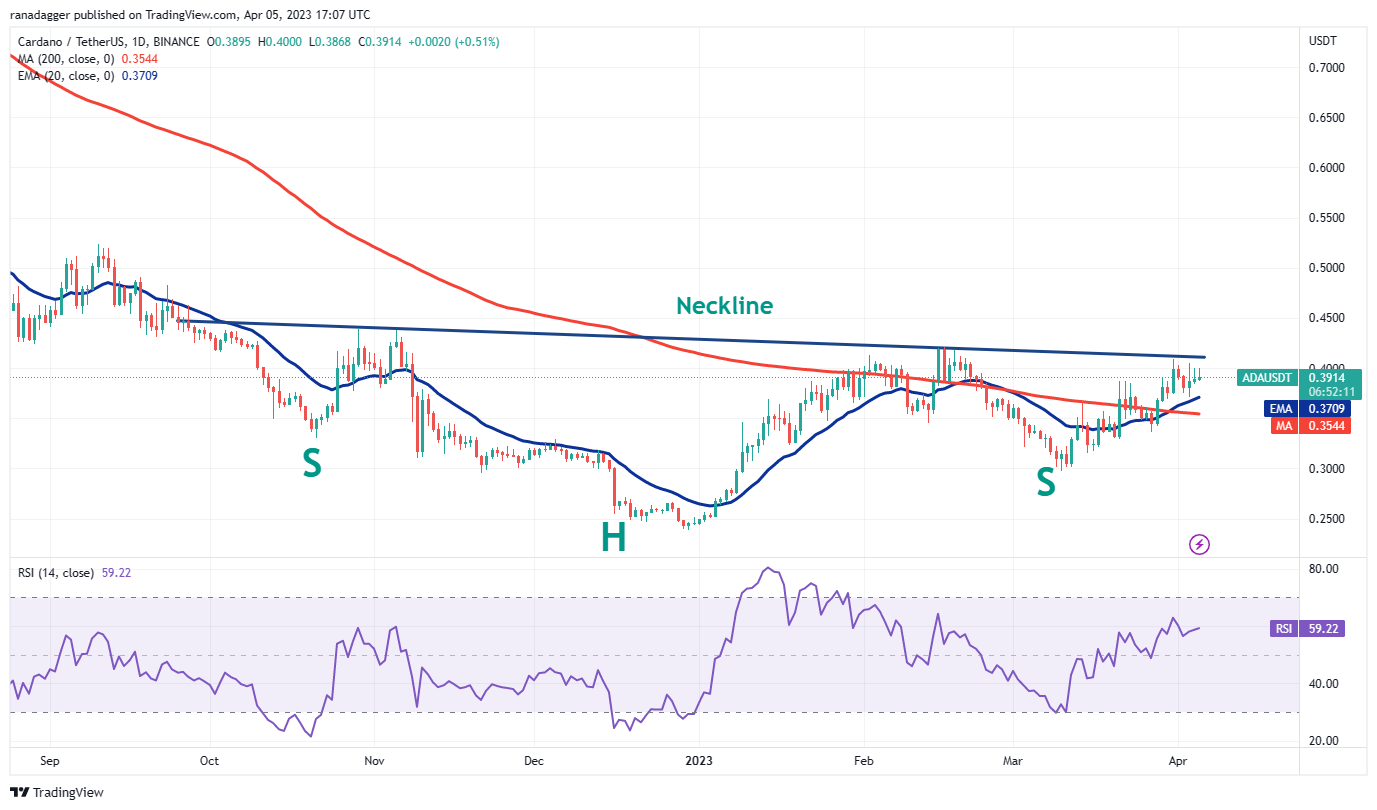
Cardano’s (ADA) price is being squeezed between the 20-day EMA ($0.37) and the neckline of the inverse H&S pattern.
 ADA/USDT daily chart. Source: TradingView
Related Posts
The upward-sloping 20-day EMA and the RSI above 59 indicate that bulls are in control. A breakout and close above the neckline will complete the reversal pattern. The ADA/USDT pair could then initiate a new uptrend with a pattern target of $0.60.
If bears wish to take control, they must pull the price back below the moving averages. If they accomplish this, several short-term bulls may close their positions, leading to a long liquidation. The pair may then decline to $0.30.
Dogecoin price analysis
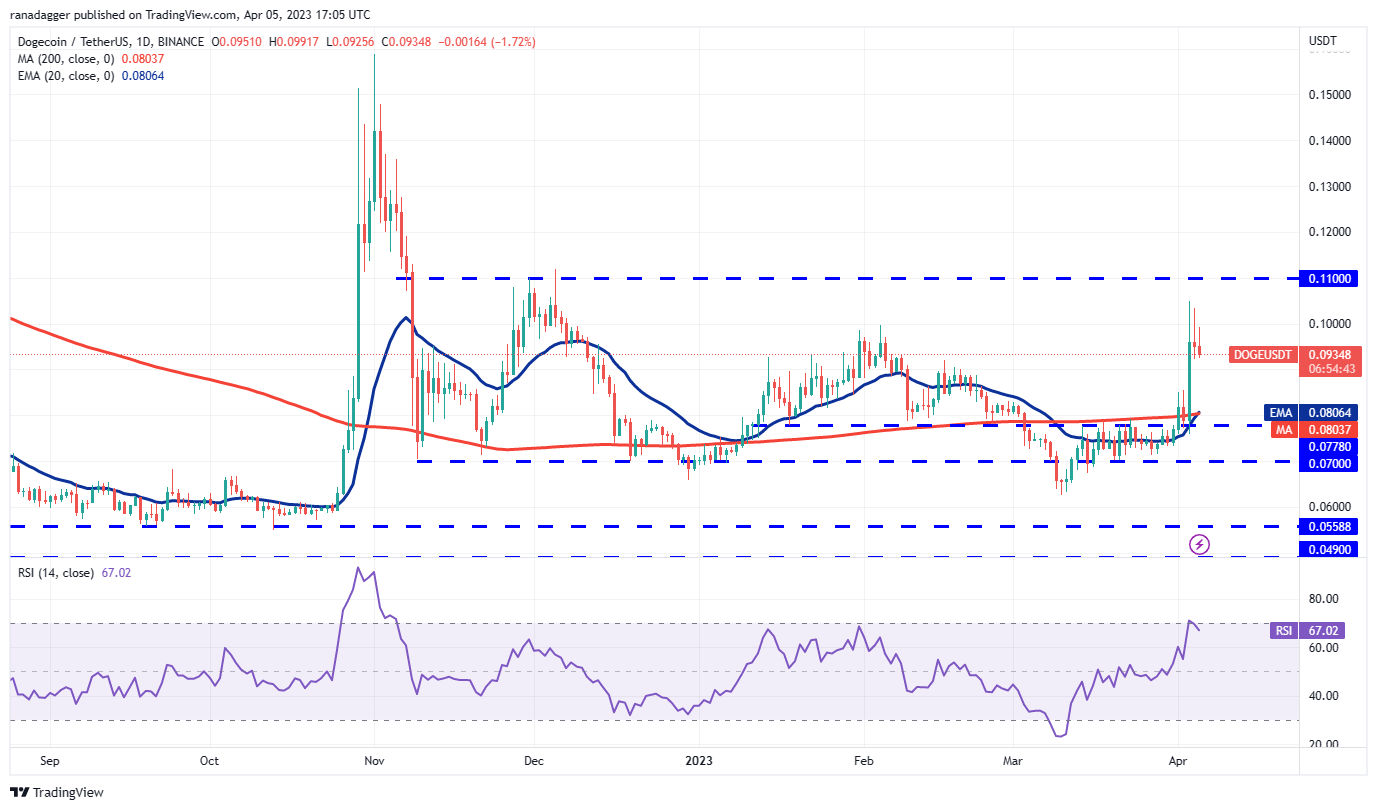
Dogecoin (DOGE) rebounded from the 20-day EMA ($0.08) on April 3 and surged above the strong resistance at $0.10.
 DOGE/USDT daily chart. Source: TradingView
The long wick on the April 3 and 4 candlestick indicates that the bears are vigorously defending the $0.10 level. A slight positive for the buyers is that they have not relinquished ground to the bears.
If the price remains above $0.09, the likelihood of a rally to $0.11 increases. This is the final significant barrier for the bulls, as a breakthrough could pave the way for a potential rally to $0.16.
Alternatively, if the price declines from $0.11, it will suggest that the bears are active at higher levels. The DOGE/USDT pair may then fluctuate within a broad range between $0.11 and $0.07 for an extended period.
Polygon price analysis
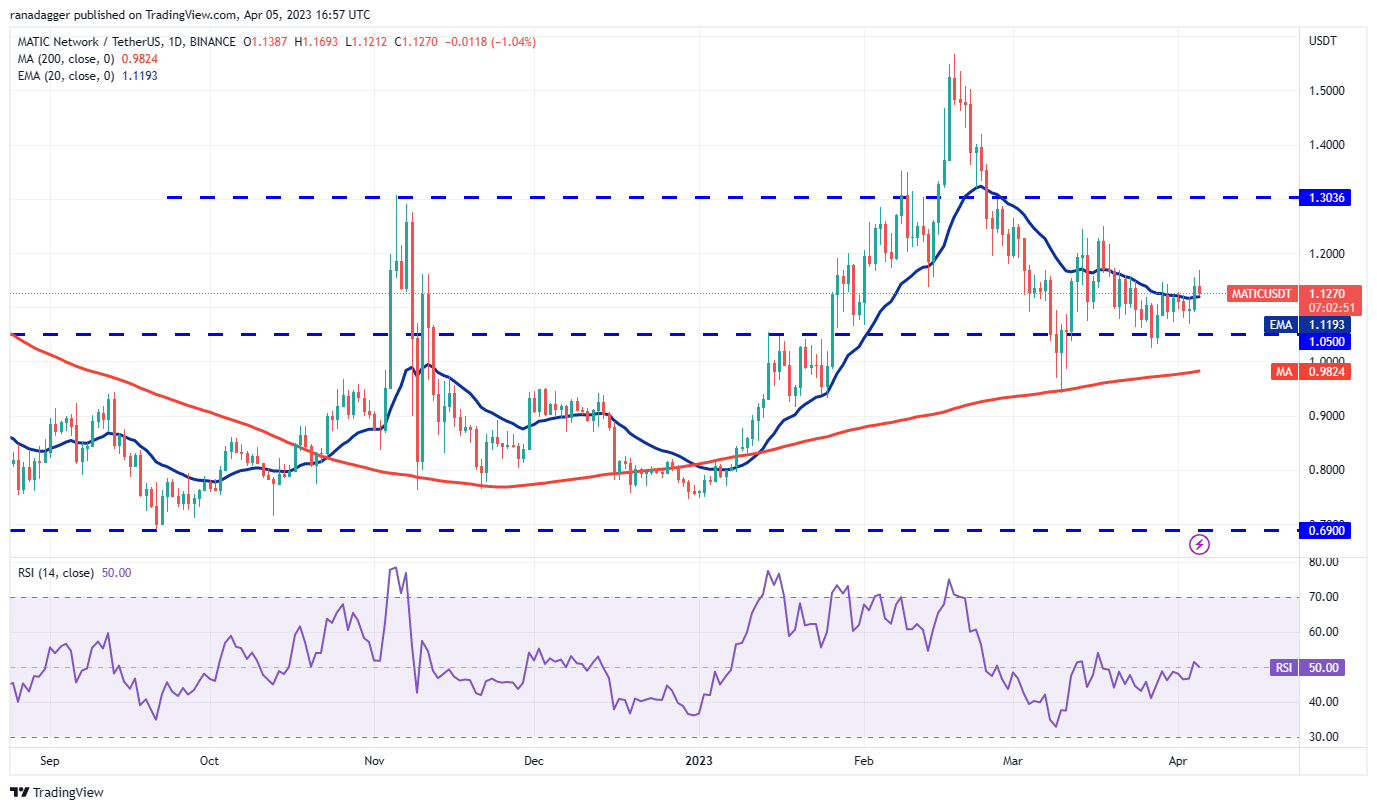
Polygon’s (MATIC) tight consolidation near the 20-day EMA ($1.11) resolved positively on April 4, but the bulls are struggling to capitalize on this advantage.
 MATIC/USDT daily chart. Source: TradingView
The bears will attempt to pull the price back below the 20-day EMA and trap the aggressive bulls. If they succeed, the MATIC/USDT pair could decline to $1.05 and then to the critical support at the 200-day SMA ($0.98).
Conversely, if the price rebounds off the 20-day EMA, it will indicate that the bulls are trying to convert this level into support. There is minor resistance at $1.17, but if bulls overcome this hurdle, the MATIC/USDT pair could rise to $1.25 and then to $1.30.
Related: Latest Bitcoin price data suggests double top above $200K in 2025
Solana price analysis
Solana (SOL) continues to trade within a narrow range. Typically, periods of low volatility precede an increase in volatility.
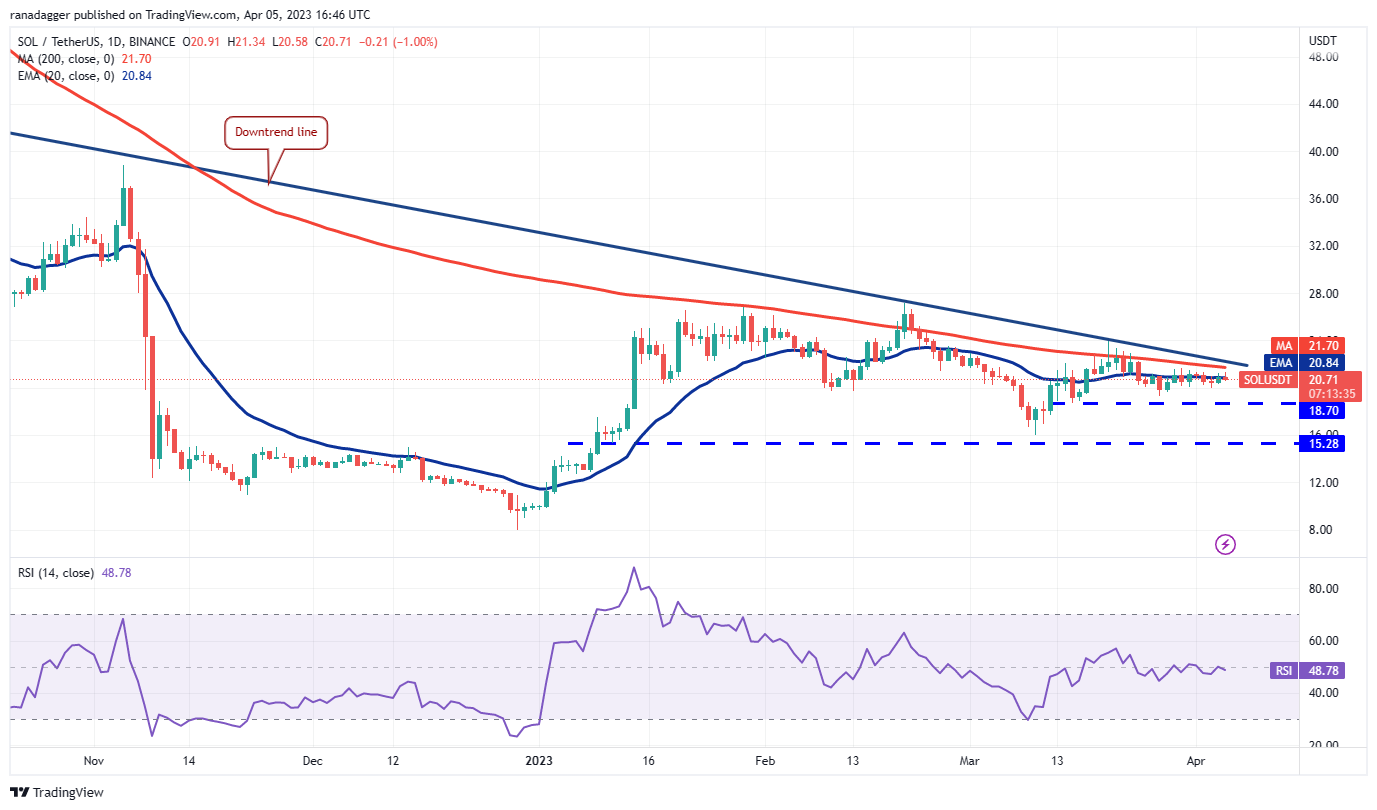 SOL/USDT daily chart. Source: TradingView
If the price breaks and closes above the downtrend line, it will indicate that the bulls have gained the upper hand over the bears. This could initiate a new upward movement, potentially first reaching $27.12. If this level is surpassed, the SOL/USDT pair is likely to gain momentum and surge toward $39.
Alternatively, if the price declines from the downtrend line or fails to maintain above it, the bears will attempt to push the price below $18.70 and challenge the critical support around $15.28.
Polkadot price analysis
Polkadot (DOT) has continued to rise toward the 61.8% Fibonacci retracement level of $6.85. This level may encounter significant selling pressure from the bears.
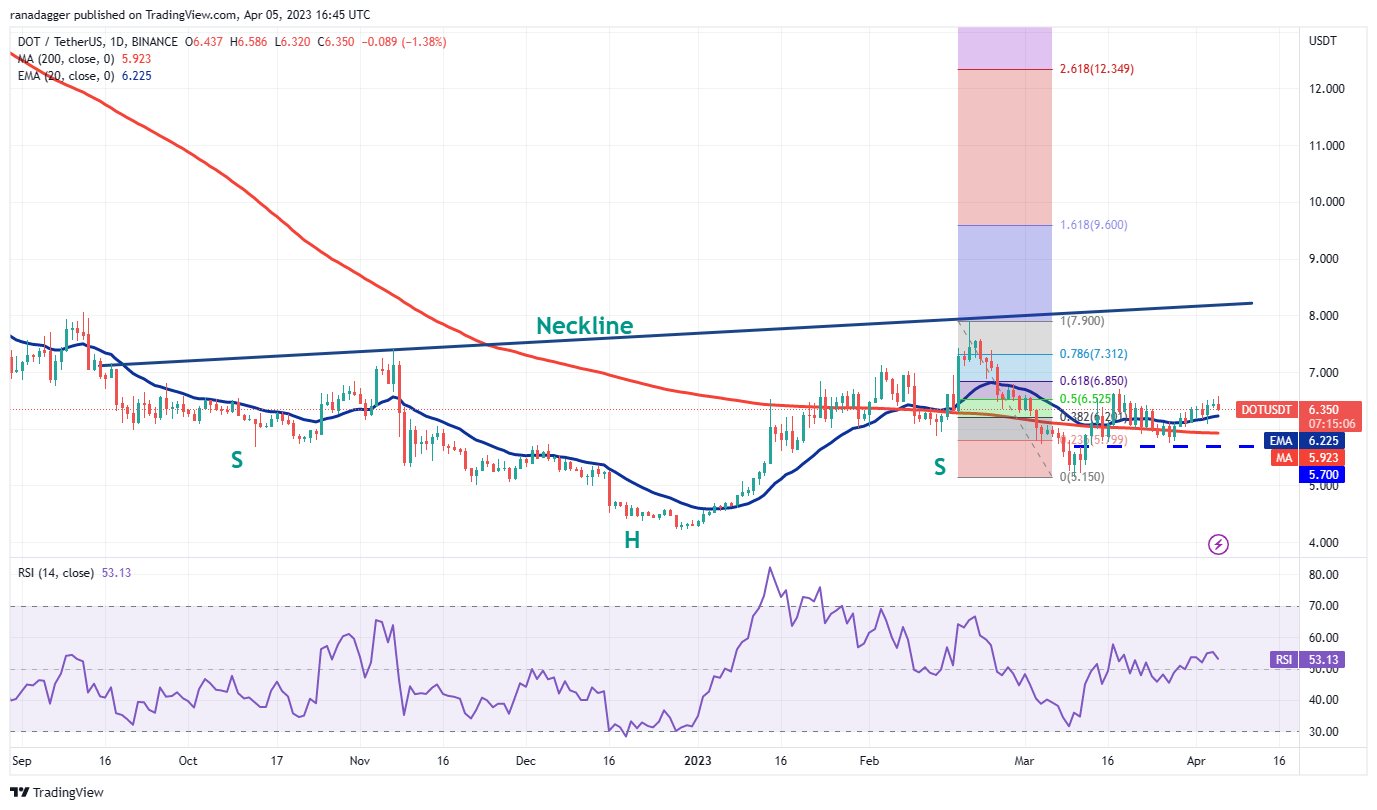 DOT/USDT daily chart. Source: TradingView
The 20-day EMA ($6.22) remains a crucial level to observe. If the price declines from $6.85 but rebounds from the 20-day EMA, it will suggest that sentiment has turned positive and traders are buying the dips.
This will enhance the likelihood of a breakout above $6.85. The DOT/USDT pair may then attempt a rally to the neckline of the inverse H&S pattern. Sellers will need to push the price below $5.70 to gain the upper hand.
Litecoin price analysis
Litecoin (LTC) rebounded from the 20-day EMA ($89) on April 1 and rose above the downtrend line. However, the bulls are encountering strong resistance from the bears at higher levels, as indicated by the long wick on the April 3 and April 5 candlesticks.
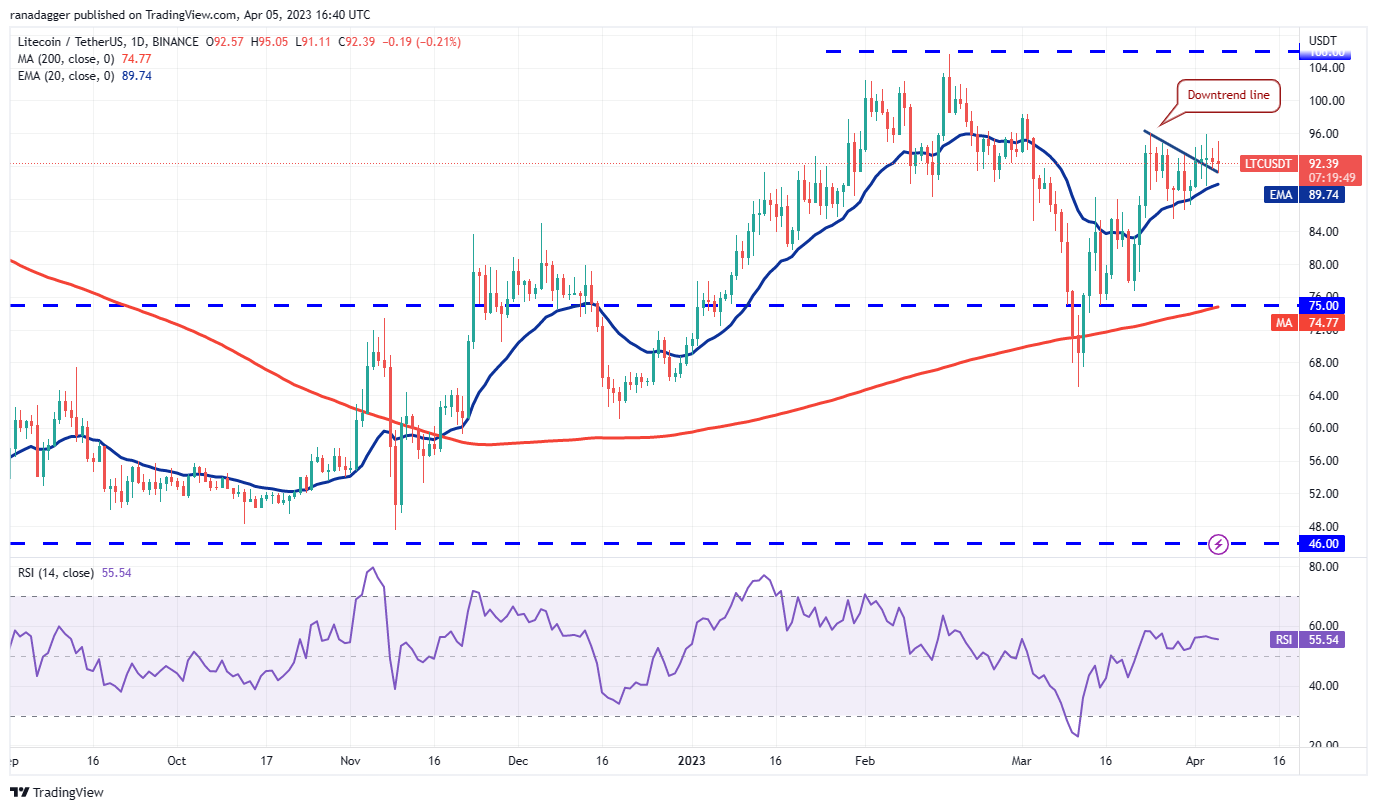 LTC/USDT daily chart. Source: TradingView
The rising 20-day EMA and the RSI in positive territory suggest an advantage for buyers. There is minor resistance at $96, but if this is surpassed, the LTC/USDT pair may ascend to the strong overhead resistance at $106.
If bears wish to thwart the upward movement, they must quickly pull the price back below the 20-day EMA. The pair could then fall to $85. This is a significant level to monitor, as a breach below it will indicate that the bears have regained control.
The views, thoughts and opinions expressed here are the authors’ alone and do not necessarily reflect or represent the views and opinions of Cointelegraph.
This article does not contain investment advice or recommendations. Every investment and trading move involves risk, and readers should conduct their own research when making a decision.