Disclaimer: Information found on CryptoreNews is those of writers quoted. It does not represent the opinions of CryptoreNews on whether to sell, buy or hold any investments. You are advised to conduct your own research before making any investment decisions. Use provided information at your own risk.
CryptoreNews covers fintech, blockchain and Bitcoin bringing you the latest crypto news and analyses on the future of money.
Only Bitcoin or broaden your portfolio? Five cryptocurrencies to monitor in the upcoming days.
Risky assets slightly continue their upward trend in April. The S&P 500 Index increased by approximately 1.5% during the month, while Bitcoin (BTC) is poised to finish with gains exceeding 4%. Will the upward momentum persist into May, or is a correction imminent?
The recovery may encounter challenges if the banking issues in the United States worsen. Bob Michele, chief investment officer at JPMorgan Asset Management, stated in a Bloomberg interview that the difficulties at First Republic Bank are unlikely to be confined to that institution and could trigger a chain reaction.
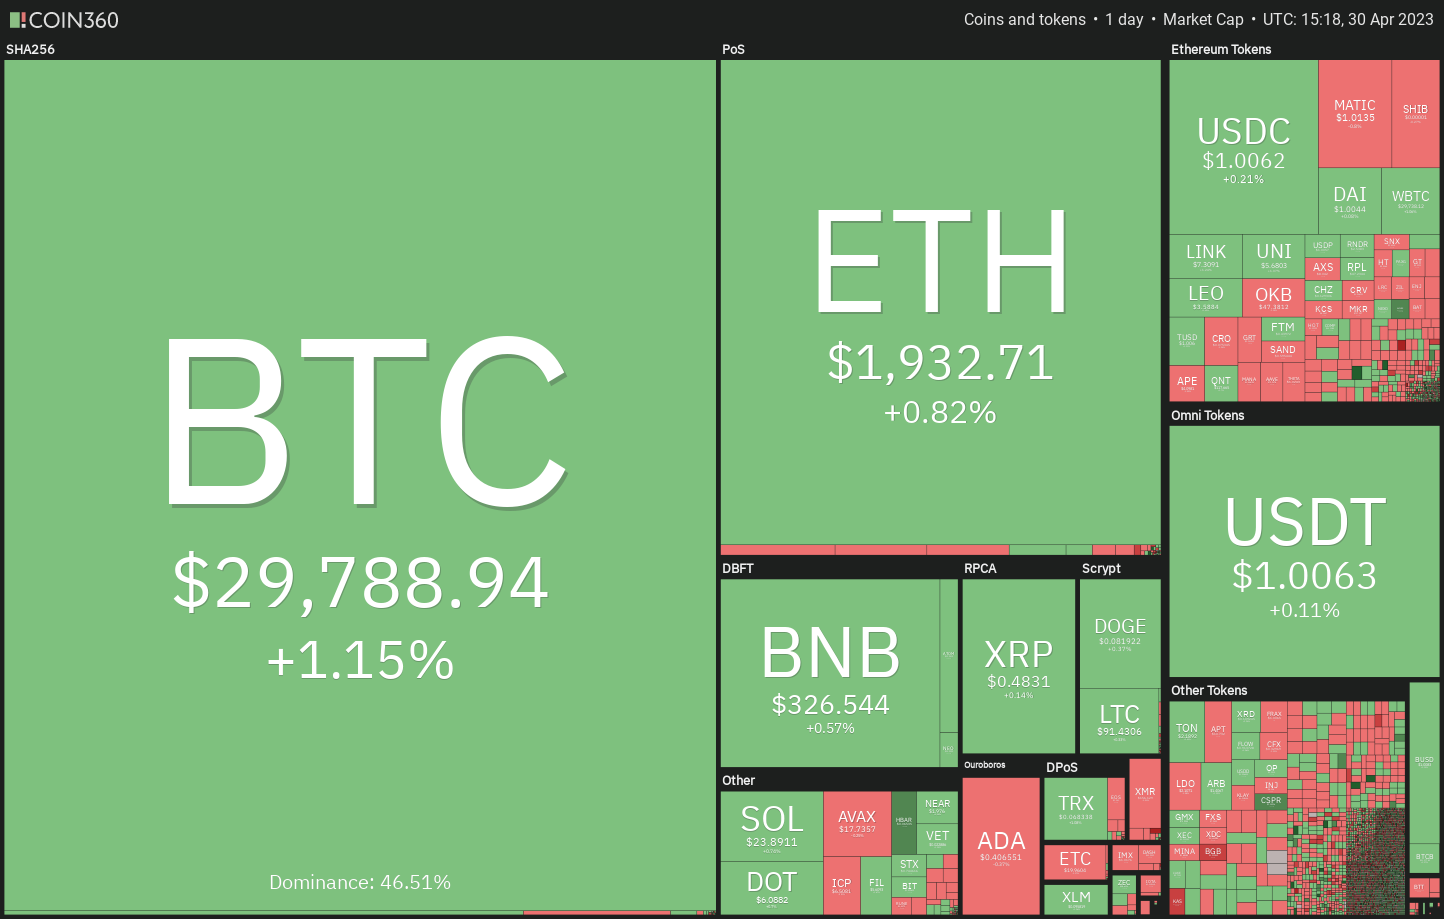 Crypto market data daily view. Source:Coin360
If this occurs, U.S. equity markets might experience a downturn. However, predicting Bitcoin’s response to such a crisis is challenging, as BTC’s price has risen even as traditional banking issues intensified in recent days. Should a significant disruption arise in the U.S. banking sector, Bitcoin may also face a correction eventually.
In the short term, Bitcoin and certain altcoins are demonstrating strength. Let’s analyze the charts of five cryptocurrencies that could outperform in the coming days.
Bitcoin price analysis
Following two days of low volatility in Bitcoin, the bulls are attempting to establish their dominance on April 30.
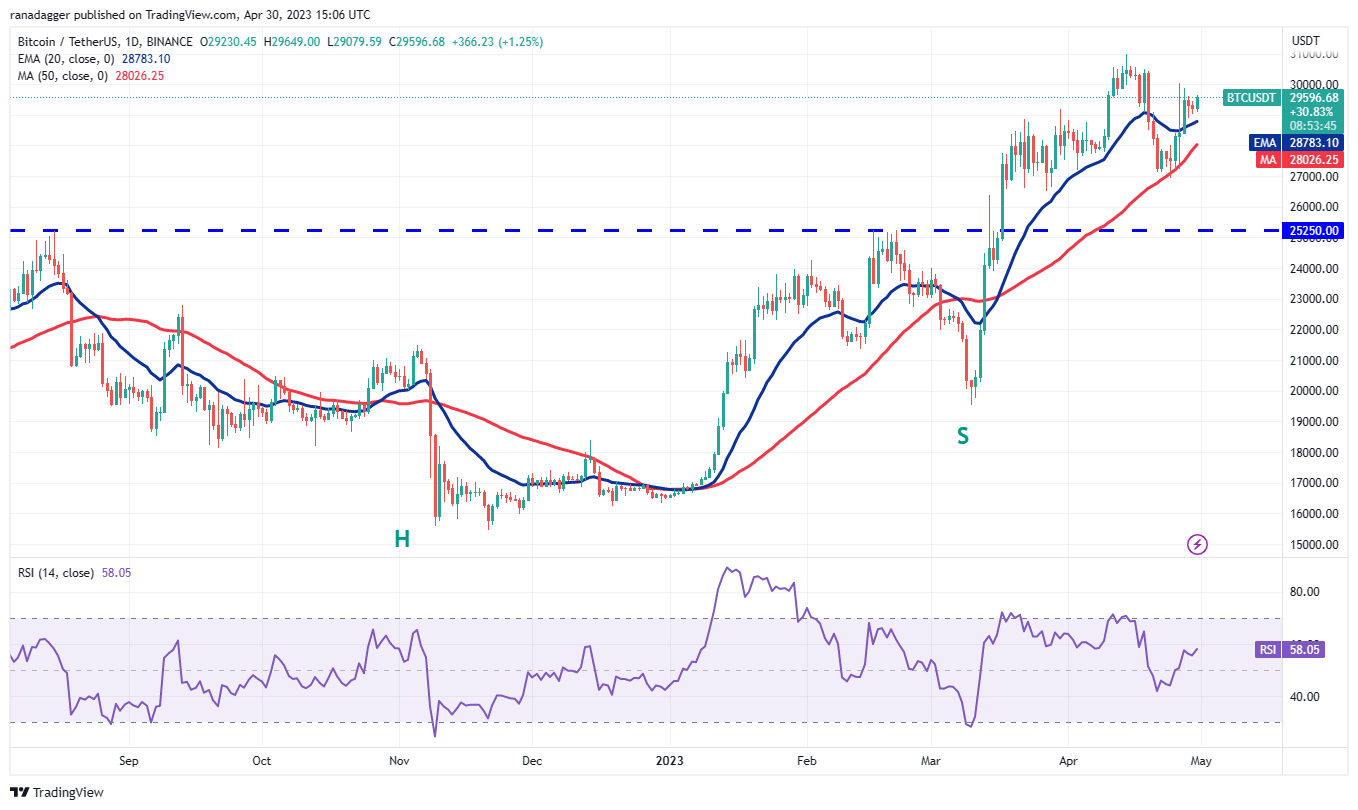 BTC/USDT daily chart. Source: TradingView
The 20-day exponential moving average ($28,783) has begun to rise gradually, and the relative strength index (RSI) is in the positive zone, suggesting that the path of least resistance is upward.
If the bulls manage to push Bitcoin’s price above $30,000, the BTC/USDT pair may ascend to the resistance zone between $31,000 and $32,400. Buyers may encounter significant resistance in this area, but if surpassed, the pair could surge toward $40,000.
The 50-day simple moving average ($28,026) is a crucial support level to monitor. If the BTC price falls below this threshold, bears may seize the opportunity to drive the pair down to $25,250.
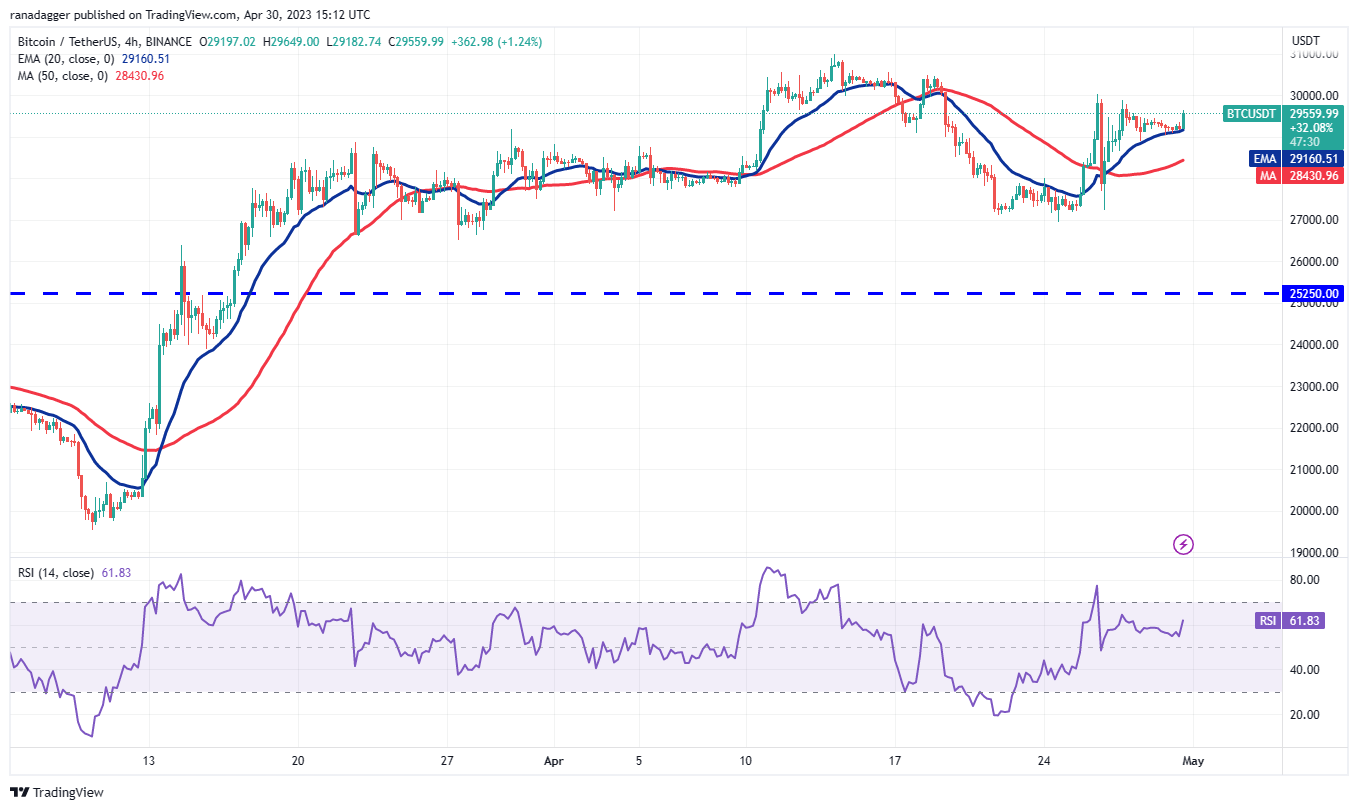 BTC/USDT 4-hour chart. Source: TradingView
The bears attempted to pull the pair below the 20-EMA, but the bulls maintained their position. This may have attracted additional buying, and the bulls will next aim to push the price above $30,000. If successful, Bitcoin could rise to $30,500 or even $31,000.
On the other hand, if the price declines and falls below the 20-EMA, it will indicate that bears are selling near resistance levels. The pair may then drop to the 50-SMA.
The bulls will strive to defend this level, but if bears gain the upper hand, the next target is likely to be $27,000. Buyers are expected to vigorously defend the range between $27,000 and $25,250.
Solana price analysis
The bulls successfully prevented Solana (SOL) from falling below the downtrend line during the latest phase of the correction, indicating demand at lower levels.
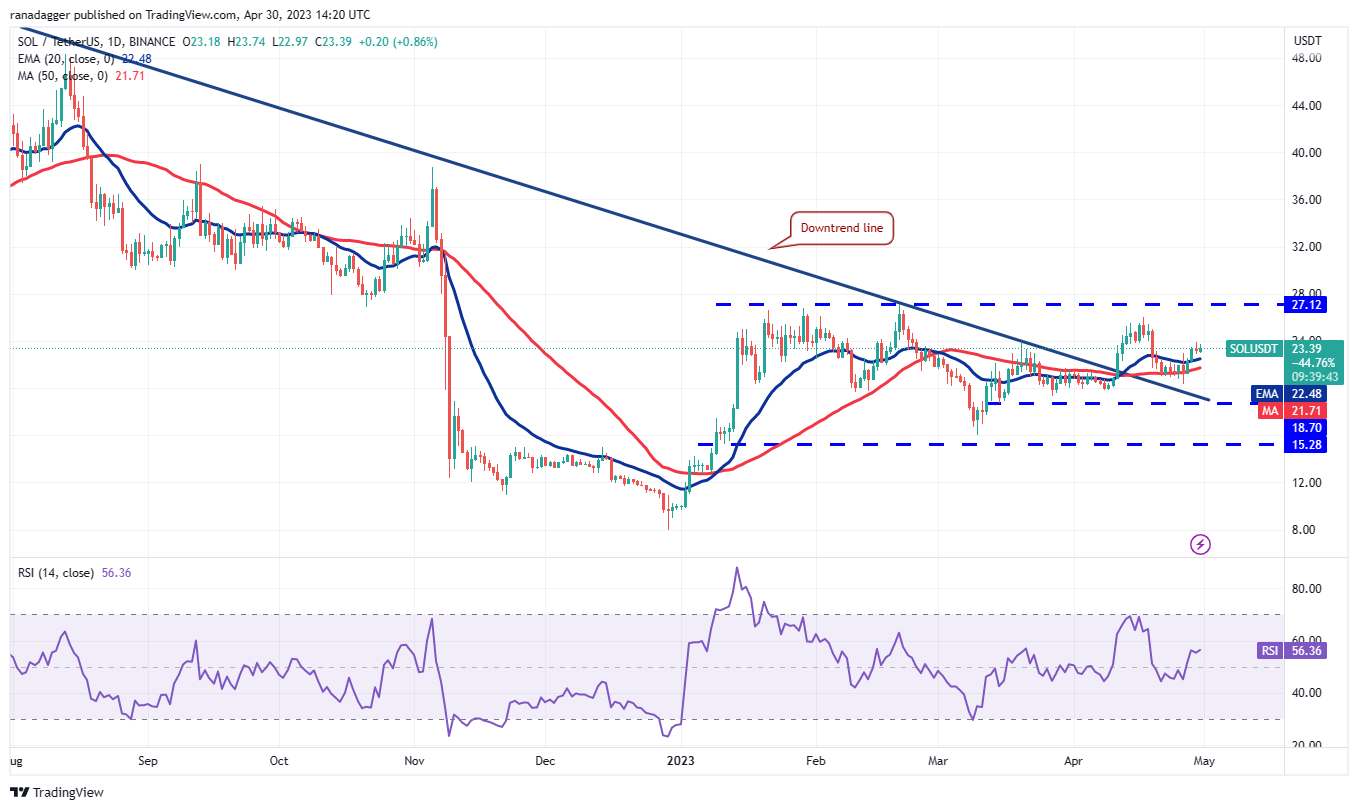 SOL/USDT daily chart. Source: TradingView
Buyers will next attempt to drive the price to the overhead resistance at $27.12. This remains a key resistance level to monitor in the near term because if bulls propel the price above it, the SOL/USDT pair may accelerate toward $39.
This optimistic outlook could be invalidated in the short term if the price declines and breaks below the moving averages. The pair could then drop to the critical support at $18.70. A rebound from this level would indicate that the pair may fluctuate within the broader range between $18.70 and $27.12 for a while.
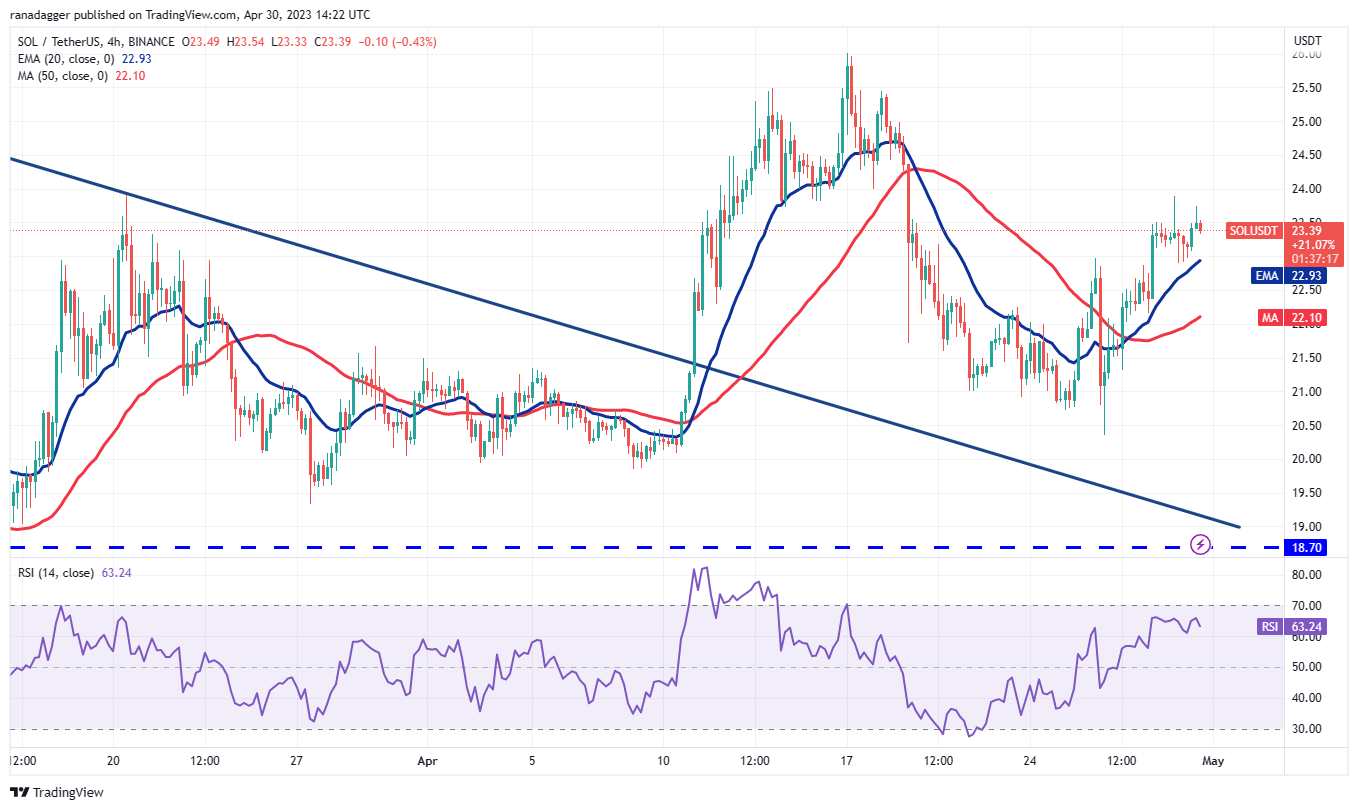 SOL/USDT 4-hour chart. Source: TradingView
The moving averages on the 4-hour chart have started to rise, and the RSI is in positive territory, indicating that buyers are in control. The bears are attempting to halt the recovery at $24, but if bulls overcome this obstacle, the pair may gain momentum and rally toward $25.50.
If the bears wish to thwart the rally, they must quickly pull the price back below the 20-EMA. The 50-SMA will be the support level to observe if the price begins to decline.
Cosmos price analysis
Related Posts
The long tail on Cosmos’ (ATOM) April 26 candlestick indicates that the bulls are vigorously defending the support at $10.20.
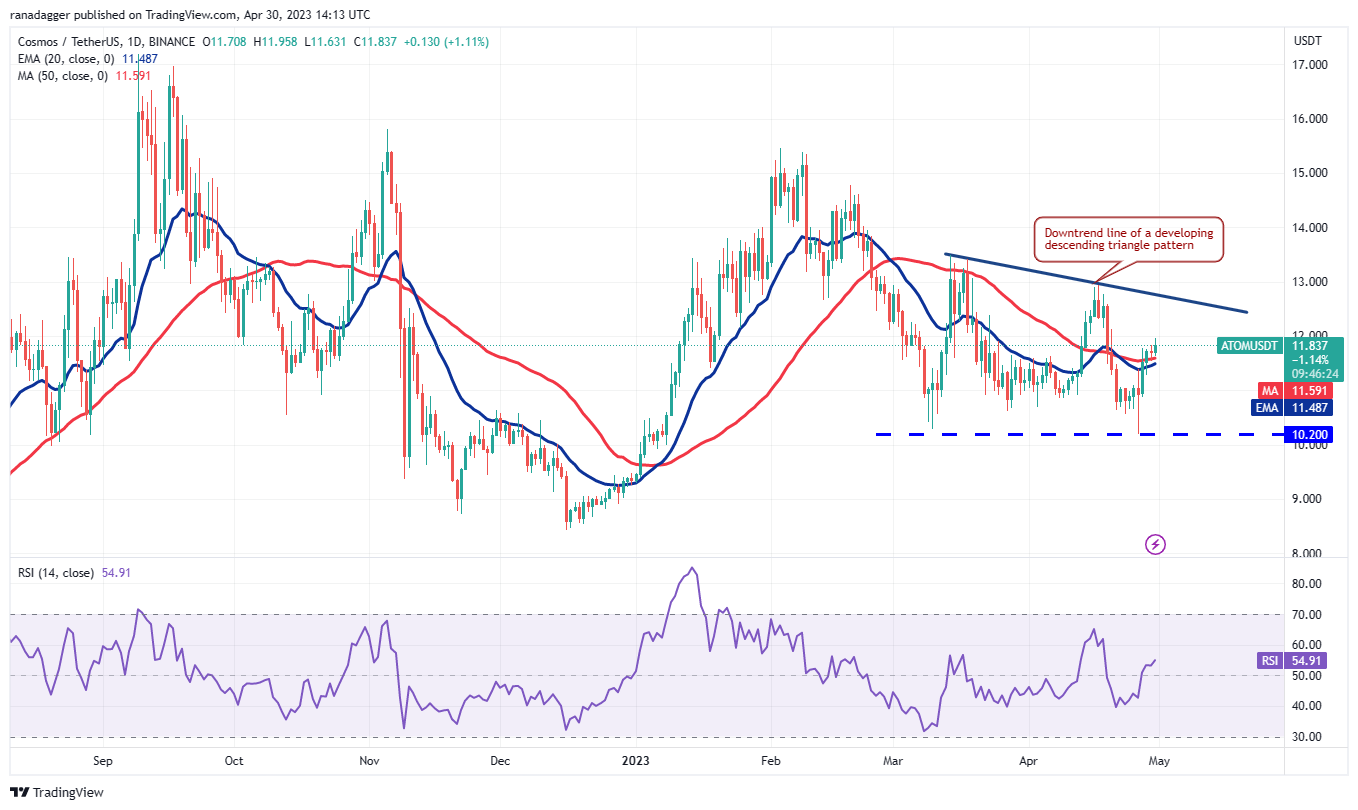 ATOM/USDT daily chart. Source: TradingView
Buyers have pushed the price above the moving averages and will aim to reach the downtrend line. This is a significant level to monitor because a break and close above it will pave the way for a potential rally to $13.50 and then to $15.50.
Conversely, if the ATOM/USDT pair reverses from the downtrend line, it will suggest that bears are attempting to form a descending triangle pattern. A decline below the moving averages would open the possibility of a retest of $10.20.
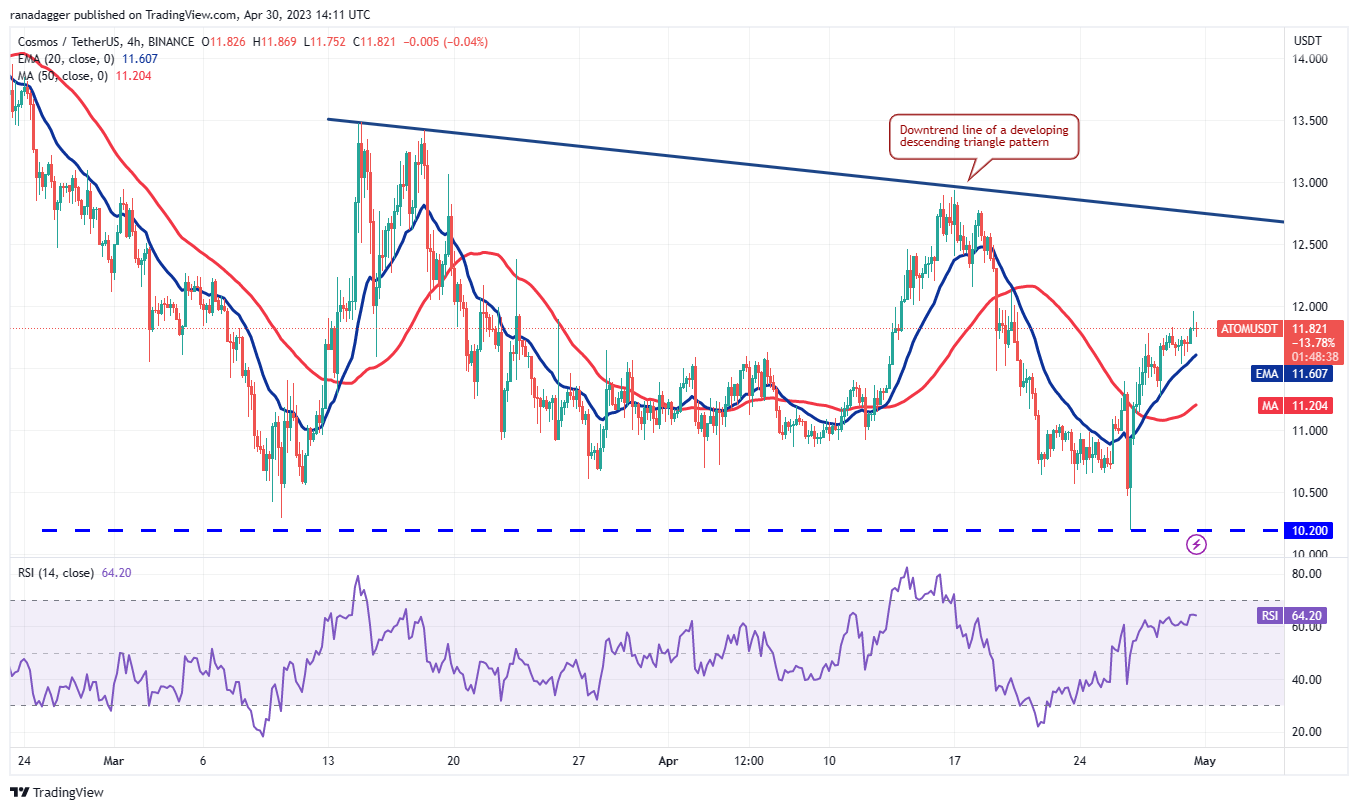 ATOM/USDT 4-hour chart. Source: TradingView
The 20-EMA on the 4-hour chart has turned upward, and the RSI is nearing the overbought zone, indicating that bulls are in control. There is a minor resistance at $12.13, but it is likely to be surpassed. The ATOM price may then rise to test the downtrend line.
If the price declines from $12.13, the bears will again attempt to pull the pair below the 20-EMA. If they succeed, it will suggest that buyers may be losing their grip. The pair would then risk a decline to the 50-SMA.
Related: ‘Good luck bears’ — Bitcoin traders closely watch April close with BTC price at $29K
Internet Computer price analysis
Internet Computer (ICP) fell below the 50-day SMA ($5.38) on April 26, but this turned out to be a bear trap. The price rebounded on April 27 and initiated a strong recovery.
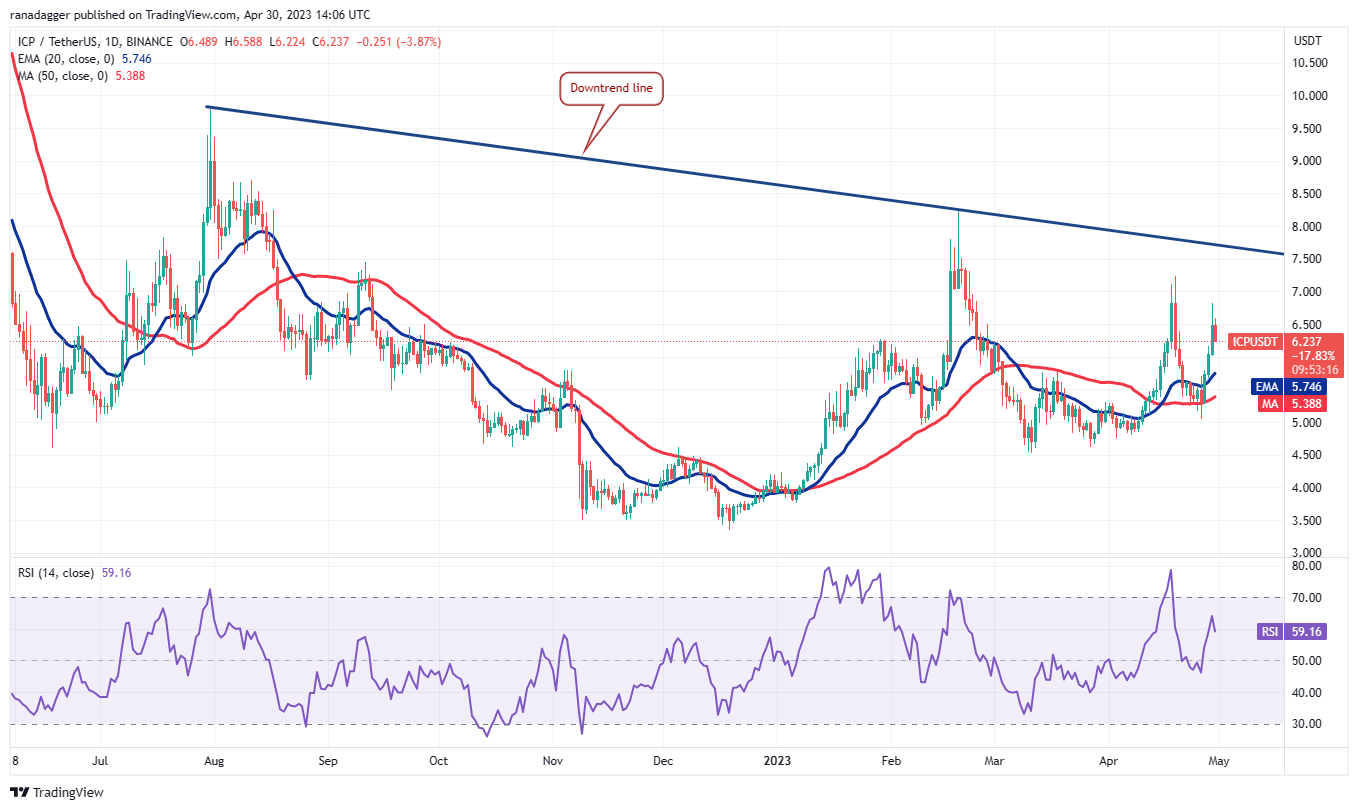 ICP/USDT daily chart. Source: TradingView
The 20-day EMA ($5.74) has started to rise, and the RSI has entered positive territory, indicating that bulls have a slight advantage. If the price maintains its current level or rebounds from the 20-day EMA, it will suggest that the bulls are buying the dips.
This would enhance the likelihood of a rally to the downtrend line, where bears will again mount a strong defense. Conversely, a break below the 50-day SMA will shift the advantage to the bears.
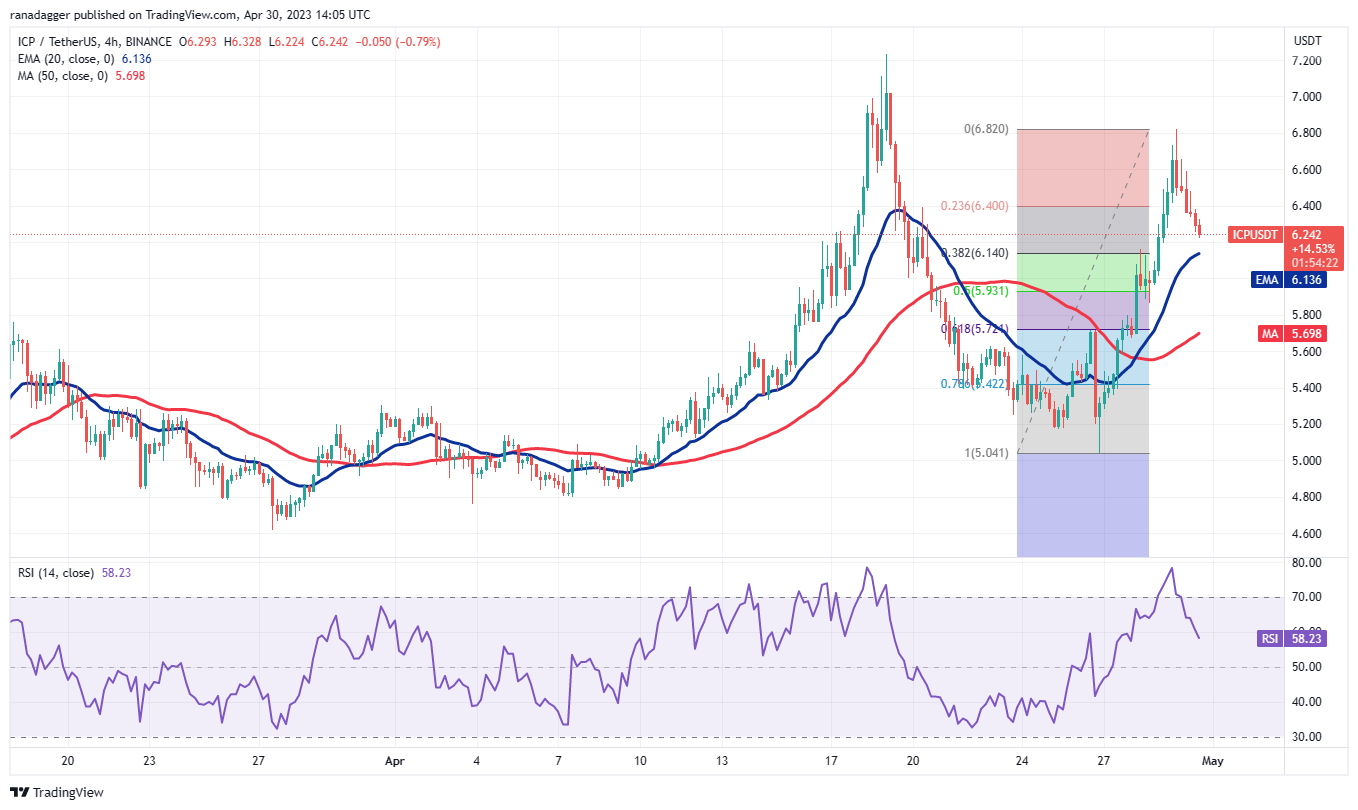 ICP/USDT 4-hour chart. Source: TradingView
The 4-hour chart indicates that the ICP/USDT pair is in a corrective phase. The initial support is at the 20-EMA, which is close to the 38.2% Fibonacci retracement level of $6.14. If the price bounces off this support, the pair may rally to $7.23 and eventually to $7.70.
In contrast, if the price continues to decline and breaks below the 20-EMA, it will suggest that short-term bulls may be taking profits. This could pull the price down to the 50-SMA, which is near the 61.8% retracement level of $5.72.
Hedera price analysis
The bears have repeatedly attempted to push Hedera (HBAR) below $0.06, but the bulls have held firm. The inability to break the support has attracted buyers who will try to push the price above the downtrend line.
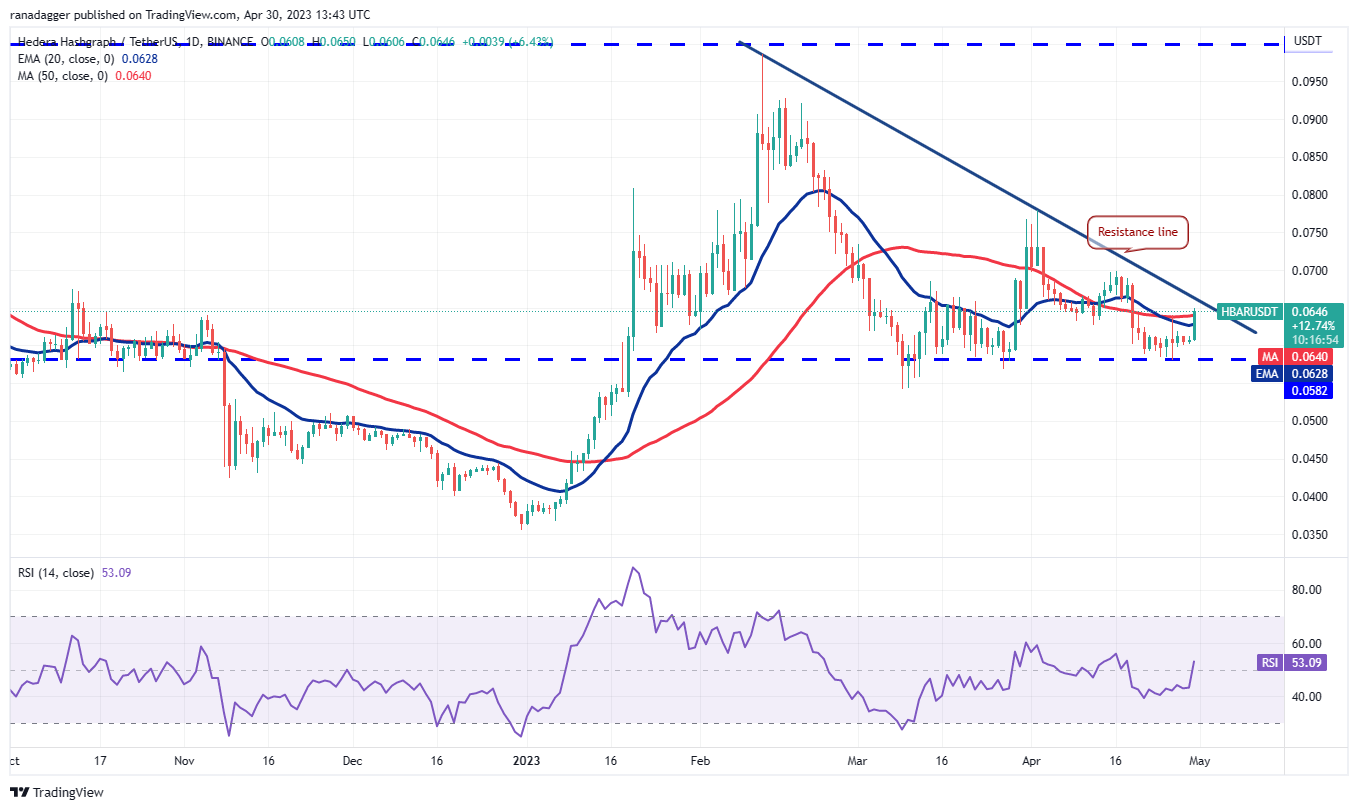 HBAR/USDT daily chart. Source: TradingView
The 20-day EMA ($0.06) is flattening, and the RSI has risen above the midpoint, indicating that selling pressure is diminishing. If buyers push the price above the resistance line, bullish momentum may increase, and the HBAR/USDT pair could rally to the overhead resistance at $0.08.
Conversely, if the price declines from the current level or the resistance line, it will suggest that bears remain active at higher levels, raising the likelihood of a break below $0.06.
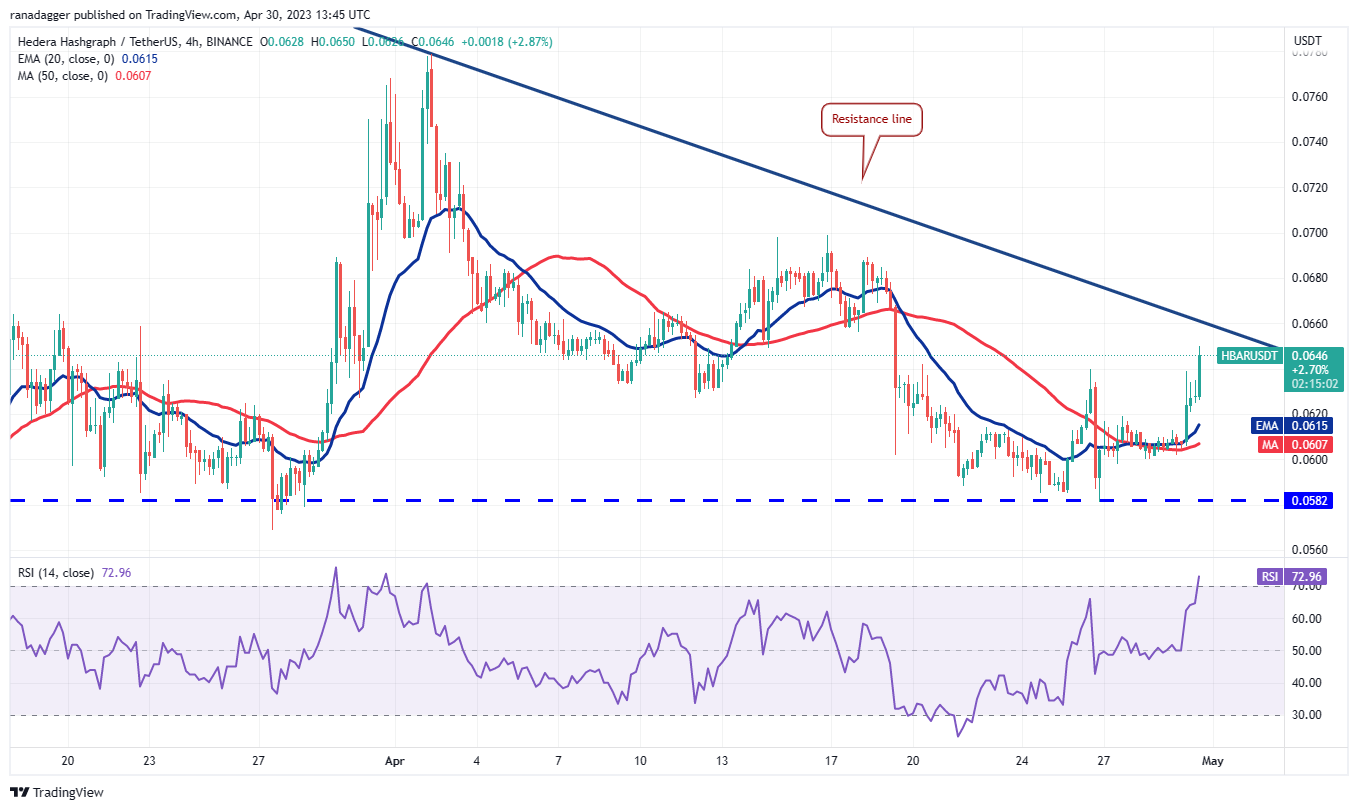 HBAR/USDT 4-hour chart. Source: TradingView
The 4-hour chart shows that the bulls have turned the moving averages into support and have initiated an upward movement that is likely to reach the resistance line. This level is expected to act as a strong barrier, but if the pair rebounds off the 20-EMA on the way down, it will indicate a shift in sentiment from selling on rallies to buying on dips.
The pair may then break above the resistance line and begin its ascent to $0.07 and subsequently to $0.08. If the bears wish to regain control, they must quickly pull the HBAR price below the moving averages.
This article does not contain investment advice or recommendations. Every investment and trading move involves risk, and readers should conduct their own research when making a decision.