Disclaimer: Information found on CryptoreNews is those of writers quoted. It does not represent the opinions of CryptoreNews on whether to sell, buy or hold any investments. You are advised to conduct your own research before making any investment decisions. Use provided information at your own risk.
CryptoreNews covers fintech, blockchain and Bitcoin bringing you the latest crypto news and analyses on the future of money.
Bitcoin remains within a tight trading range, showing no definitive indications of a breakout. In its most recent market update, trading platform QCP Capital noted that Bitcoin (BTC) might stay subdued for several more weeks before making a significant move in September.
Kevin Kelly, co-founder of Delphi Digital, posits that the cryptocurrency markets are in the initial phases of a new bullish cycle. Analyzing Bitcoin’s four-year cycle patterns, Kelly anticipates that Bitcoin will reach a new all-time high by the fourth quarter of 2024 and a new cycle peak by Q4 2025.
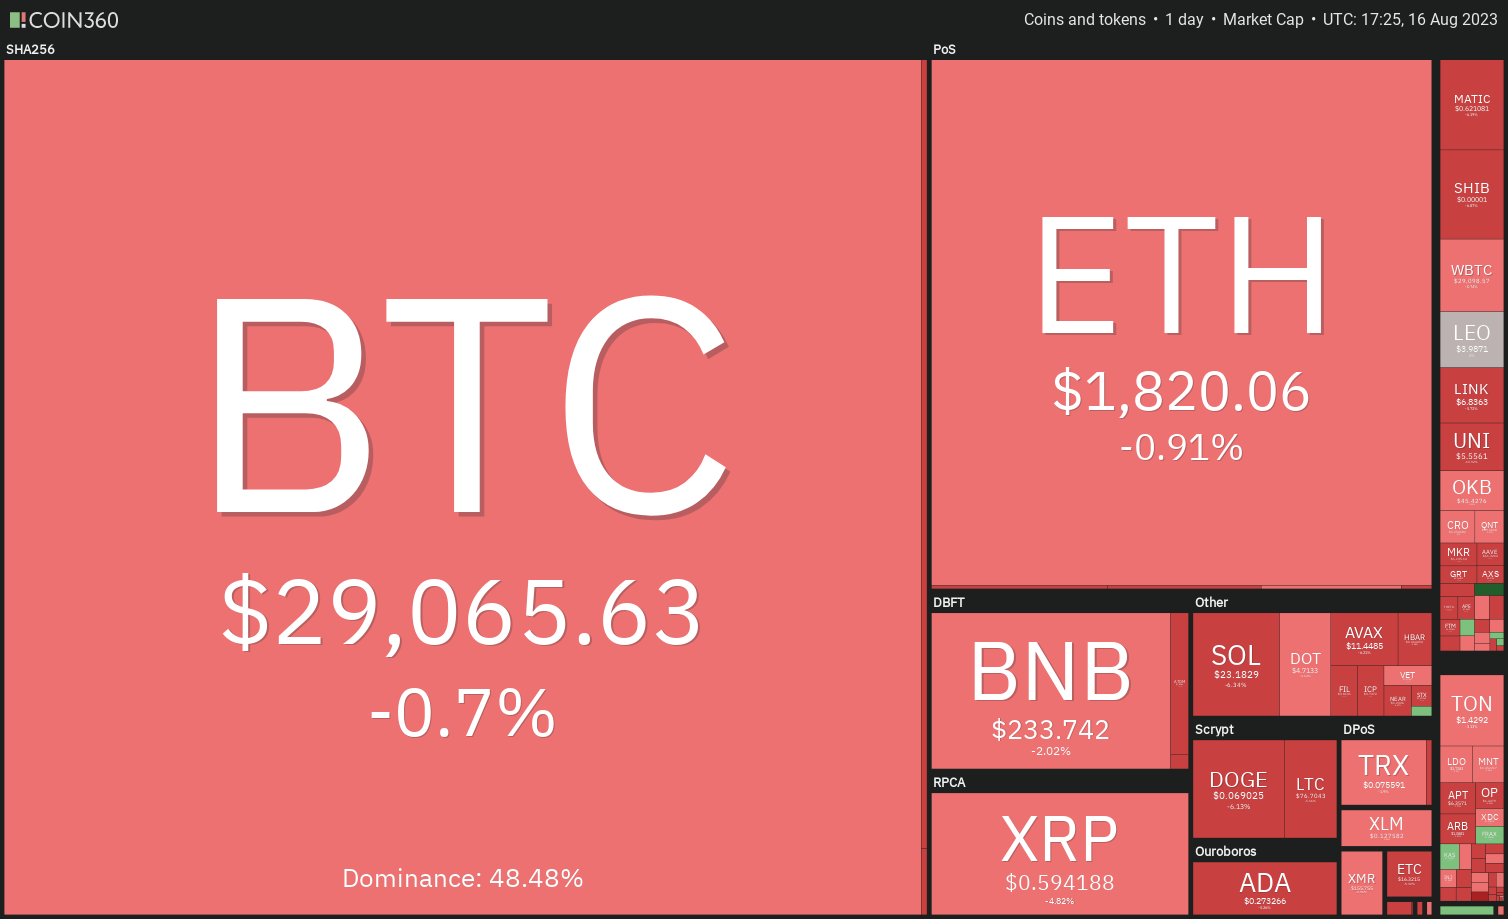 Daily cryptocurrency market performance. Source: Coin360
In a similar vein, Bitcoin investor and author Jesse Myers maintains a long-term optimistic outlook, although he does not foresee Bitcoin hitting $100,000 before the next halving. Myers believes the market will require 12-18 months post-halving to fully incorporate its effects.
Will Bitcoin and the leading altcoins remain confined to their current ranges in the short term, or is a breakout imminent? What critical levels should be monitored? Let’s analyze the charts of the top 10 cryptocurrencies to gain insights.
Bitcoin price analysis
On August 14, Bitcoin surpassed the 20-day exponential moving average (EMA) of $29,383, but the long wick on the candlestick indicates selling pressure at elevated levels.
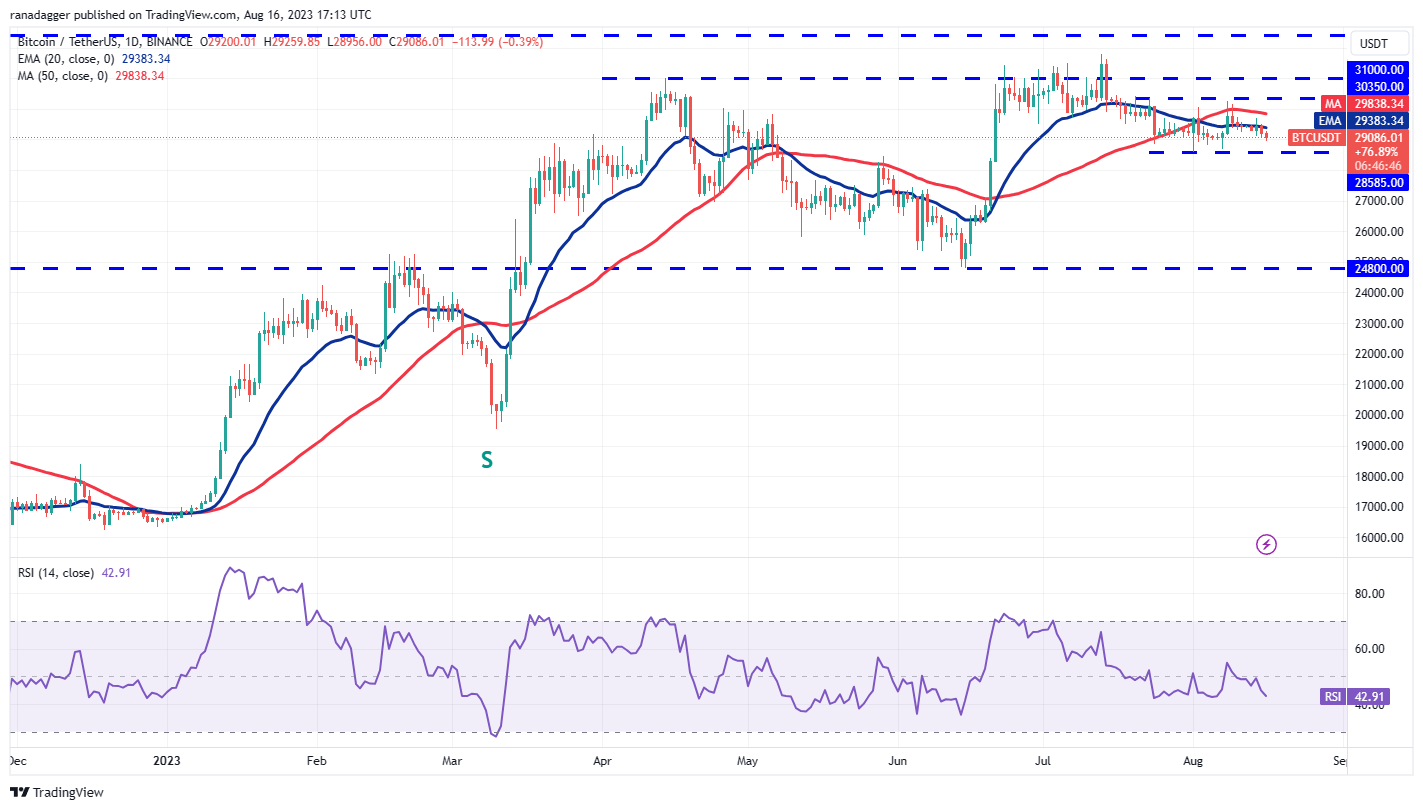 BTC/USDT daily chart. Source: TradingView
The BTC/USDT pair remains beneath the 20-day EMA, with the relative strength index (RSI) positioned in negative territory. This implies a slight advantage for the bears. The pair could decline to the significant support level at $28,585.
If the price rebounds strongly from this level and rises above the 20-day EMA, it will indicate that the pair may continue to fluctuate between $28,585 and $30,350 for a while longer.
The bears will gain the upper hand if they manage to push and maintain the price below $28,585, potentially initiating a decline toward $26,000.
Ether price analysis
The inability to push Ether (ETH) above the 20-day EMA ($1,847) in recent days may have triggered selling activity. This has driven the price down to the crucial short-term support at $1,816.
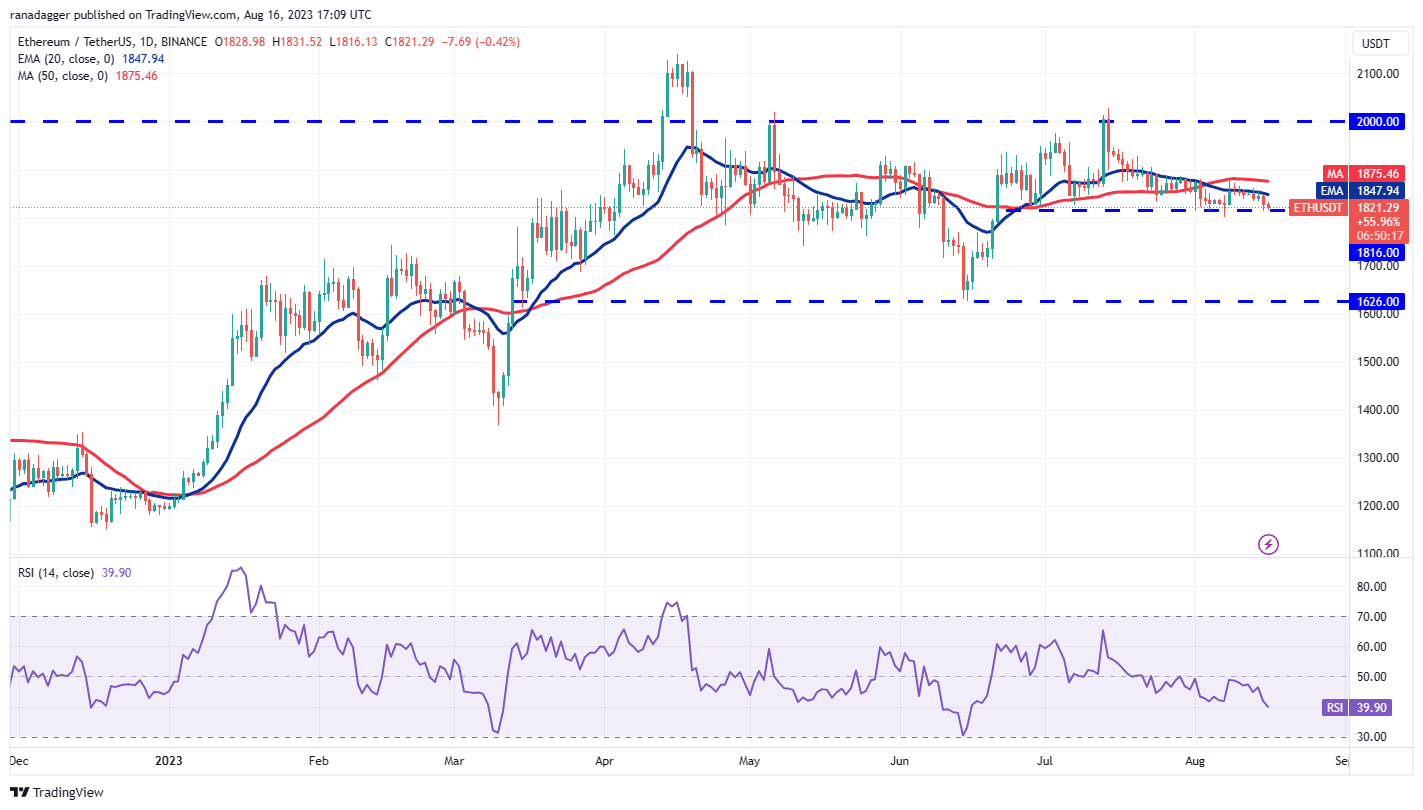 ETH/USDT daily chart. Source: TradingView
The 20-day EMA has begun to decline gradually, and the RSI is in negative territory, indicating that bears have the upper hand. If the price falls and remains below $1,816, selling pressure could increase, and the ETH/USDT pair may drop to $1,700.
The bulls are running out of time. To rectify the situation, they must swiftly push the price above the 50-day simple moving average (SMA) of $1,875. If successful, the pair may embark on a journey toward $1,930 and subsequently $2,000.
BNB price analysis
BNB (BNB) declined and fell below the support line of the symmetrical triangle pattern on August 15, indicating that the uncertainty between bulls and bears has resolved in favor of the bears.
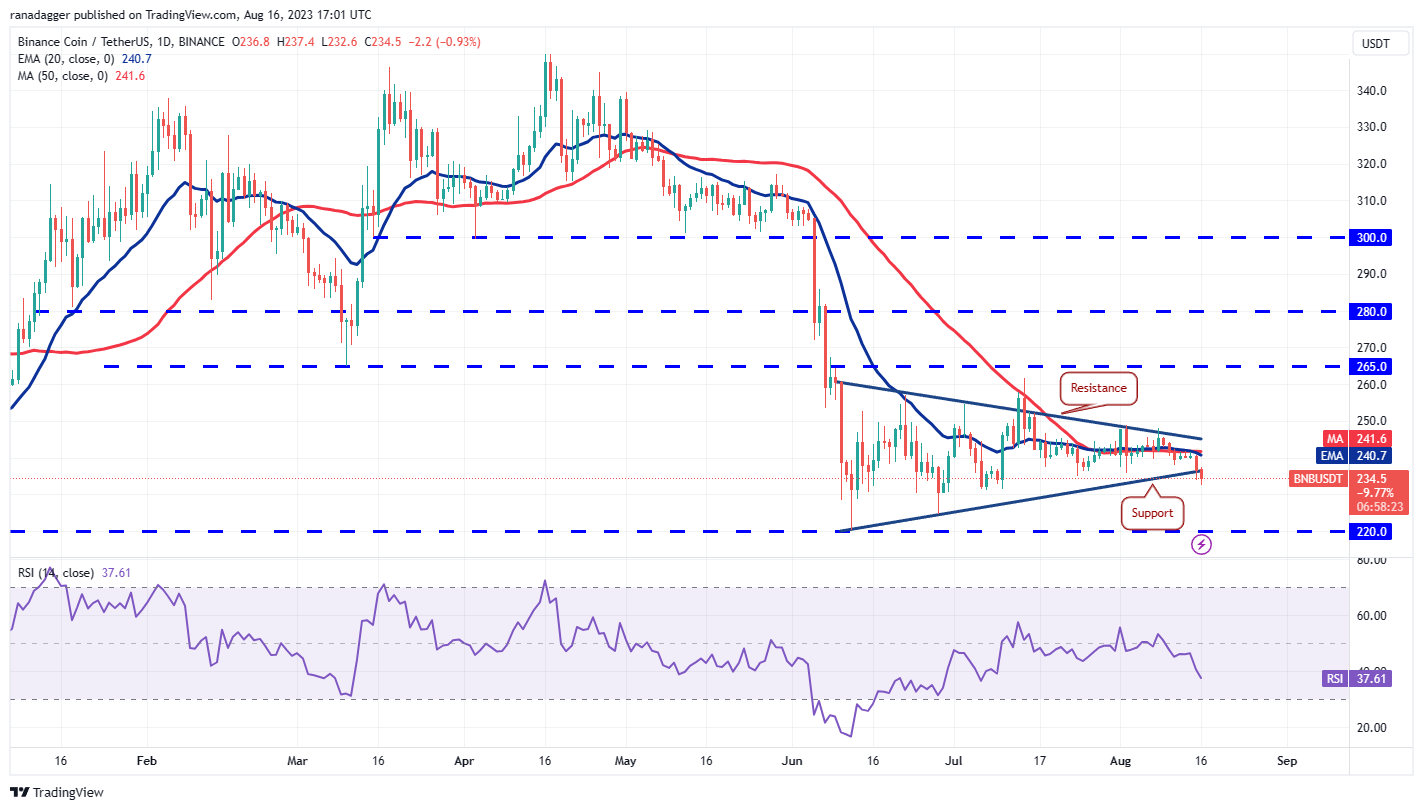 BNB/USDT daily chart. Source: TradingView
If the price remains below the triangle, the BNB/USDT pair could fall to the critical support level at $220. This level is likely to attract aggressive buying from bulls. If the price rebounds from this level and rises above the moving averages, it will suggest that the pair may continue to oscillate between $265 and $220 for a longer period.
Conversely, if the price continues to decline and breaks below the $220 support, it will indicate a resumption of the downtrend, potentially leading to a drop to the target of $196.
XRP price analysis
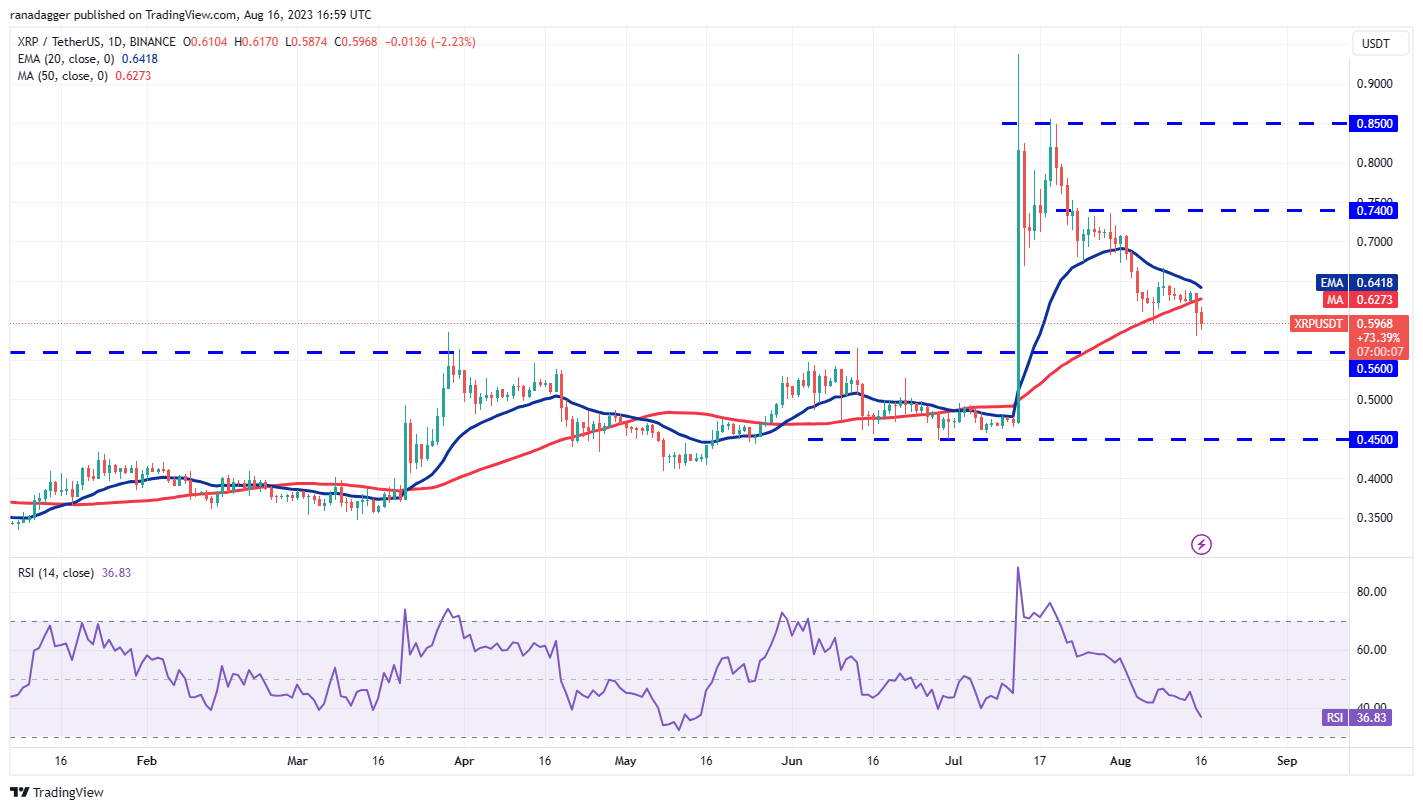
XRP (XRP) broke and closed below the 50-day SMA ($0.62) on August 15, signaling that bears remain in control.
 XRP/USDT daily chart. Source: TradingView
The XRP/USDT pair could fall to the breakout level of $0.56. This level is crucial for bulls to defend; if this support fails, selling pressure could escalate, and the pair may drop to $0.45.
On the other hand, if the price rebounds from $0.56, it will indicate that bulls are attempting to convert this level into support. Buyers will need to overcome the resistance at the moving averages to initiate a stronger recovery toward $0.74.
Dogecoin price analysis
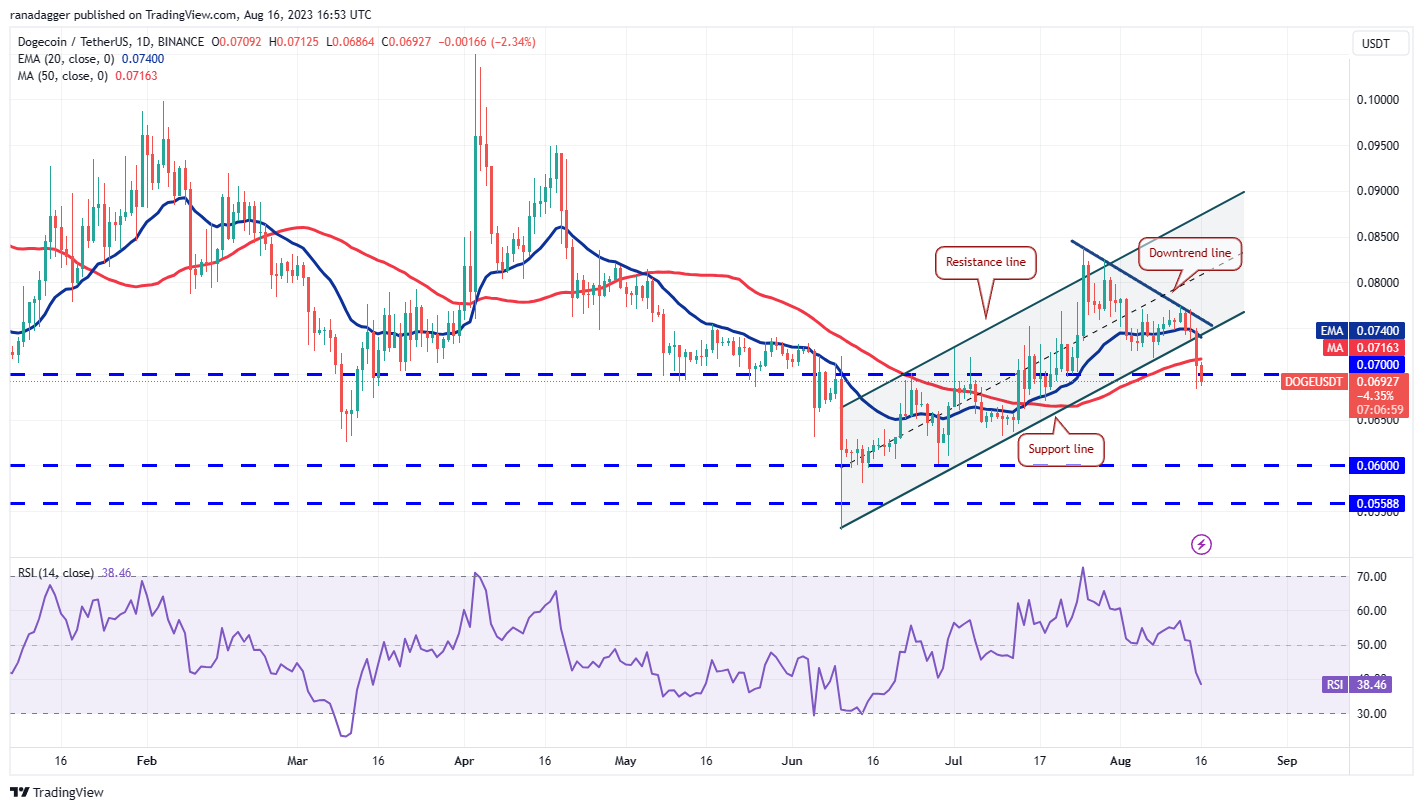
The bears pulled Dogecoin (DOGE) below the support line of the ascending channel pattern on August 15, shifting the advantage to the bears.
 DOGE/USDT daily chart. Source: TradingView
The bulls are likely to defend the breakout level of $0.07. If the price rebounds from this level, the DOGE/USDT pair may rise to the 20-day EMA ($0.07) and subsequently to the downtrend line. If the price declines from this resistance, it will increase the chances of a drop below $0.07. If that occurs, the pair could plummet to $0.06.
Related Posts
To avert a collapse, bulls must quickly push the price back above the downtrend line. If they succeed, the pair may rally to $0.08.
Cardano price analysis
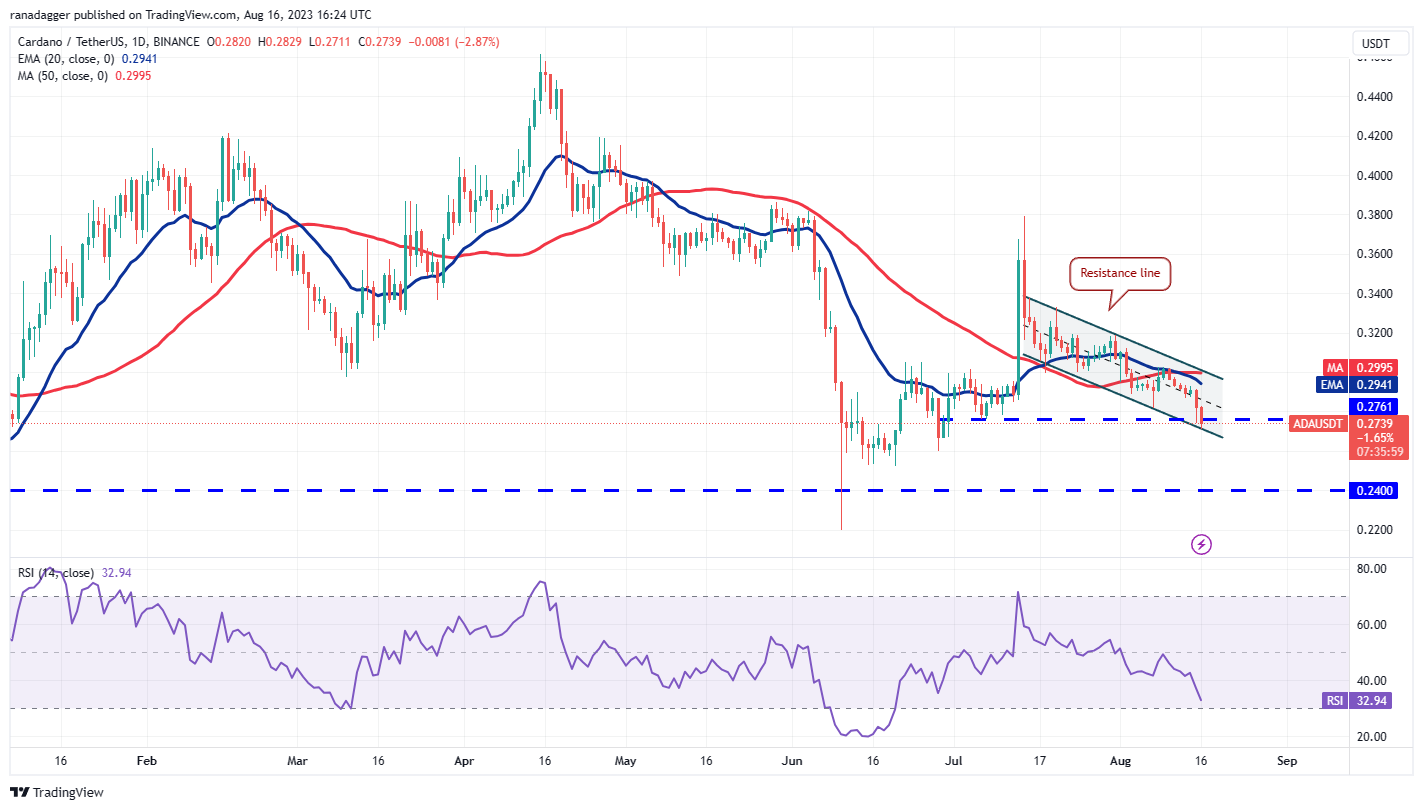
Cardano (ADA) continues to decline within a descending channel pattern, indicating that bears are firmly in control.
 ADA/USDT daily chart. Source: TradingView
The ADA/USDT pair has reached the support line of the channel. If this support fails, the pair could drop to $0.26 and then to $0.24. Bulls are expected to defend this level vigorously, as a breakdown here could lead to a continuation of the downtrend.
This negative outlook will be invalidated in the short term if the price bounces from the current level and rises above the channel, potentially opening the door for a relief rally to $0.34.
Solana price analysis
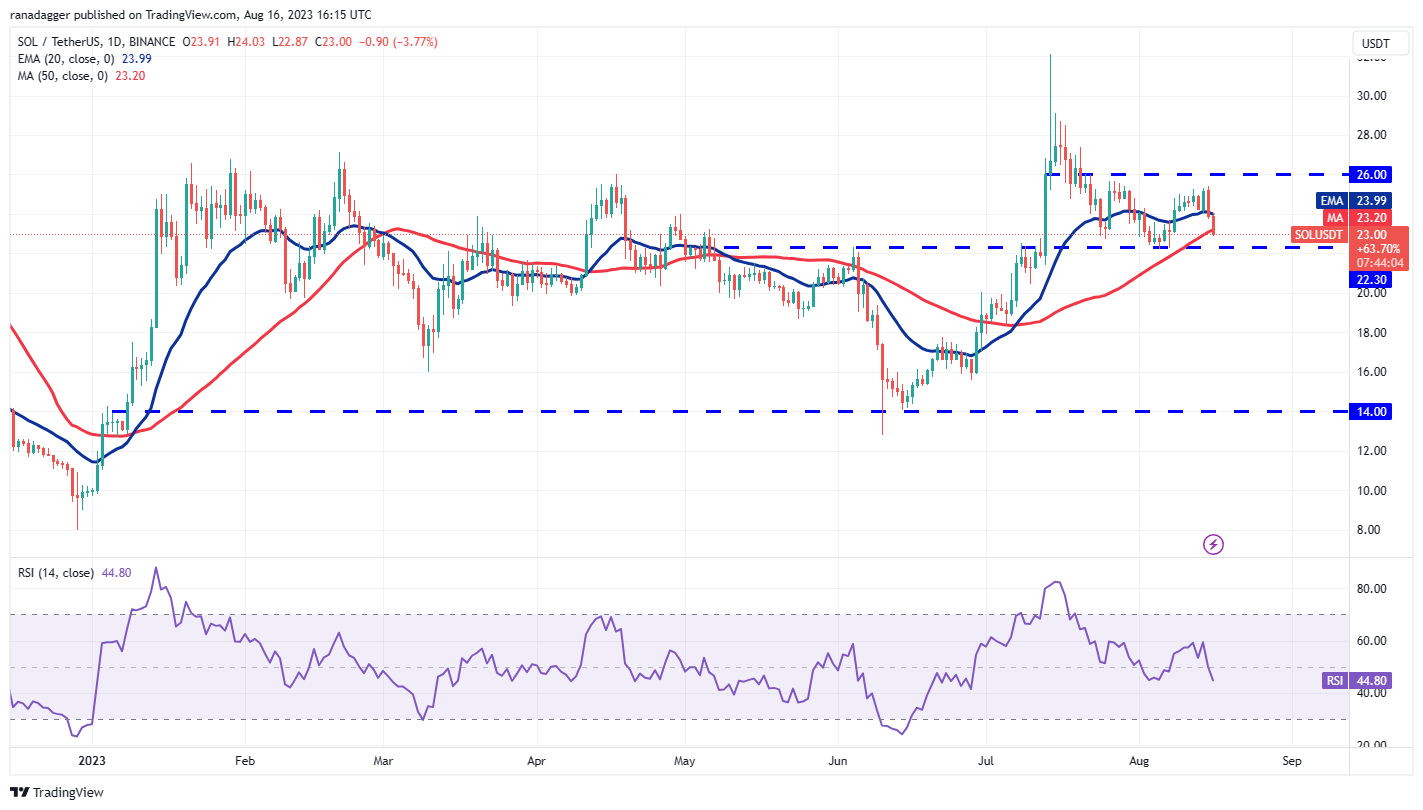
Solana (SOL) declined and fell below the 20-day EMA ($23.99) on August 15. The bears are attempting to capitalize on this by maintaining the price below the 50-day SMA ($23.20).
 SOL/USDT daily chart. Source: TradingView
The SOL/USDT pair could slide to the critical support at $22.30. If the price rebounds from this level, the pair may encounter strong selling at the moving averages. If the price declines from the moving averages, it will increase the likelihood of falling below $22.30, potentially leading to a drop to $18.
Conversely, if the price rises and breaks above the 20-day EMA, it will indicate that the range between $26 and $22.30 remains intact. The pair could then gradually ascend to the overhead resistance at $26. A break and close above this level will suggest that bulls are making a comeback.
Related: Why is Litecoin’s price down today?
Polygon price analysis
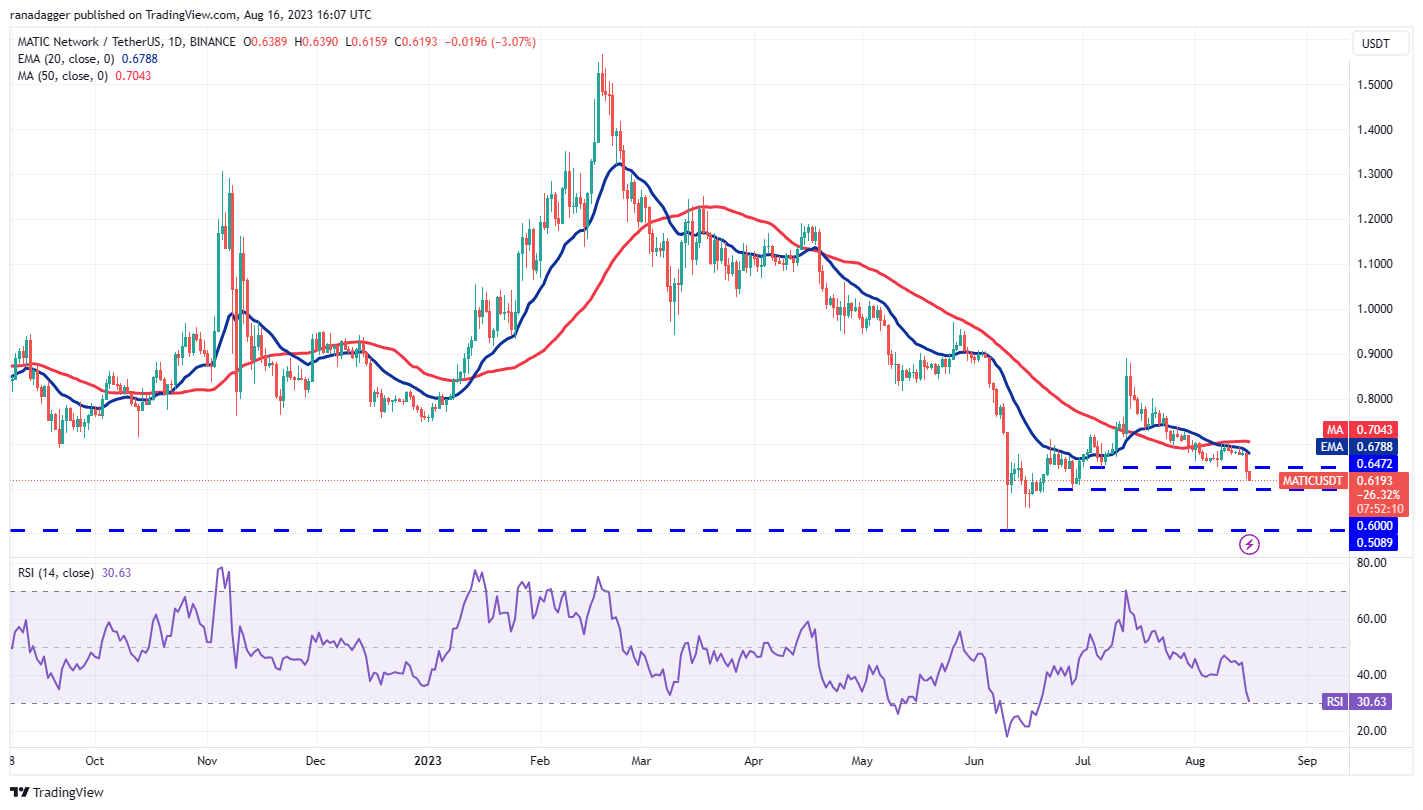
The repeated inability of the bulls to push Polygon (MATIC) above the 20-day EMA ($0.68) may have exacerbated selling pressure. This led to the price falling below the support near $0.65 on August 15. The next support level to monitor on the downside is $0.60.
 MATIC/USDT daily chart. Source: TradingView
The RSI is approaching oversold levels, suggesting that the selling may have been excessive in the short term. Buyers will likely attempt to initiate a rebound that could reach $0.65 and then the 50-day SMA ($0.70).
If the price declines from the overhead resistance, it will indicate that bears are in control. This could heighten the chances of a drop below $0.60, potentially leading to a decline toward $0.50.
For bulls to stage a comeback, they must push and maintain the price above the moving averages.
Litecoin price analysis
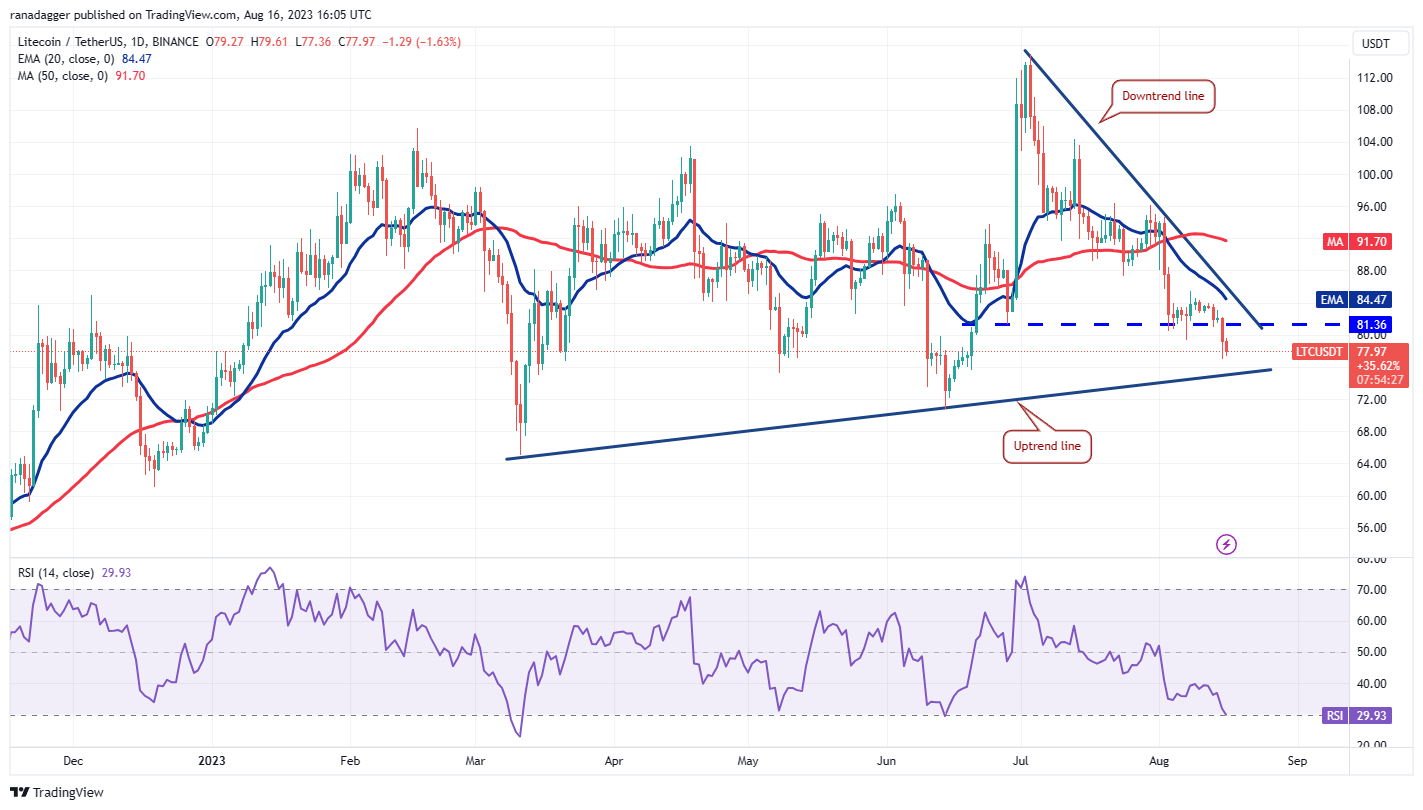
Litecoin (LTC) fell and closed below the significant support at $81.36 on August 15, indicating that bears are in charge.
 LTC/USDT daily chart. Source: TradingView
The RSI is in oversold territory, suggesting that a consolidation or bounce may be imminent. Bulls may attempt to defend the uptrend line. If the price rebounds from this level, it could face selling pressure at $81.36 and again at the downtrend line.
If the LTC/USDT pair declines from the overhead resistance, it will indicate that sentiment remains negative and traders are selling on rallies. This will increase the likelihood of a drop to $70.
The first indication of strength will be a break and close above the downtrend line, which could pave the way for a potential rally to the 50-day SMA ($91.70).
Polkadot price analysis
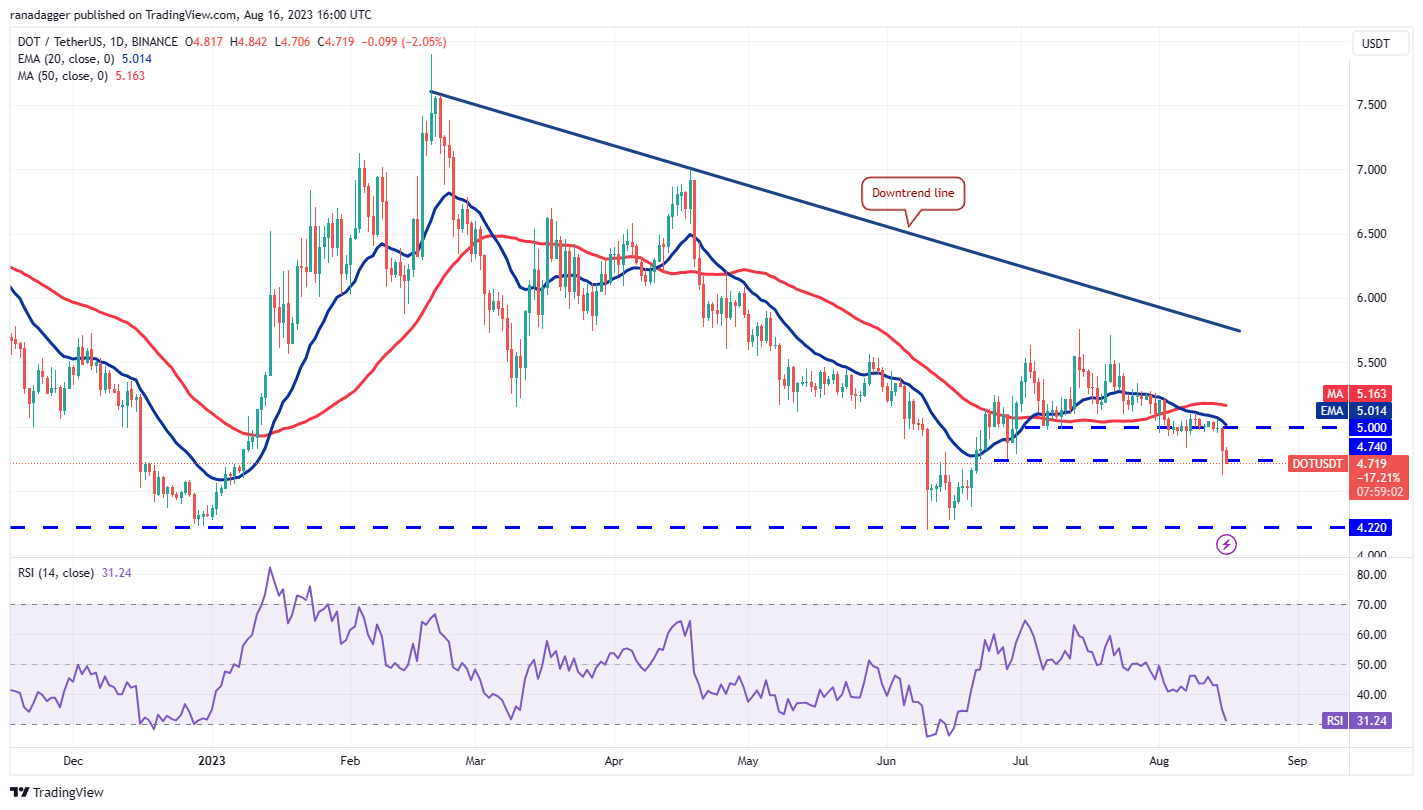
The failure of bulls to achieve a robust bounce off the $5 support in Polkadot (DOT) may have prompted selling from bears. This pushed the price below the support on August 15.
 DOT/USDT daily chart. Source: TradingView
Bulls bought the dip below the next support at $4.74, but they are struggling to maintain the recovery. This indicates that bears continue to sell during every minor relief rally. If the price continues to decline and falls below $4.60, it will suggest that the DOT/USDT pair is firmly under bear control, potentially leading to a drop to $4.22.
Buyers are likely to defend the area between $4.22 and $4.37 vigorously. On the upside, bulls will need to push the price above the 50-day SMA ($5.16) to signal a recovery. The pair could then surge toward the downtrend line.
This article does not contain investment advice or recommendations. Every investment and trading move involves risk, and readers should conduct their own research when making a decision.