Disclaimer: Information found on CryptoreNews is those of writers quoted. It does not represent the opinions of CryptoreNews on whether to sell, buy or hold any investments. You are advised to conduct your own research before making any investment decisions. Use provided information at your own risk.
CryptoreNews covers fintech, blockchain and Bitcoin bringing you the latest crypto news and analyses on the future of money.
Bitcoin (BTC) has been fluctuating within a narrow range for the last three days, even as the S&P 500 experienced declines for four consecutive days this week. This is an encouraging indication, as it reflects that cryptocurrency traders are not panicking or hastily exiting the market.
Bitcoin’s supply appears to be gradually transitioning to more resilient holders. Analyst CryptoCon, referencing Glassnode data, noted that Bitcoin’s short-term holders (STHs), defined as investors who have held their coins for 155 days or fewer, currently possess the smallest share of Bitcoin supply in over ten years.
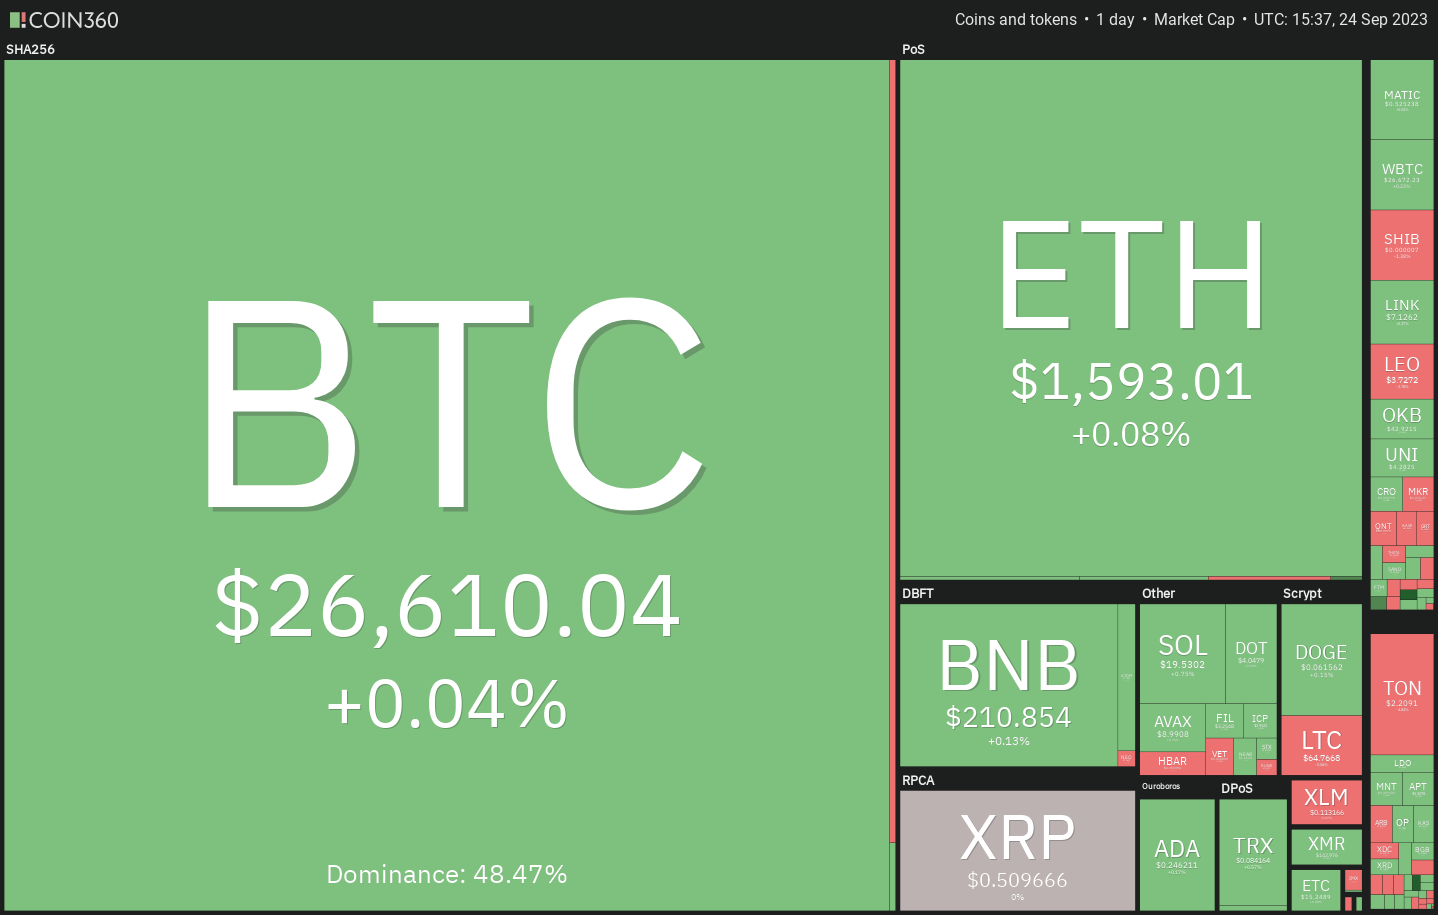 Crypto market data daily view. Source:Coin360
In the near term, the ambiguity surrounding Bitcoin’s next directional movement may have caused traders to remain cautious. This could be one reason for the muted price movements observed in several major altcoins. However, not all developments are negative; several altcoins are beginning to exhibit signs of recovery in the short term.
Is it possible for Bitcoin to awaken from its current state and initiate a bullish trend soon? Could this serve as a trigger for an altcoin surge? Let’s analyze the charts of the top five cryptocurrencies that might lead the upward movement.
Bitcoin price analysis
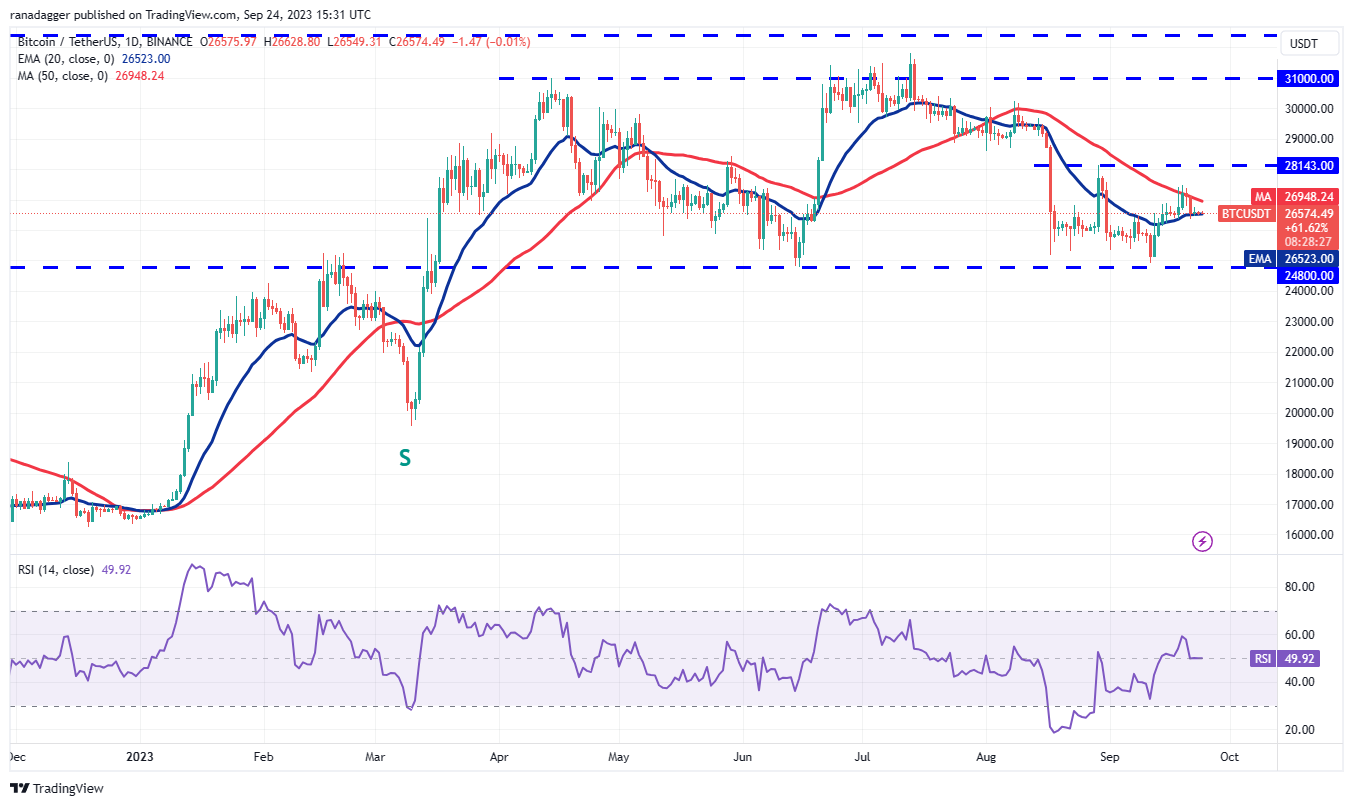
The bulls have succeeded in maintaining the price above the 20-day exponential moving average ($26,523), yet they have not managed to initiate a significant rebound. This suggests a lack of demand at elevated levels.
 BTC/USDT daily chart. Source: TradingView
The flat 20-day EMA and the relative strength index (RSI) hovering near the midpoint indicate a state of balance between buyers and sellers. A drop below the 20-day EMA would shift the advantage to the bears. The BTC/USDT pair could then fall to the significant support level at $24,800.
Conversely, if the price increases from its current position and surpasses the 50-day simple moving average ($26,948), it would signal that buyers are regaining control. The pair may then attempt to rally towards the overhead resistance at $28,143.
 BTC/USDT 4-hour chart. Source: TradingView
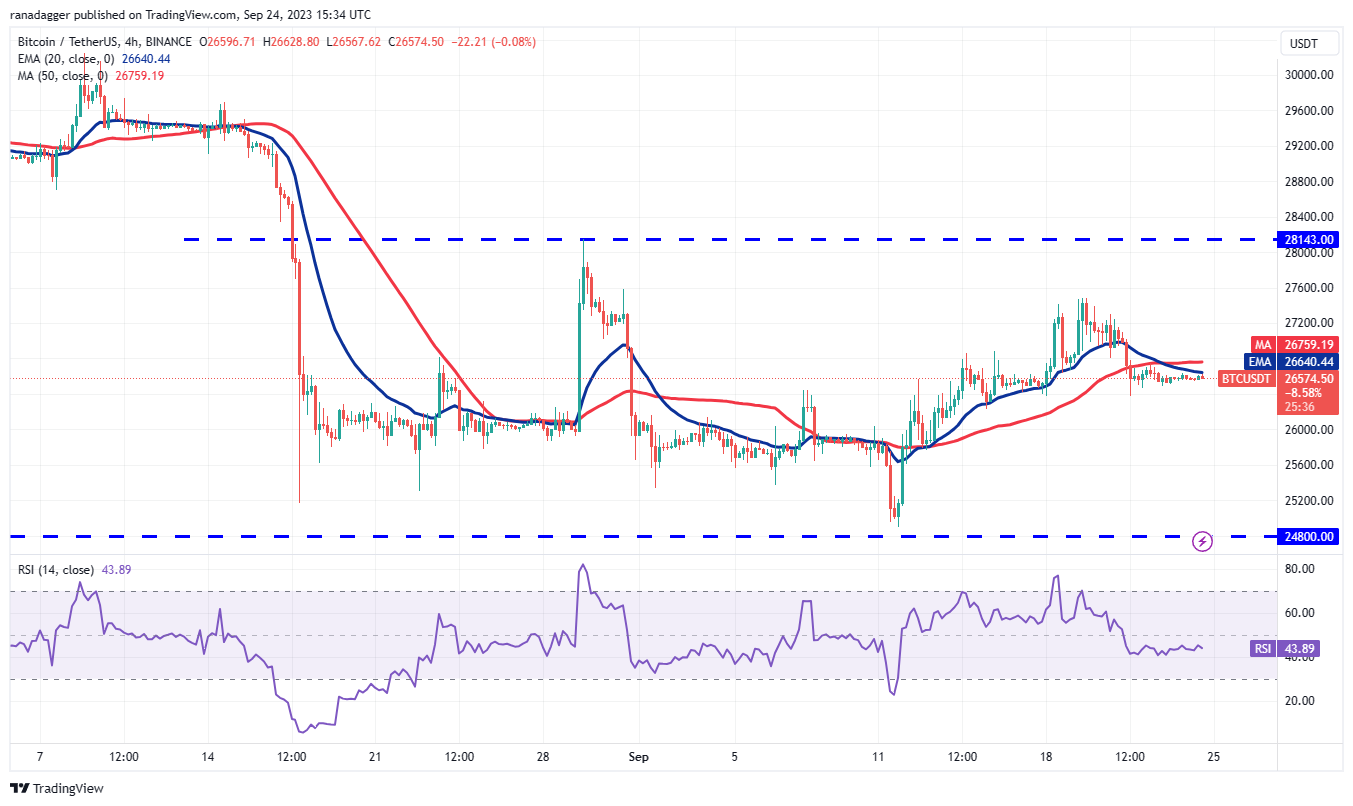
BTC has been trading below the moving averages on the 4-hour chart, yet the bears have not succeeded in initiating a downward trend. This indicates that selling pressure diminishes at lower levels. The bulls will aim to push Bitcoin’s price above the moving averages. If they achieve this, the pair could rally to $27,400 and subsequently to $28,143.
If the bears wish to take control, they must drive the BTC price below $26,200. This could initially pull it down to $25,750 and then to the $24,800 support level.
Chainlink price analysis
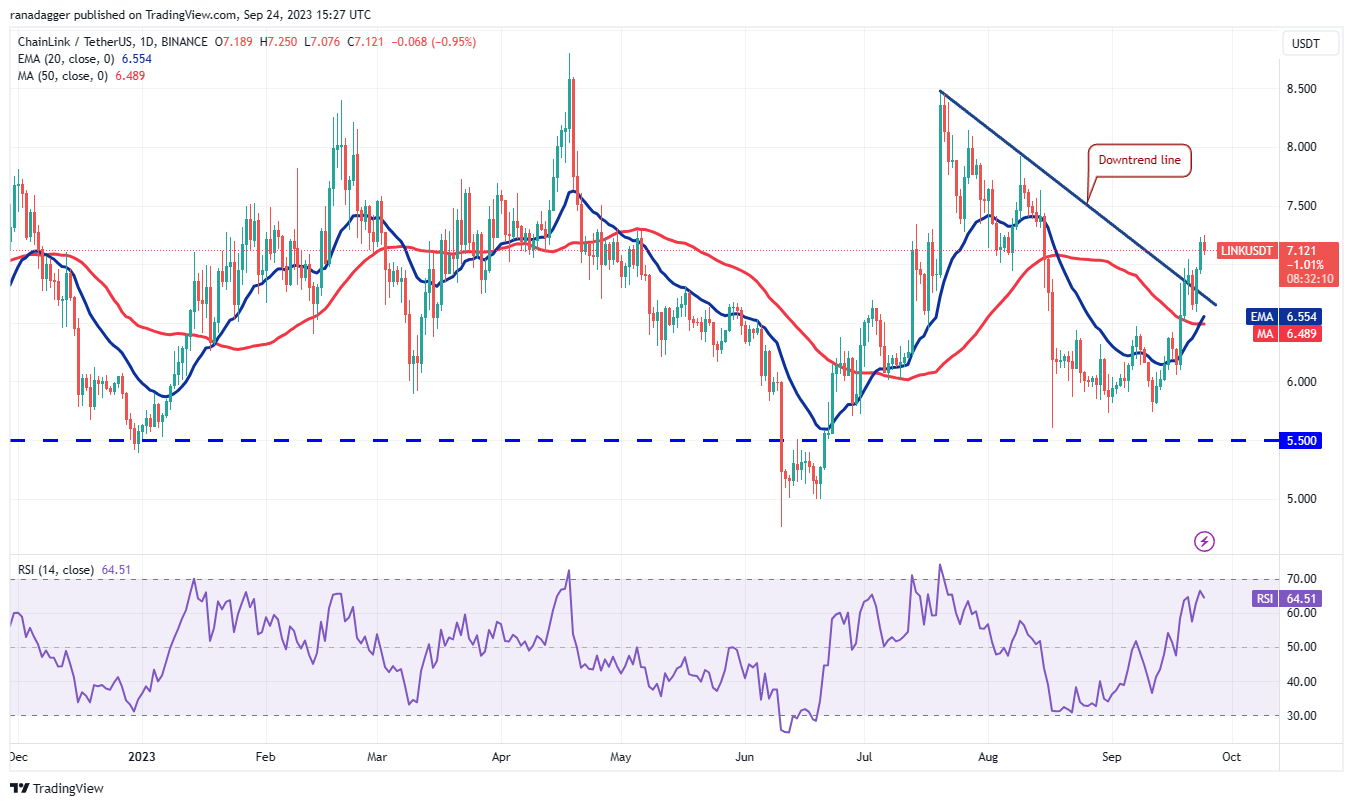
Chainlink (LINK) broke above the downtrend line on Sep. 22, signaling a potential trend reversal in the near future.
 LINK/USDT daily chart. Source: TradingView
The moving averages have executed a bullish crossover, and the RSI is in positive territory, suggesting that buyers are in control. During any corrections, the bulls are likely to purchase dips to the 20-day EMA ($6.55). A robust rebound from this level would indicate a shift in sentiment from selling on rallies to buying on dips.
The bulls will then attempt to extend the upward movement to $8 and eventually to $8.50. If the bears want to halt this upward trend, they must push the LINK/USDT pair below the 20-day EMA.
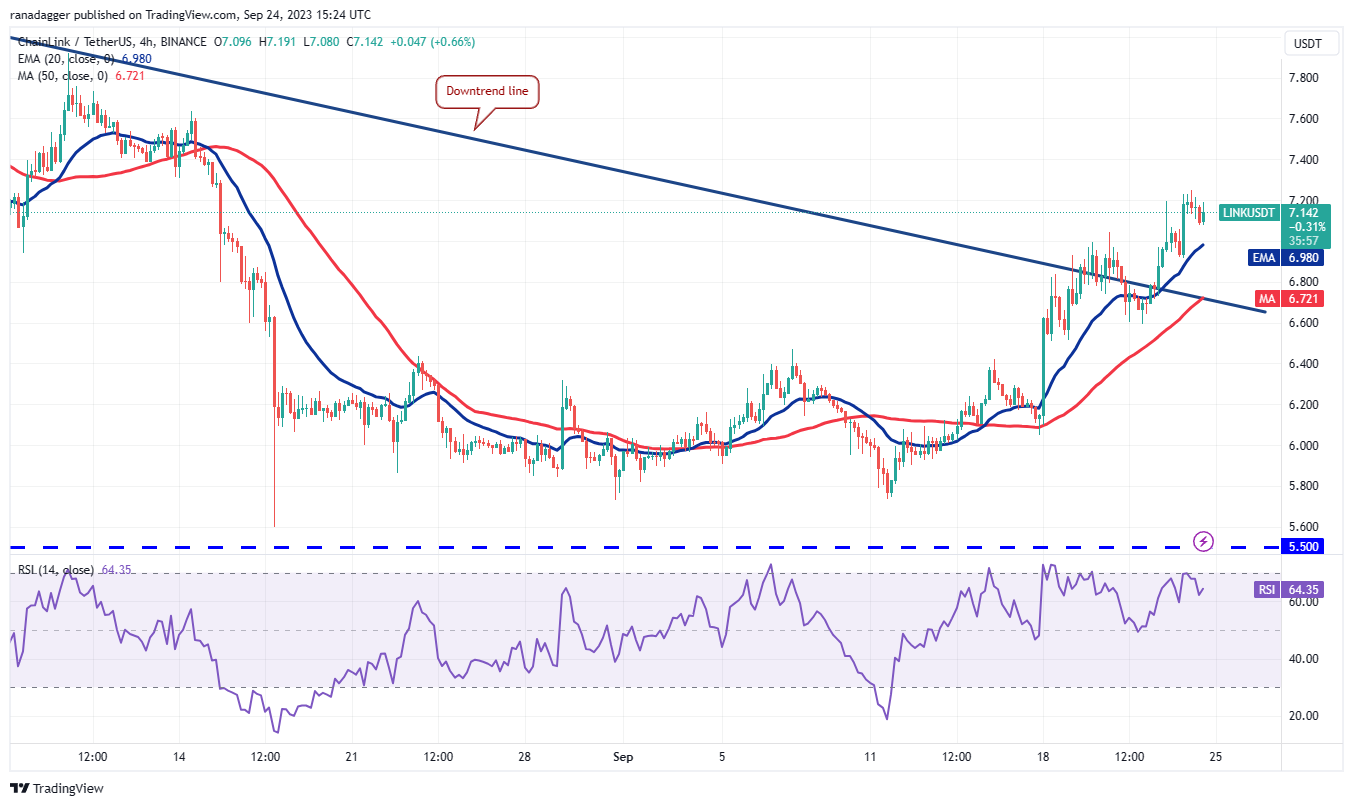 LINK/USDT 4-hour chart. Source: TradingView
Both moving averages are trending upward on the 4-hour chart, and the RSI is in the positive zone. The bulls have been purchasing dips to the 20-EMA, indicating a favorable sentiment. If the LINK price rebounds from the 20-EMA, $7.60 will be the next upside target to monitor.
In contrast, if Chainlink’s price continues to decline and falls below the 20-EMA, it will signal profit-taking by the bulls. LINK may then revisit the breakout level from the downtrend line. The bears will need to push it below $6.60 to regain control.
Maker price analysis
Maker (MKR) declined from the overhead resistance at $1,370 on Sep. 21, indicating that the bears are attempting to defend this level.
Related Posts
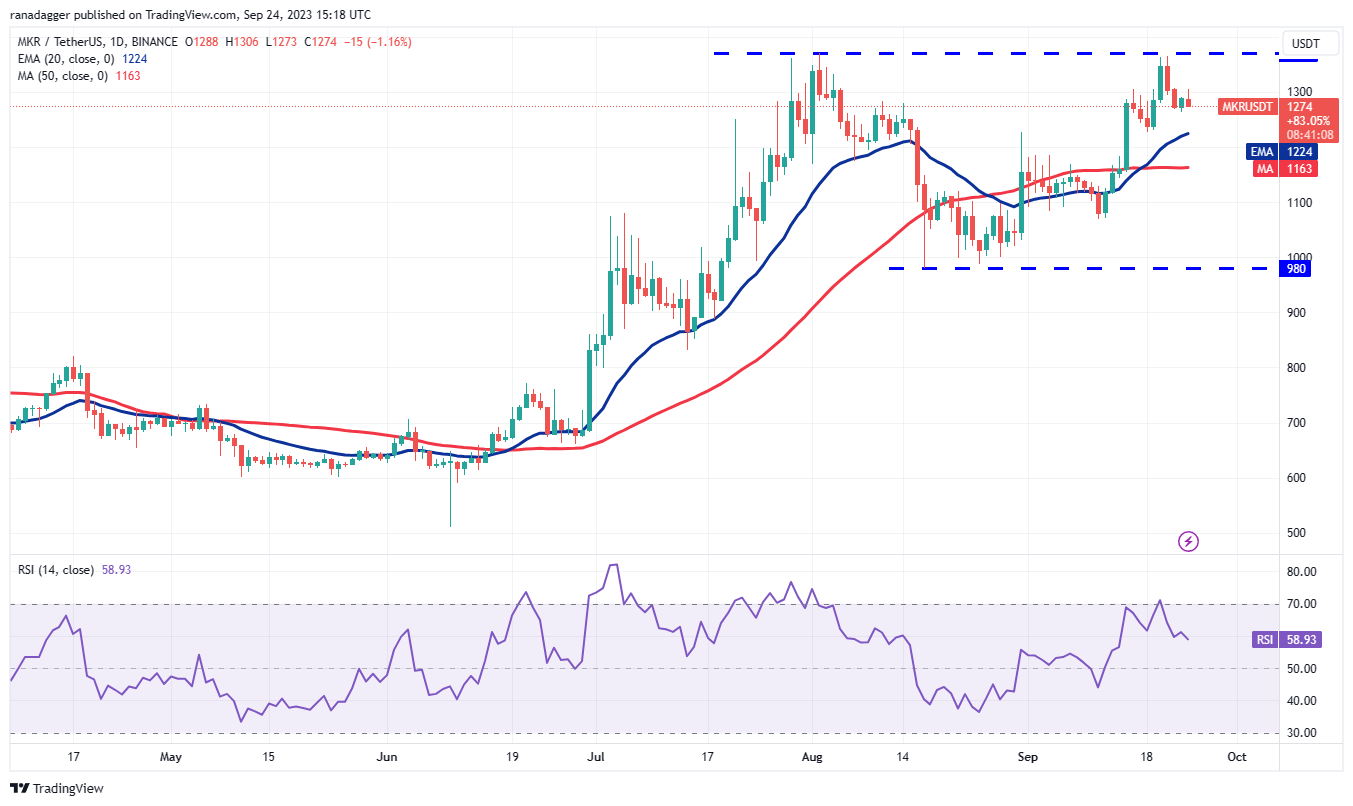 MKR/USDT daily chart. Source: TradingView
The 20-day EMA ($1,226) serves as the key support to monitor on the downside. If the price rebounds from this level, it will suggest that lower levels continue to attract buyers. The bulls will then make another attempt to push the MK price above the overhead resistance. If successful, the MKR/USDT pair could accelerate towards $1,759.
On the other hand, if the bears manage to push the price below the 20-day EMA, it will indicate that the bullish momentum has weakened. This could keep the pair confined within a range between $980 and $1,370 for several days.
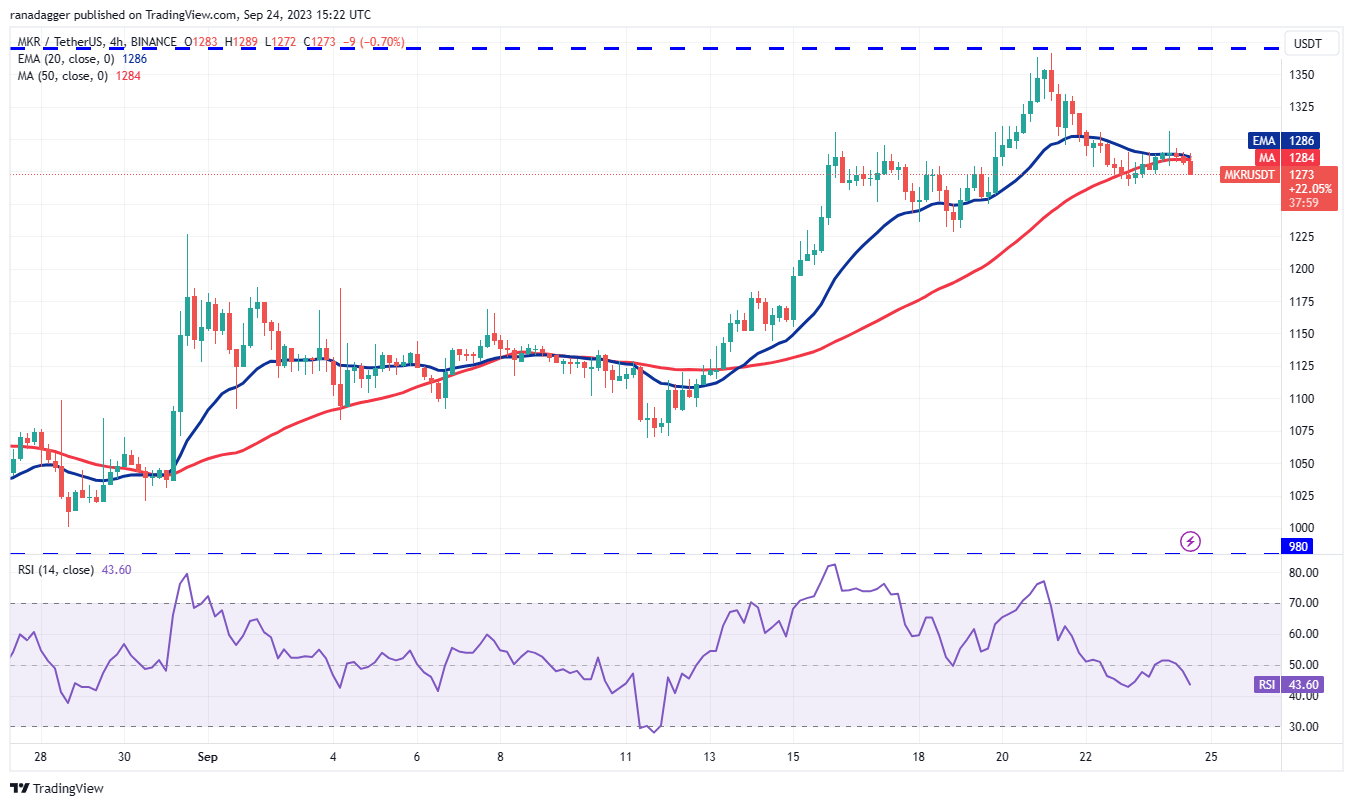 MKR/USDT 4-hour chart. Source: TradingView
The moving averages on the 4-hour chart have flattened, and the RSI is just below the midpoint, indicating a balance between supply and demand. If buyers push the price above $1,306, MKR could surge towards $1,370.
Conversely, if the price declines and breaks below $1,264, it will suggest that selling pressure is increasing. This could pave the way for a further drop to $1,225. A fall below this support may shift the short-term advantage to the bears.
Arbitrum price analysis
Arbitrum (ARB) is currently in a downtrend. The bears are selling during rallies to the 20-day EMA ($0.85), but a positive aspect is that the bulls have not given up much ground. This indicates that the bulls are attempting to maintain their positions as they anticipate a potential upward movement.
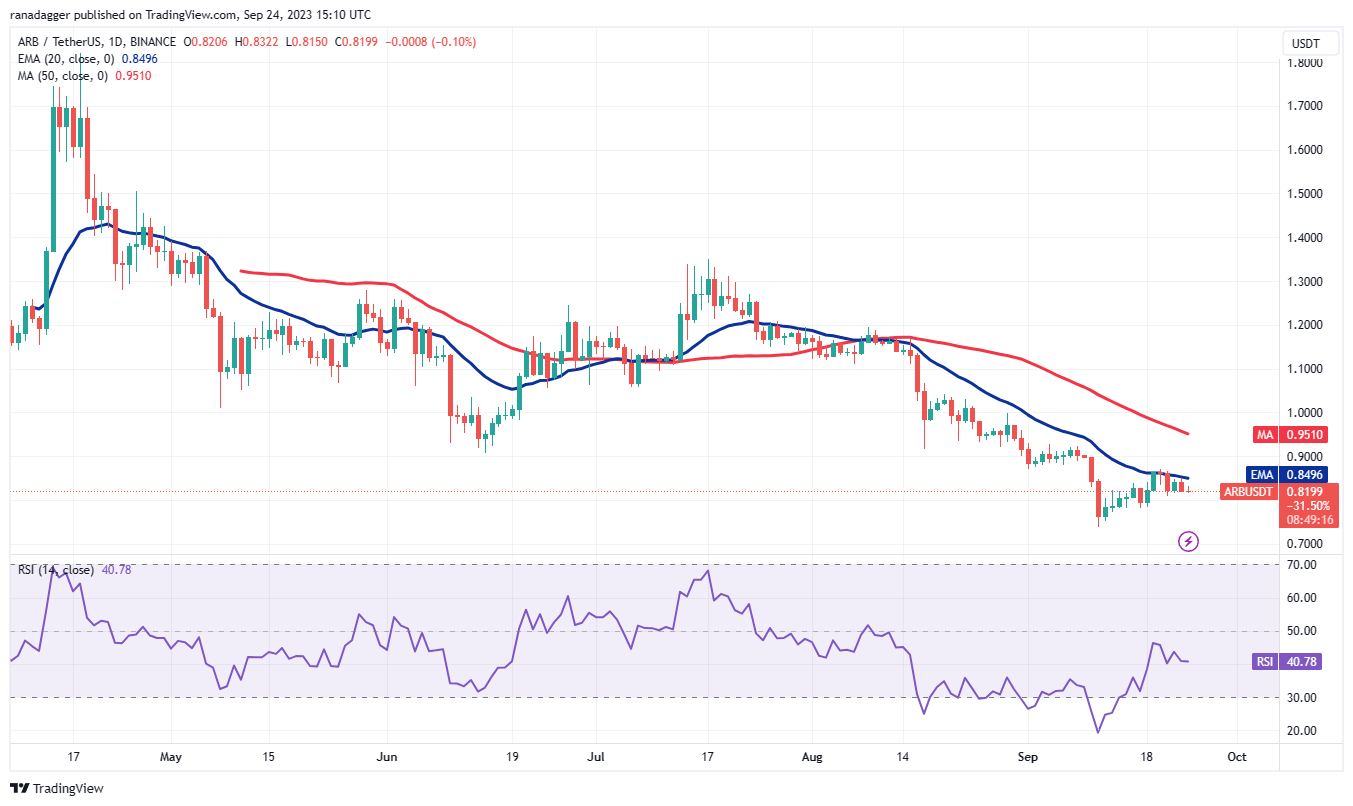 ARB/USDT daily chart. Source: TradingView
The RSI has climbed above 40, suggesting that momentum is gradually shifting positively. If buyers push the price above the 20-day EMA, it will indicate the beginning of a sustained recovery. The ARB/USDT pair could first rise to the 50-day SMA ($0.95) and then to $1.04.
The support levels on the downside are $0.80 and $0.78. Sellers will need to drive the ARB price below this range to allow for a retest of the support near $0.74. A breach below this level will signify the continuation of the downtrend.
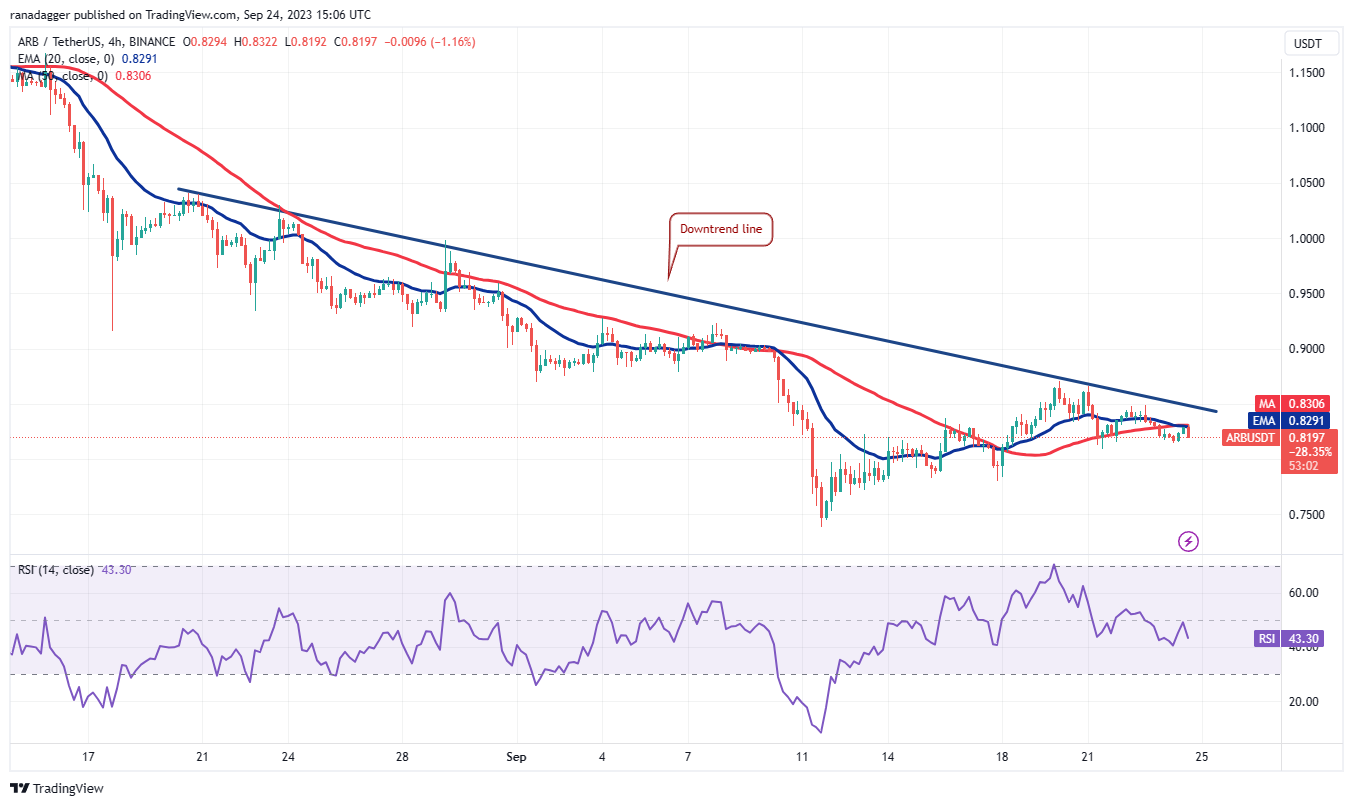 ARB/USDT 4-hour chart. Source: TradingView
The 4-hour chart indicates that the bears are selling during rallies to the downtrend line. The bears managed to pull the price below the moving averages but could not push the ARB price below the immediate support at $0.81. This suggests that the bulls are attempting to establish a higher low.
Buyers will again try to push the price above the downtrend line. If successful, Arbitrum’s price is likely to initiate a strong recovery towards the psychological level of $1. Conversely, a drop below $0.81 could pull the ARB price down to $0.78 and subsequently to $0.74.
Theta Network price analysis
Theta Network (THETA) surged above the 20-day EMA ($0.61) on Sep. 23, indicating that the bulls have absorbed the supply and are making an effort to recover.
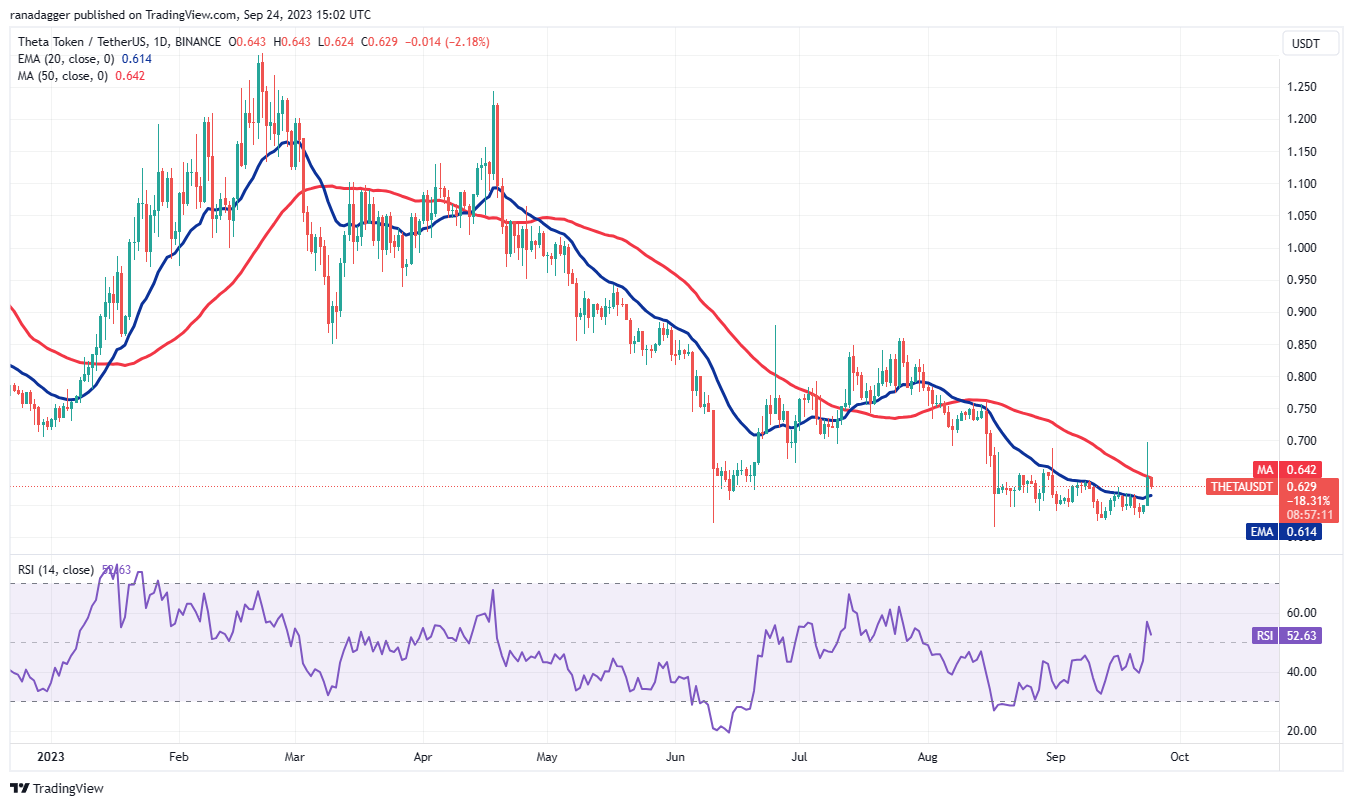 THETA/USDT daily chart. Source: TradingView
The bears have managed to pull the price back below the 50-day SMA ($0.64), but the bulls are expected to defend the 20-day EMA. If the THETA price rises from the current level and surpasses the 50-day SMA, it will improve the chances of a retest of $0.70.
This is a crucial level to monitor, as breaching it could allow the THETA/USDT pair to reach $0.76. This optimistic outlook will be invalidated in the near term if the price declines and falls below the 20-day EMA, which would open the door for a potential retest of $0.57.
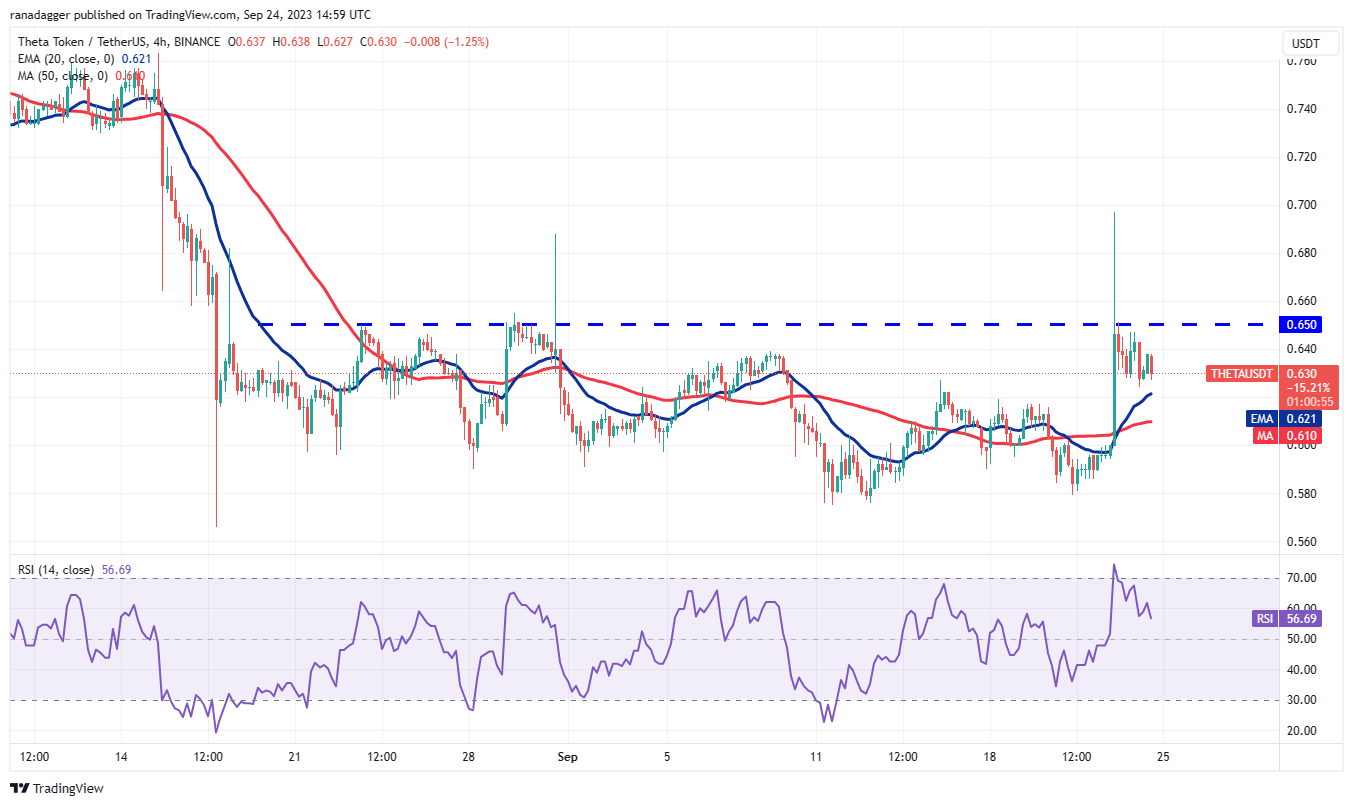 THETA/USDT 4-hour chart. Source: TradingView
The 4-hour chart reveals that the bears are defending the overhead resistance at $0.65. If buyers wish to maintain the bullish momentum, they must push the THETA price above $0.65. If they succeed, the pair is likely to initiate a new upward movement towards $0.70.
The 20-day EMA is the key support to watch on the downside. If the bears manage to push the price below this support, it will indicate that the bulls are closing their positions. The pair may then decline towards the support at $0.58.
This article does not contain investment advice or recommendations. Every investment and trading move involves risk, and readers should conduct their own research when making a decision.