Disclaimer: Information found on CryptoreNews is those of writers quoted. It does not represent the opinions of CryptoreNews on whether to sell, buy or hold any investments. You are advised to conduct your own research before making any investment decisions. Use provided information at your own risk.
CryptoreNews covers fintech, blockchain and Bitcoin bringing you the latest crypto news and analyses on the future of money.

- Michaël van de Poppe identifies $6.15-6.40 as a strategic entry point.
- The crypto analyst believes Chainlink has reached its bottom.
In a recent tweet, Michaël van de Poppe, a prominent figure in the cryptocurrency sector, shared his insights on Chainlink (LINK), a decentralized oracle network. Van de Poppe’s tweet has attracted considerable attention, amassing thousands of views along with numerous likes and shares. His analysis indicates that Chainlink is exhibiting upward momentum and is likely to maintain its bullish trajectory.
Request 1 – $LINK
This one is showing upwards momentum and I think that the bottom is in.
Retests are ready to be bought. If we get $6.15-6.40 retest, that's an entry towards $8. pic.twitter.com/1nqCroCKzp— Michaël van de Poppe (@CryptoMichNL) September 18, 2023
According to van de Poppe, Chainlink has hit its lowest point and is currently in a phase where retests present attractive buying opportunities. He highlighted the $6.15-6.40 range as a key entry point for investors. Should Chainlink retest this range, van de Poppe believes it would represent a favorable buying opportunity, with a potential target price of $8.
LINK/USD 4-hour Chart Analysis: Bullish Breakout Imminent
Related Posts
Chainlink price analysis indicates a possible bullish breakout as the altcoin’s price remains above all moving averages. The 4-hour chart for LINK/USD illustrates that the altcoin is facing challenges in breaking above the upper boundary of its symmetrical triangle pattern. The MACD indicator also supports a bullish breakout, having produced two consecutive higher highs, while the RSI stays neutral but above the 50 mark. If Chainlink succeeds in breaking out of this pattern, it could experience a price increase and potentially reach new highs of $9.50 and beyond.
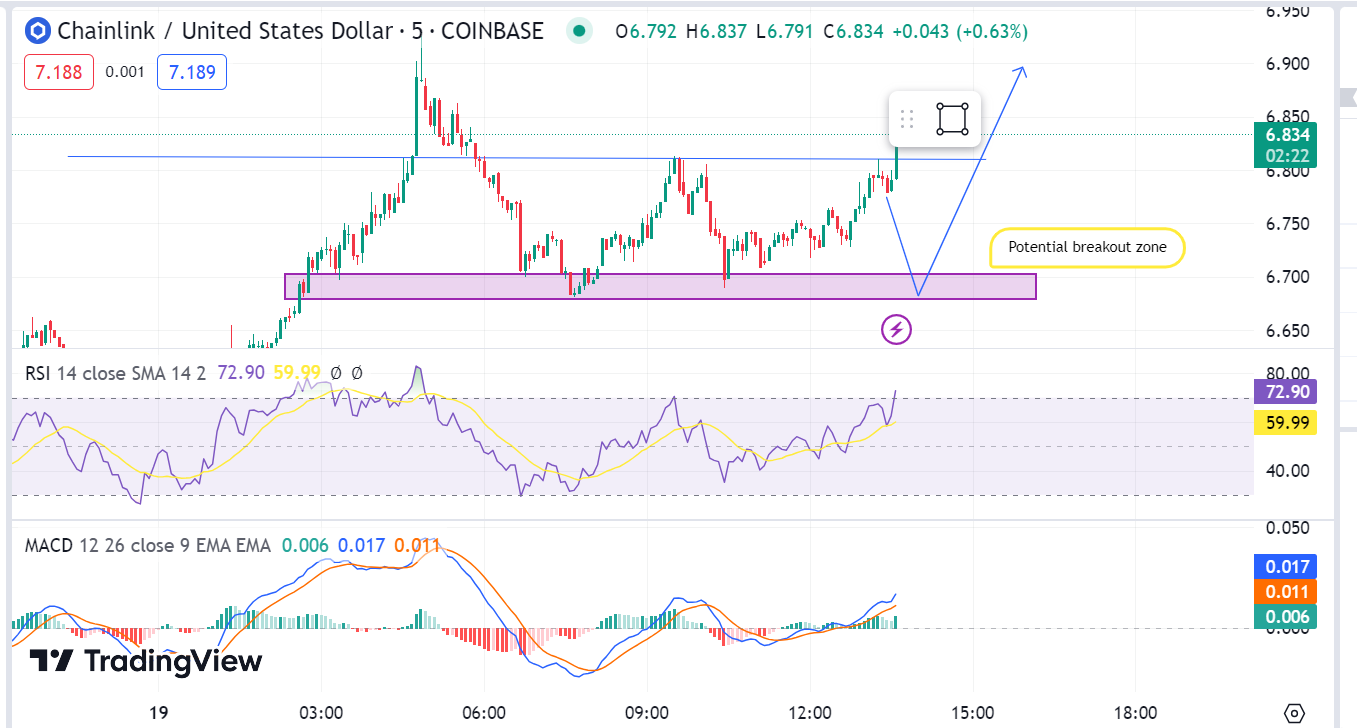
LINK/USD daily chart: TradingView
On the 4-hour Chainlink (LINK) chart, sellers attempted to drive the price below the $6.55 level. However, robust buying pressure at this point thwarted a downward movement, demonstrating the buyers’ strength in this area. Subsequently, the price rebounded, reaching the supply zone at $6.68. At this level, LINK/USD displayed multiple double-bottom patterns, which are considered bullish reversal signals in technical analysis.
The significant momentum shift was noted in the preceding 4-hour timeframe. The bulls gained traction, surpassing the minor resistance at $6.70. This bullish breakout resulted in a steady price increase, achieving an intraday high of $6.88. It is important to mention that this intraday high is close to the 200-exponential Moving Average (EMA), a crucial technical indicator.
If the bulls fail to maintain their current momentum, a price retraction to the primary support level at $6.45 may occur. Should this support level not hold, a further decline to $6.0 could be anticipated. This bearish scenario might pave the way for a potential downtrend, possibly lowering the price to $5.5.