Disclaimer: Information found on CryptoreNews is those of writers quoted. It does not represent the opinions of CryptoreNews on whether to sell, buy or hold any investments. You are advised to conduct your own research before making any investment decisions. Use provided information at your own risk.
CryptoreNews covers fintech, blockchain and Bitcoin bringing you the latest crypto news and analyses on the future of money.
According to Charlie Lee, the creator of Litecoin (LTC), significant gains against Bitcoin (BTC) are possible as the August halving event approaches.
Litecoin has risen 85% from its all-time lows against Bitcoin
Lee suggests that LTC/BTC could surge to 0.025 BTC, representing an increase of over 700%, during the next bullish cycle, citing Litecoin’s “higher throughput by design, scalability with extension blocks, enhanced fungibility, and privacy through MWEB [MimbleWimble].“
“I foresee an upside target of 10% (0.025 LTC/BTC). Achieving 5% (0.0125) in the next bull market should be feasible. I genuinely don’t anticipate it dropping much below 1% (0.0025) on the downside. The next halving is expected in approximately 92 days. This will be interesting.“
His comments came after Litecoin’s price rebounded by 85% from its record low of 0.001716 BTC in June 2022. LTC remains approximately 90% lower than its peak of 0.051 BTC from November 2013, primarily due to increasing competition within the altcoin sector.
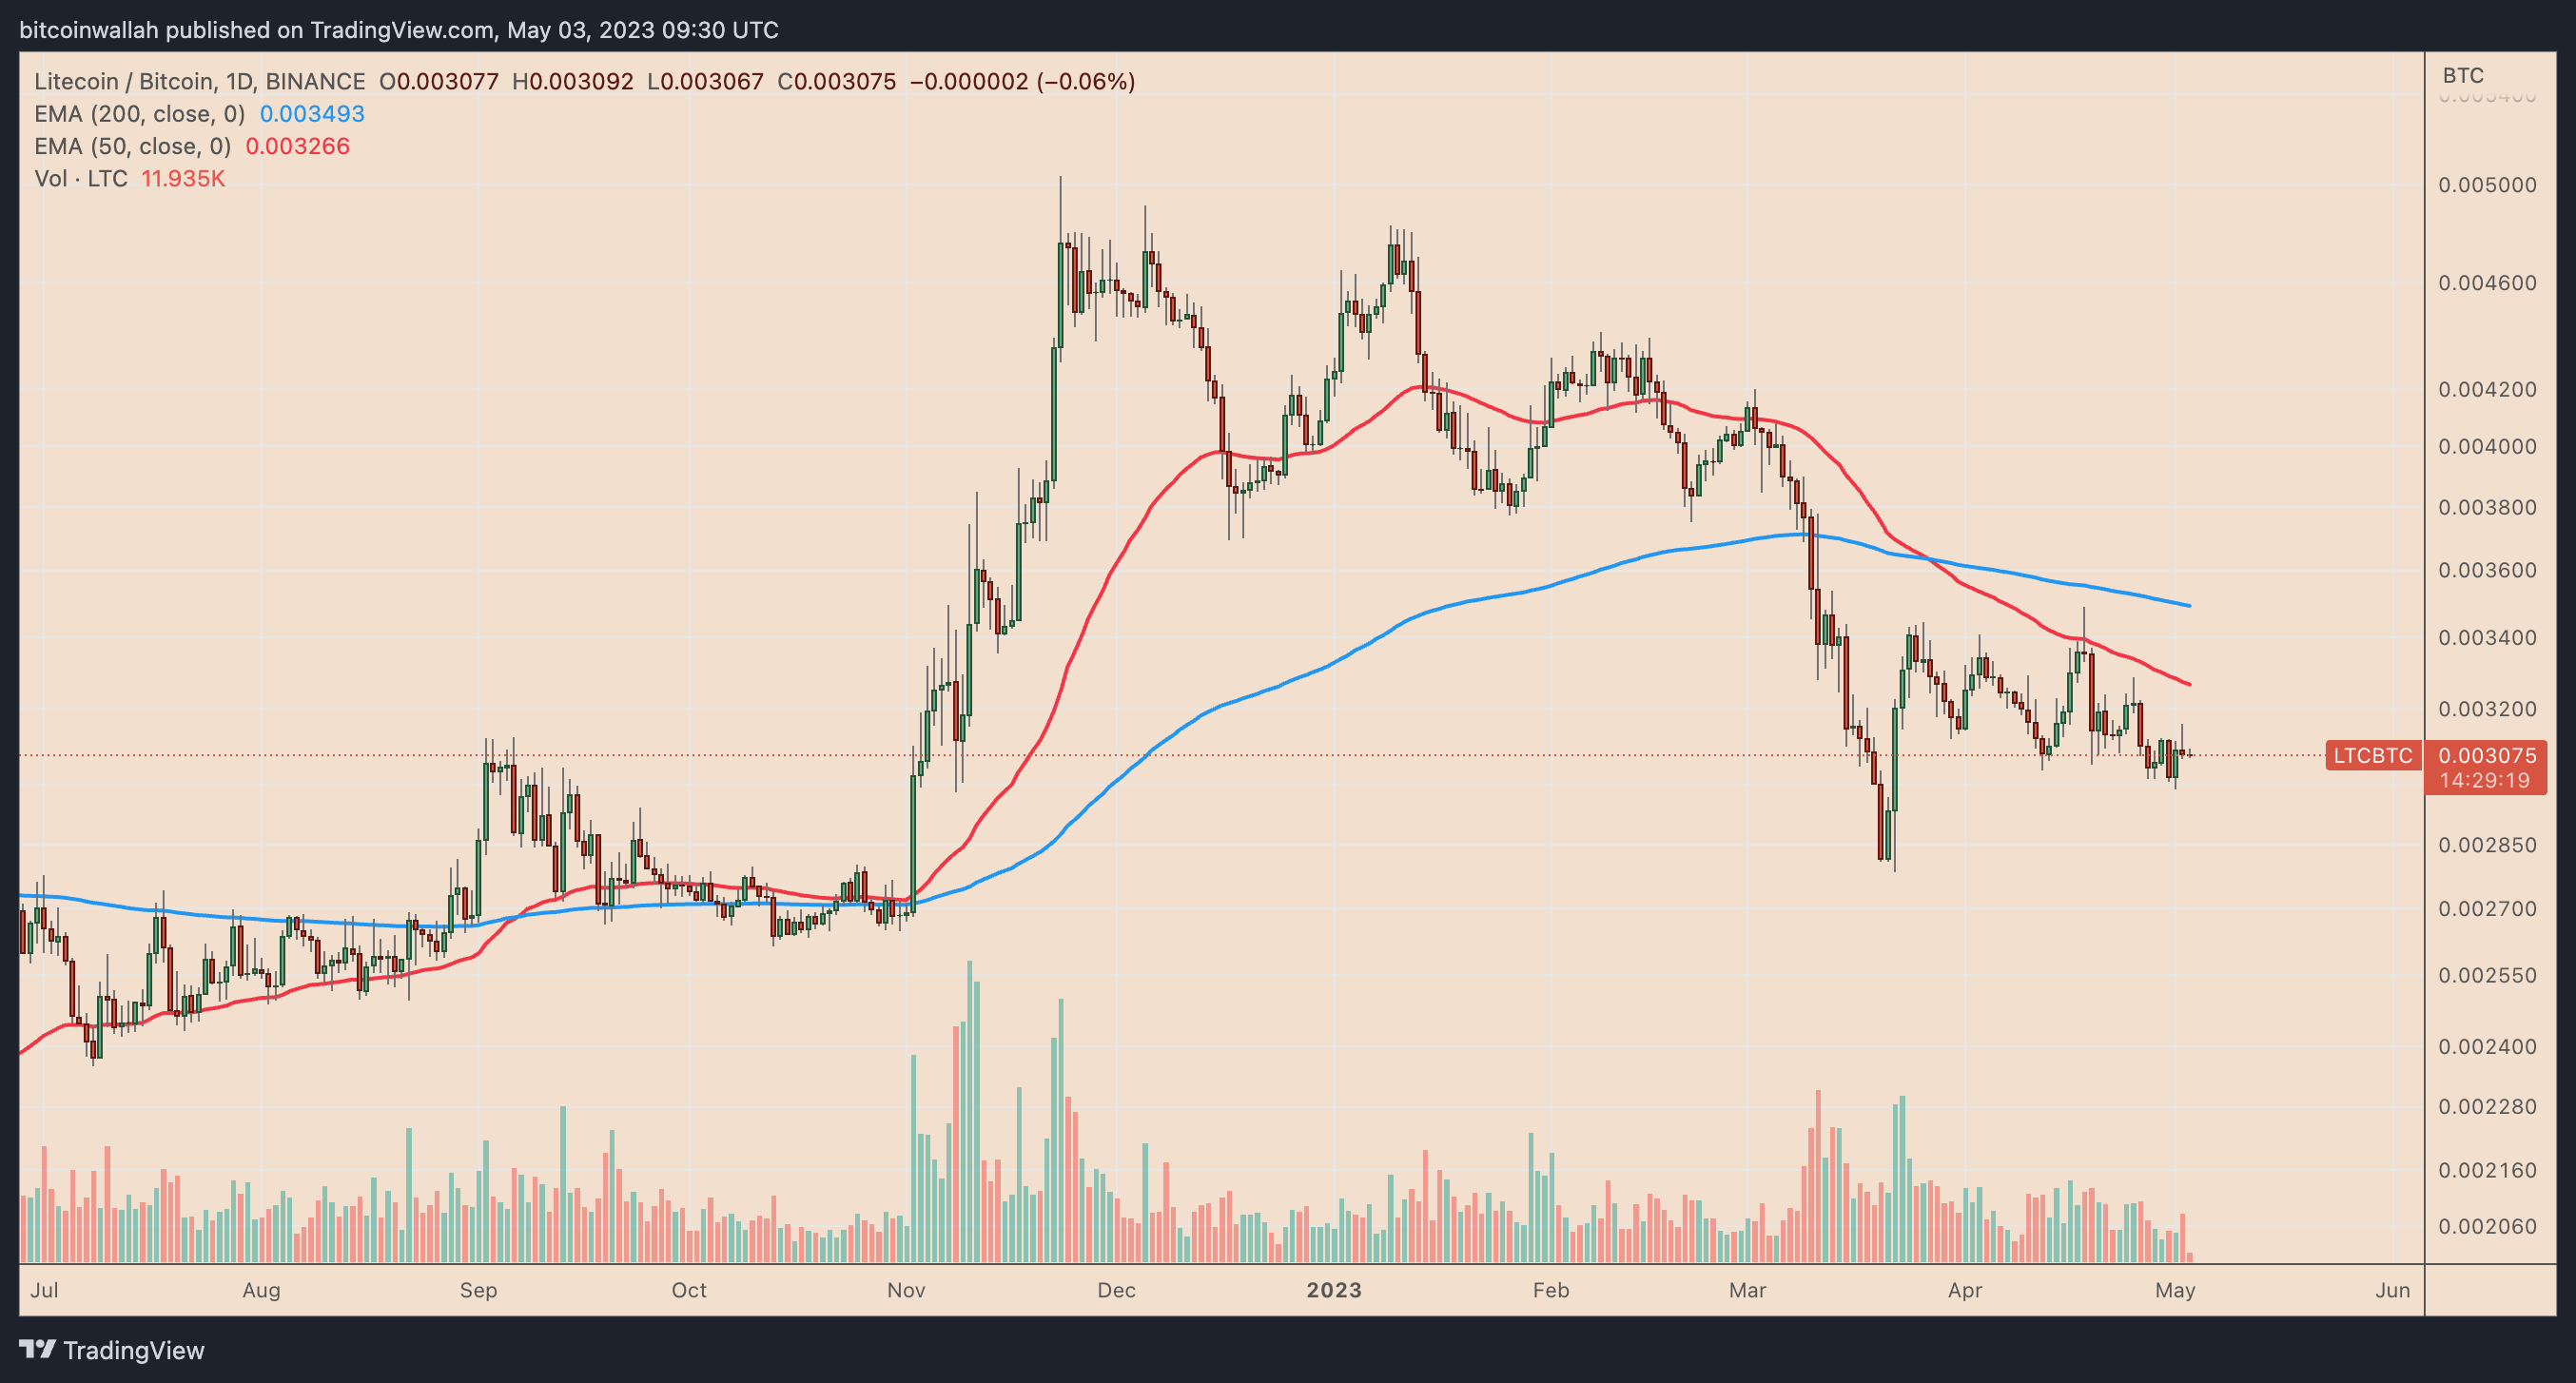 LTC/BTC daily price chart. Source: TradingView
Upcoming Litecoin halving
The recent recovery of LTC has been accompanied by heightened interest in its forthcoming block reward halving.
The block reward for miners will be reduced by 50%, from 12.5 LTC to 6.25 LTC, sometime in August 2023.
This reduction will lead to a 50% decrease in new LTC supply, which, theoretically, should increase scarcity in the market and subsequently elevate its price.
Historically, the months leading up to a Litecoin halving have prompted traders to accumulate LTC. For example, the first halving event in August 2015 was followed by a 450% price increase against Bitcoin.
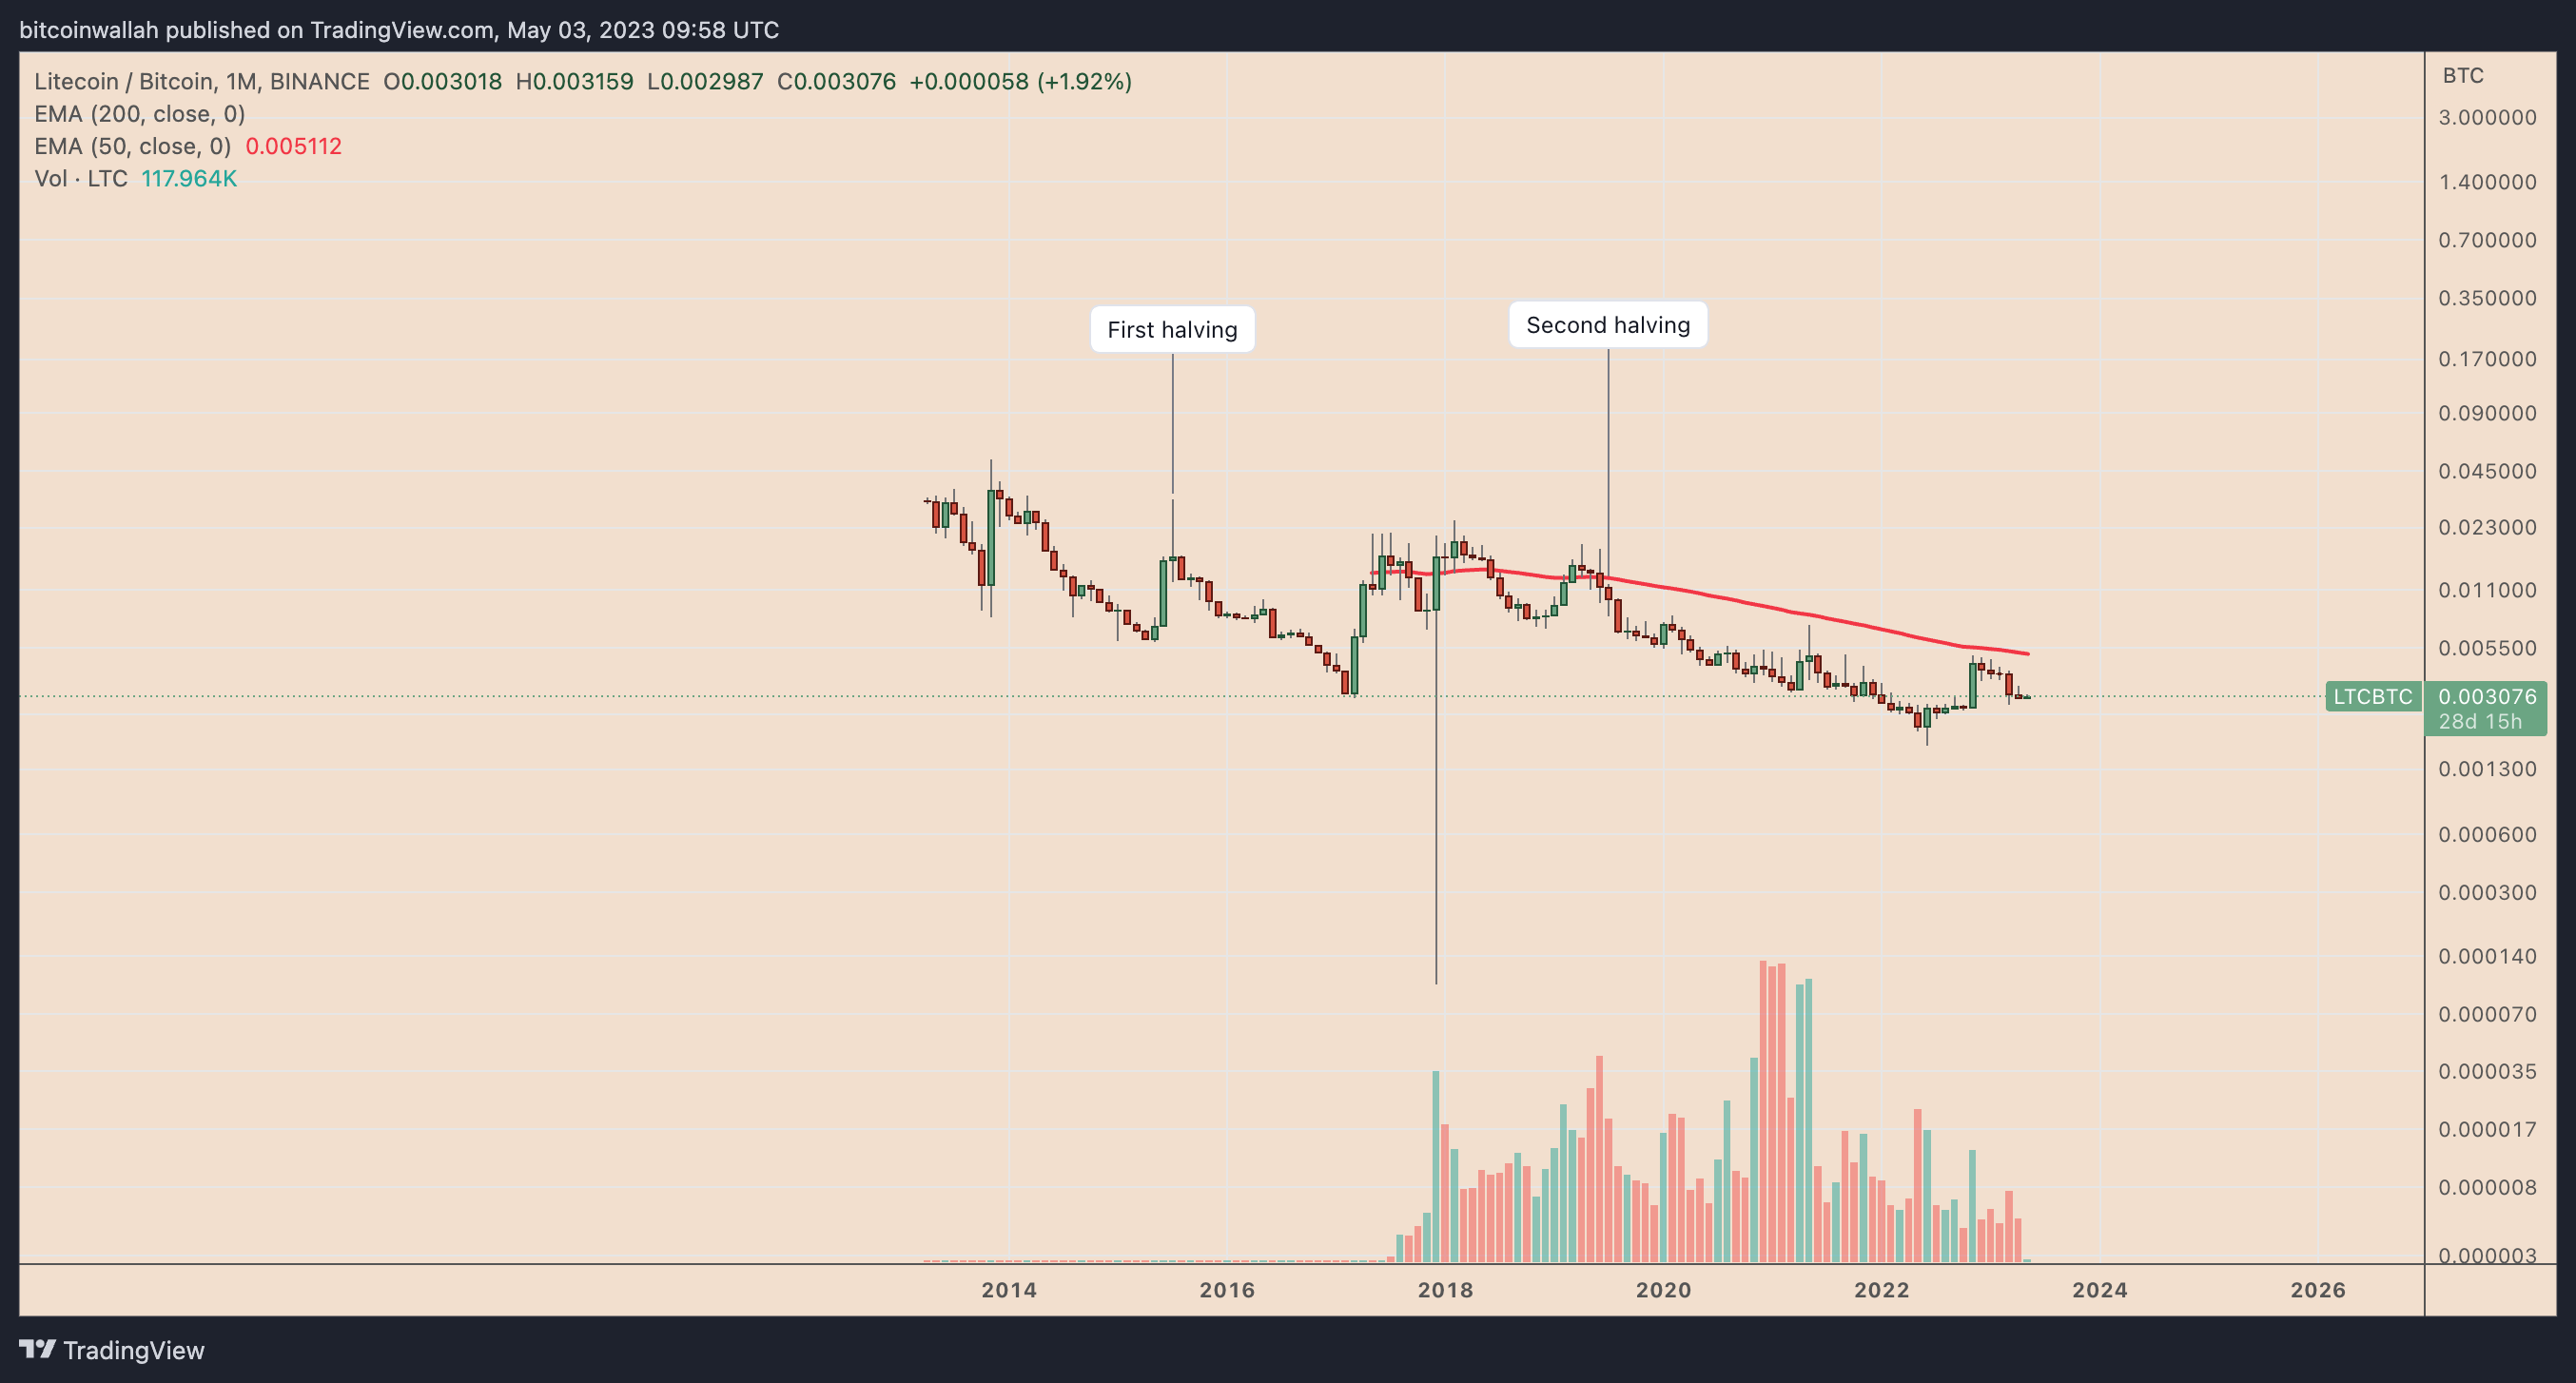
However, the period preceding the second halving saw minimal gains as Bitcoin’s dominance in the crypto market increased amid the U.S.-China trade conflict. Generally, LTC/BTC tends to decline sharply following halving events, which may also occur after August 2023.
Technical analysis of LTC price suggests a similar outcome, with LTC/BTC forming what appears to be a bear flag pattern, as illustrated below.
Related Posts
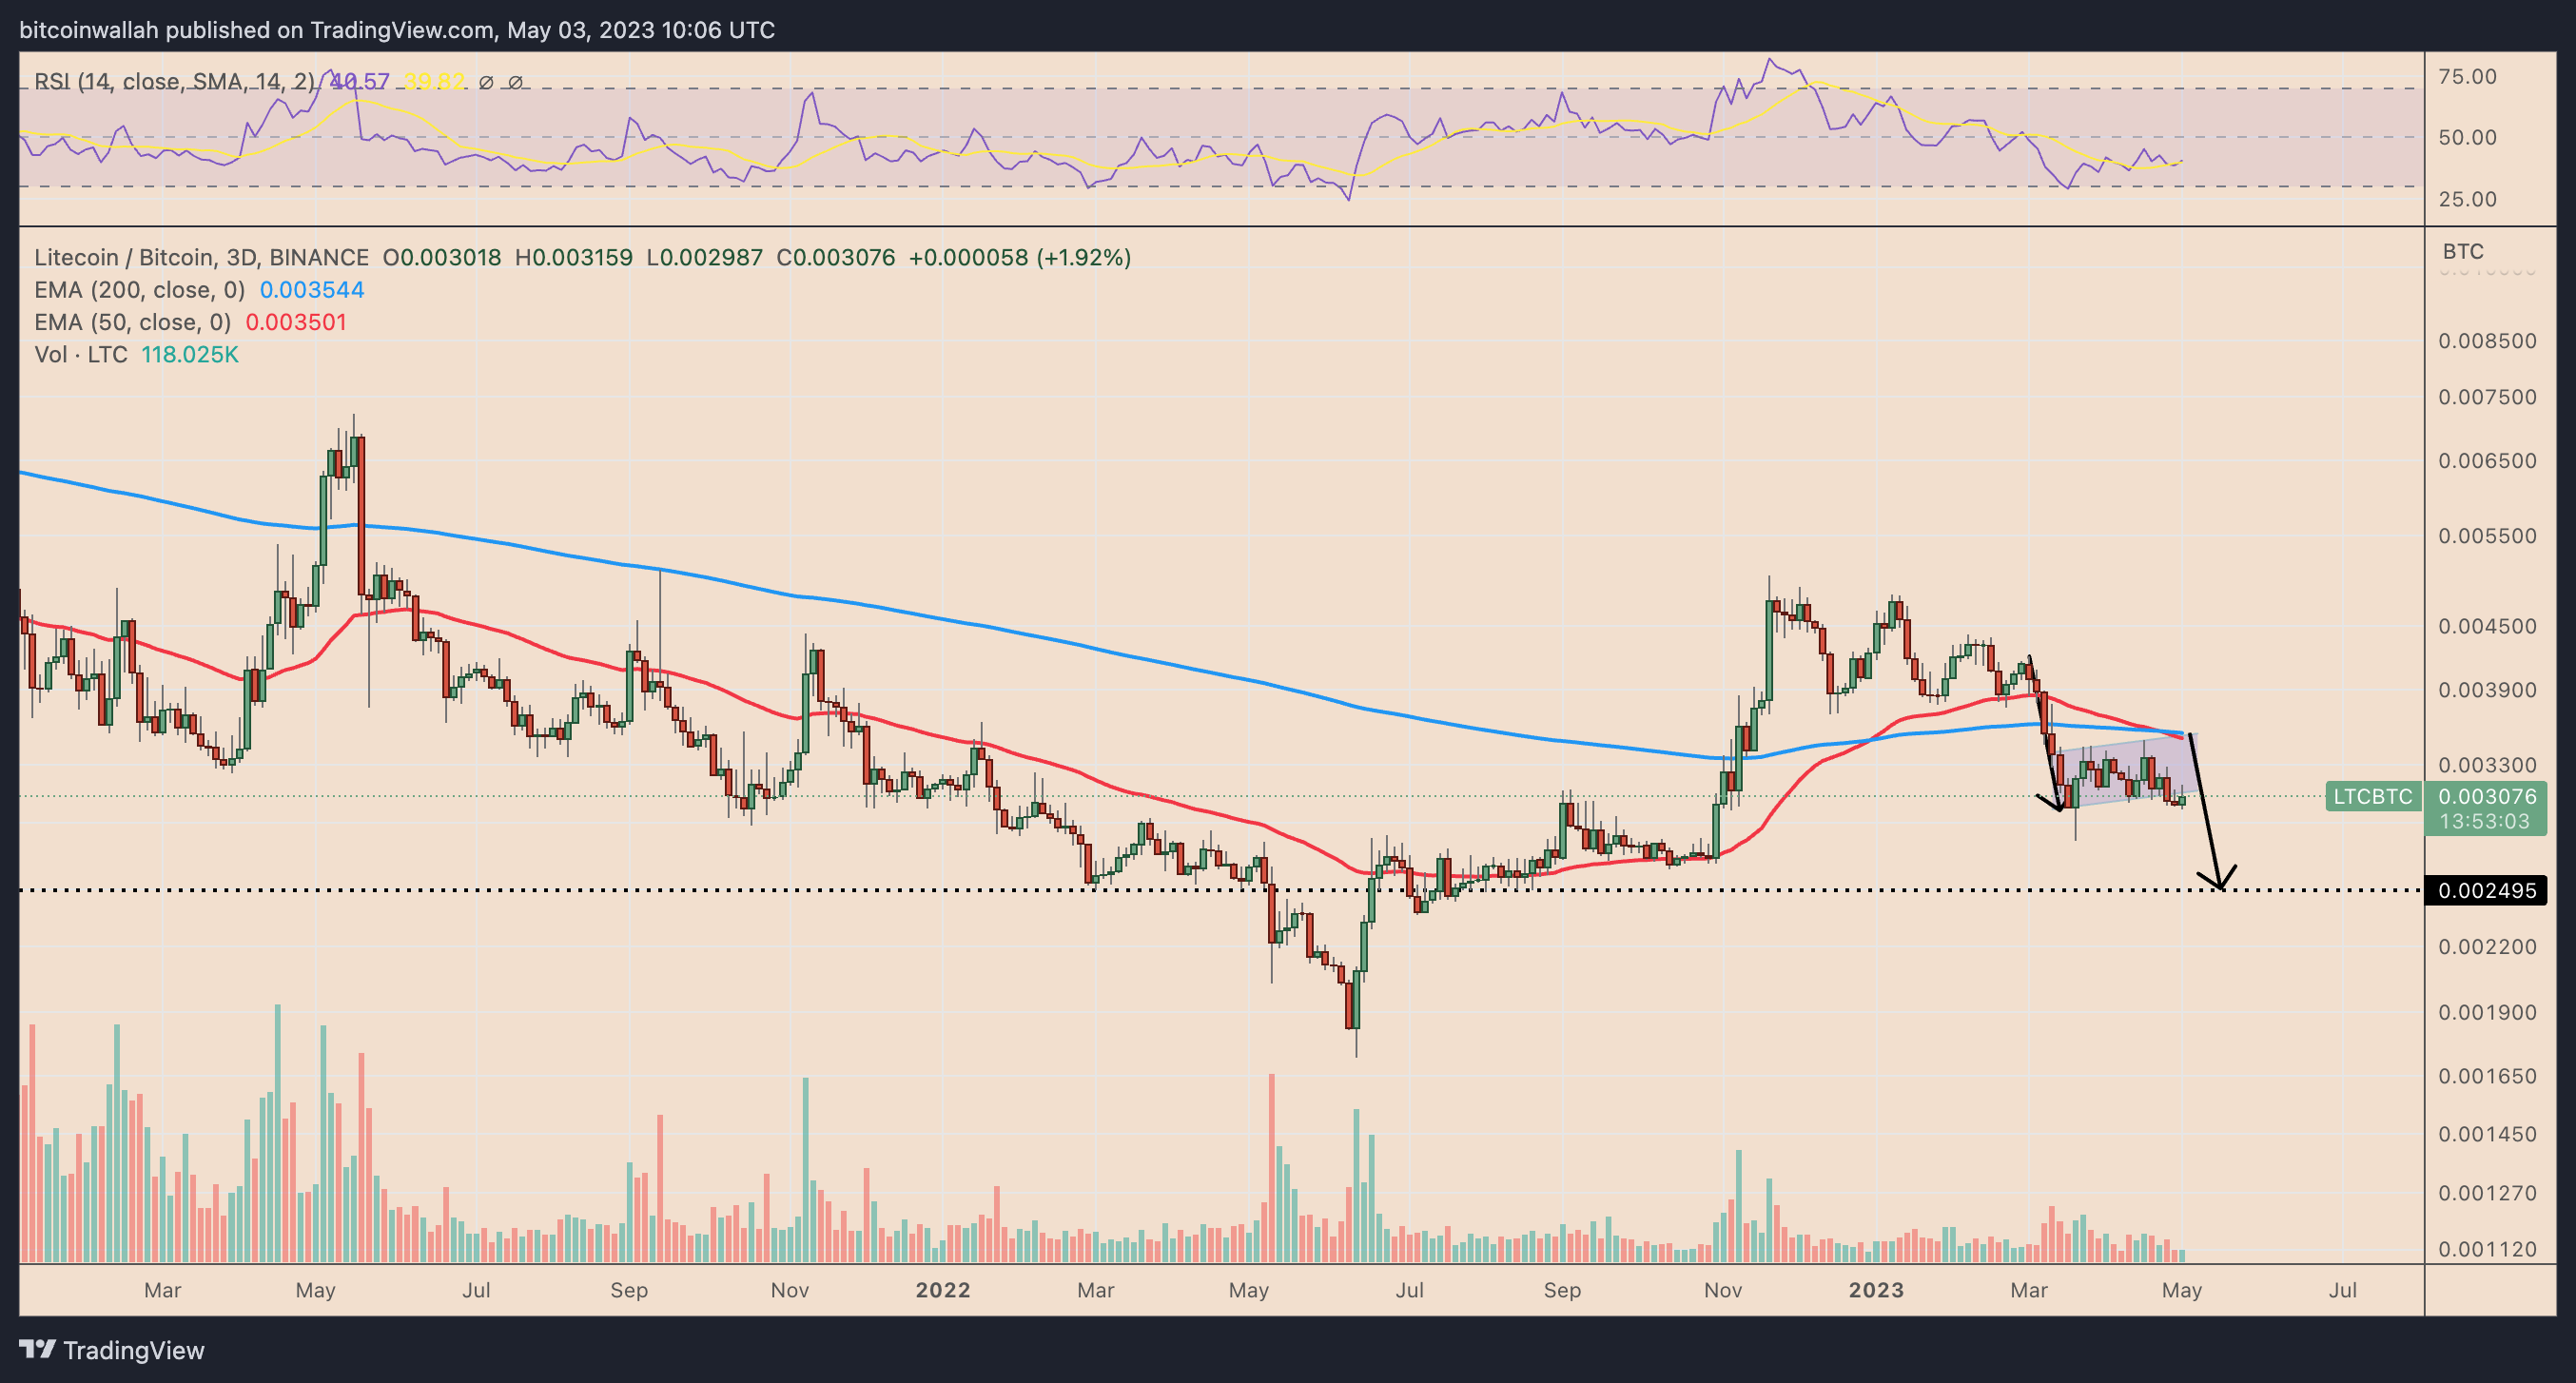 LTC/BTC three-day price chart. Source: TradingView
The pair may rebound towards the upper trendline of its bear flag, which aligns with the 50-3D exponential moving average (50-3D EMA; the red wave) near 0.0035 BTC ahead of the halving. However, the bear flag target is around 0.0024 BTC, representing a 20% decline from current price levels.
Could Litecoin reach $100 by June?
Litecoin has performed better against the U.S. dollar in the months leading up to its last two halvings. The price of LTC increased by approximately 250% before the first halving and by 500% before the second, when measured from their respective sessional lows.
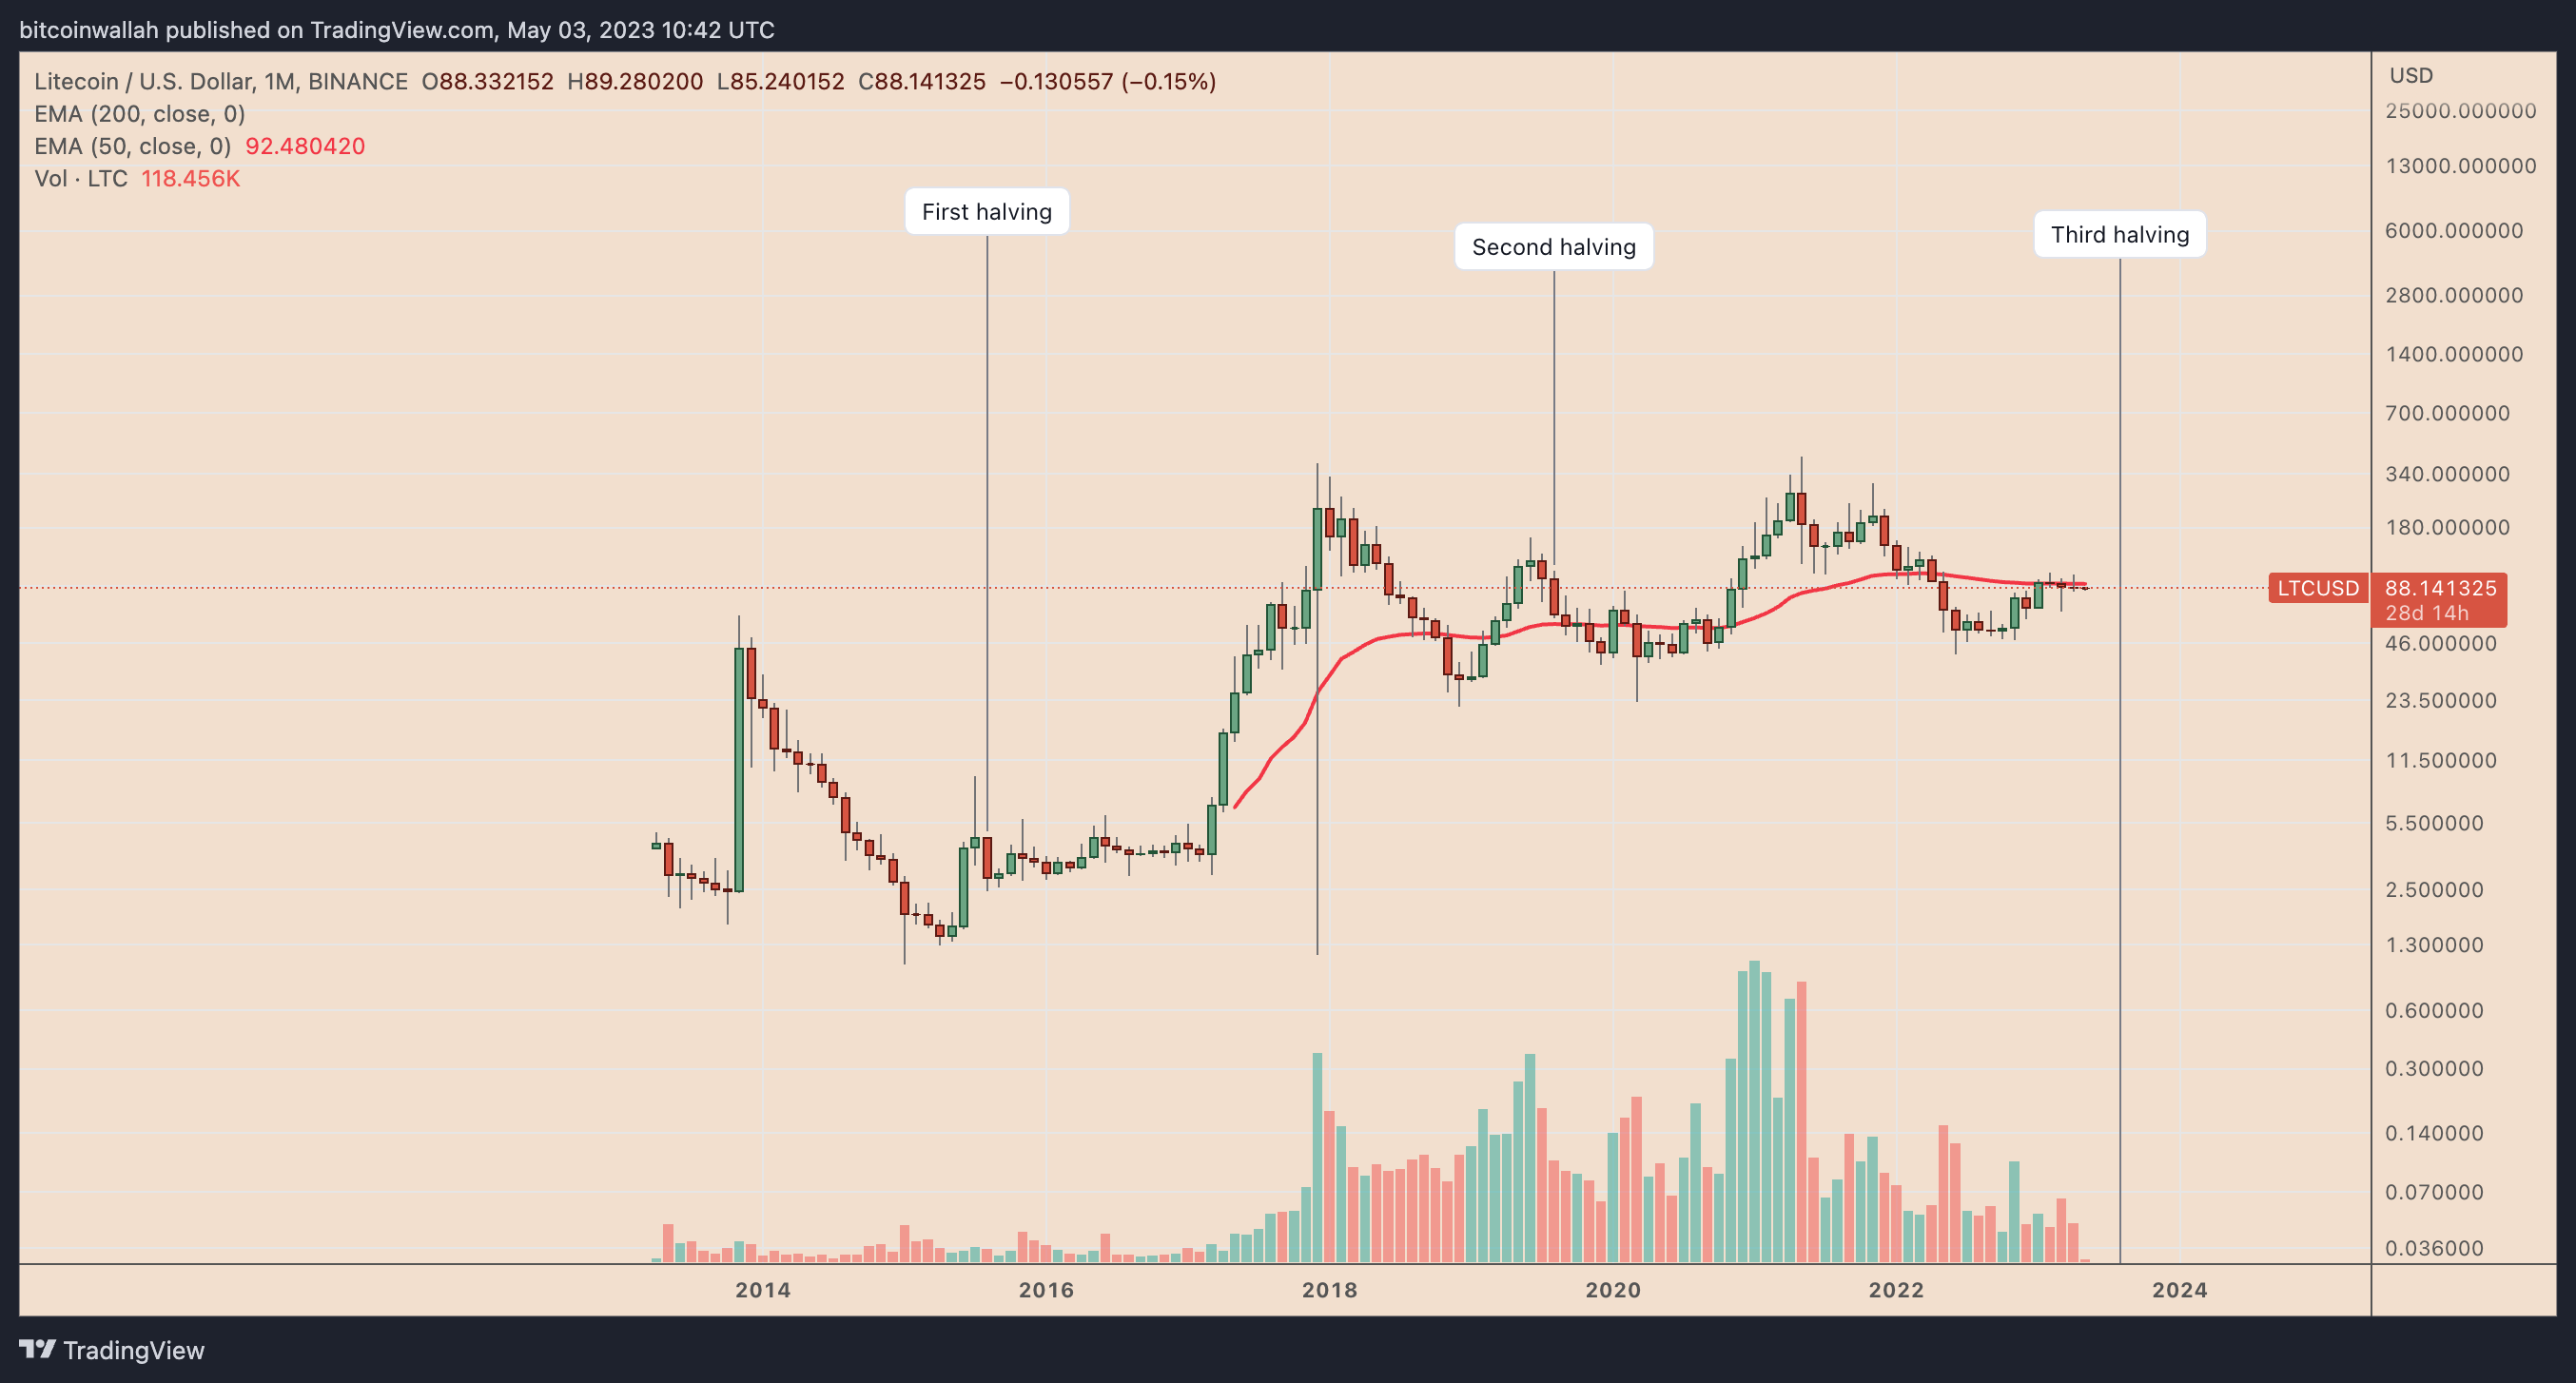 LTC/USD monthly price chart. Source: TradingView
Currently, LTC has experienced a similar upward trend ahead of the August halving, with a 120% increase from its sessional low of around $40. It may continue to rise in the upcoming months, supported by a combination of technical and on-chain indicators.
For instance, Litecoin is considered undervalued relative to its fair value, as indicated by Glassnode’s MVRV-Z score of -0.139.
Related: Why is Litecoin price up today?
The MVRV-Z score reflects the ratio between market and realized capitalization. A significantly higher market value compared to realized value historically signals a market peak (red zone), while the opposite suggests market bottoms (green zone), as depicted below.
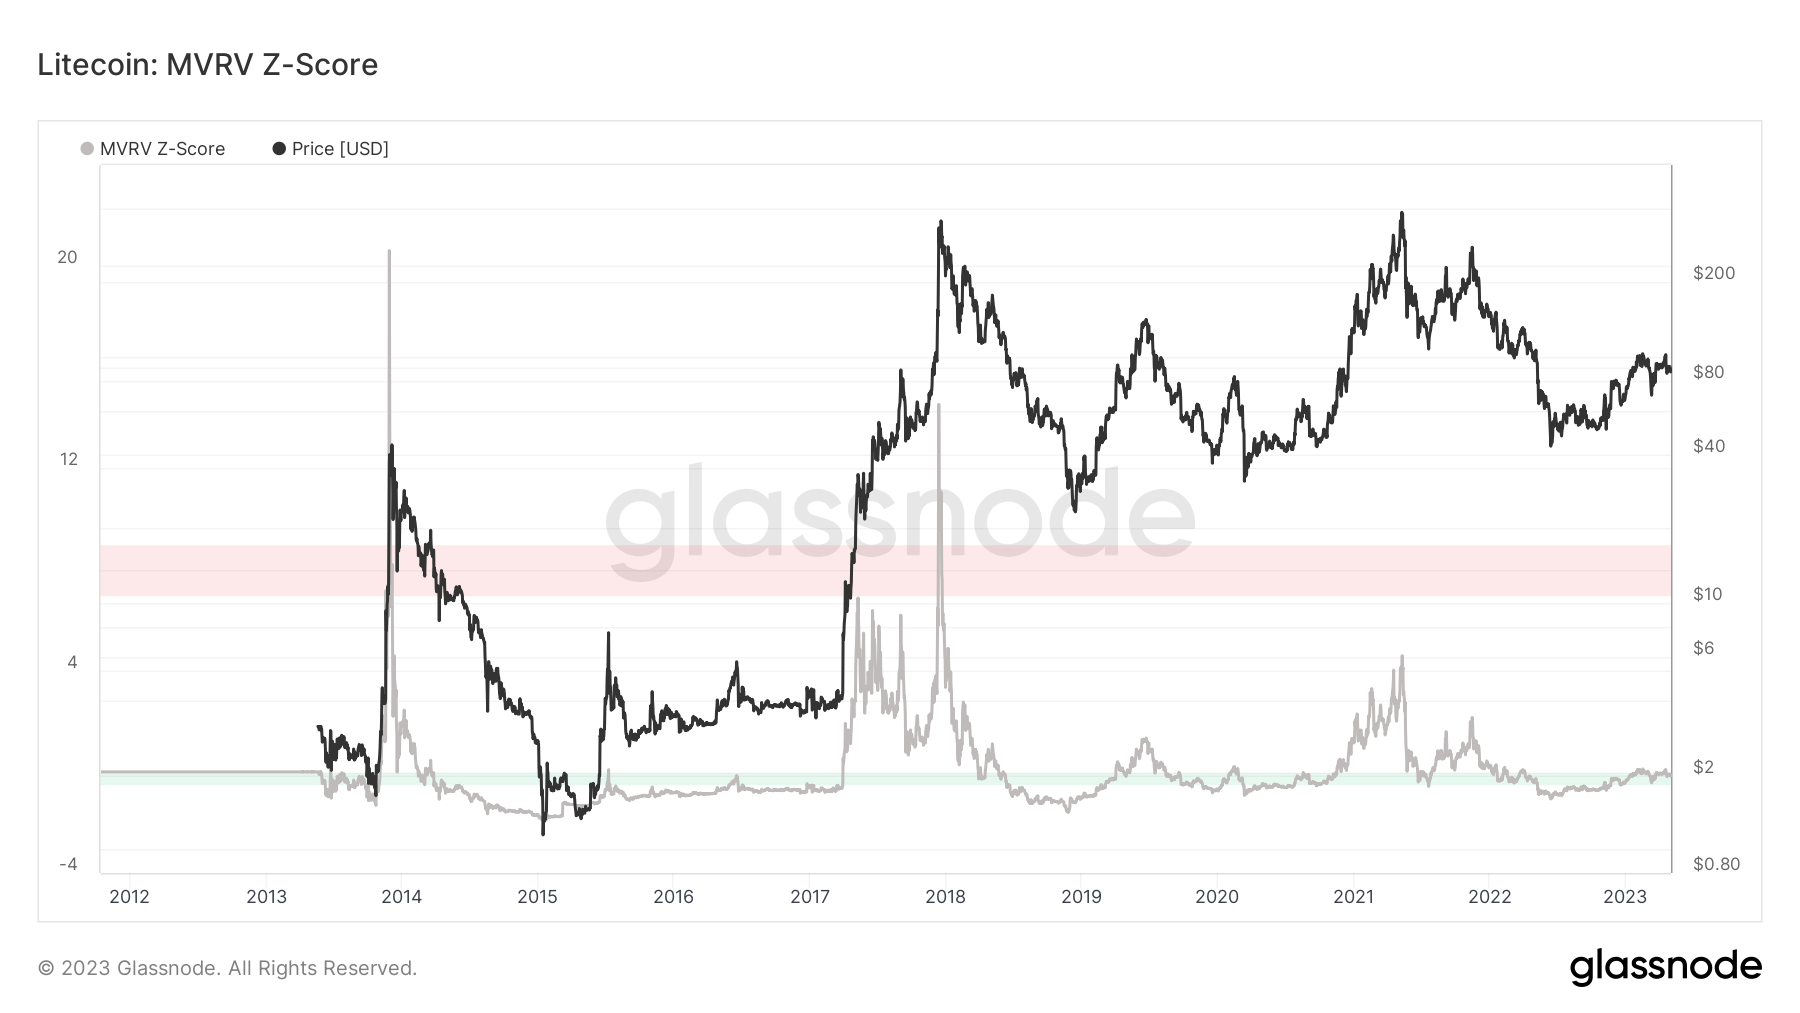 Litecoin MVRV-Z score. Source: Glassnode
Litecoin has entered the green zone, which often precedes strong bullish reversals.
From a technical perspective, LTC’s price is well-positioned for a rebound after testing its multimonth ascending trendline as support.
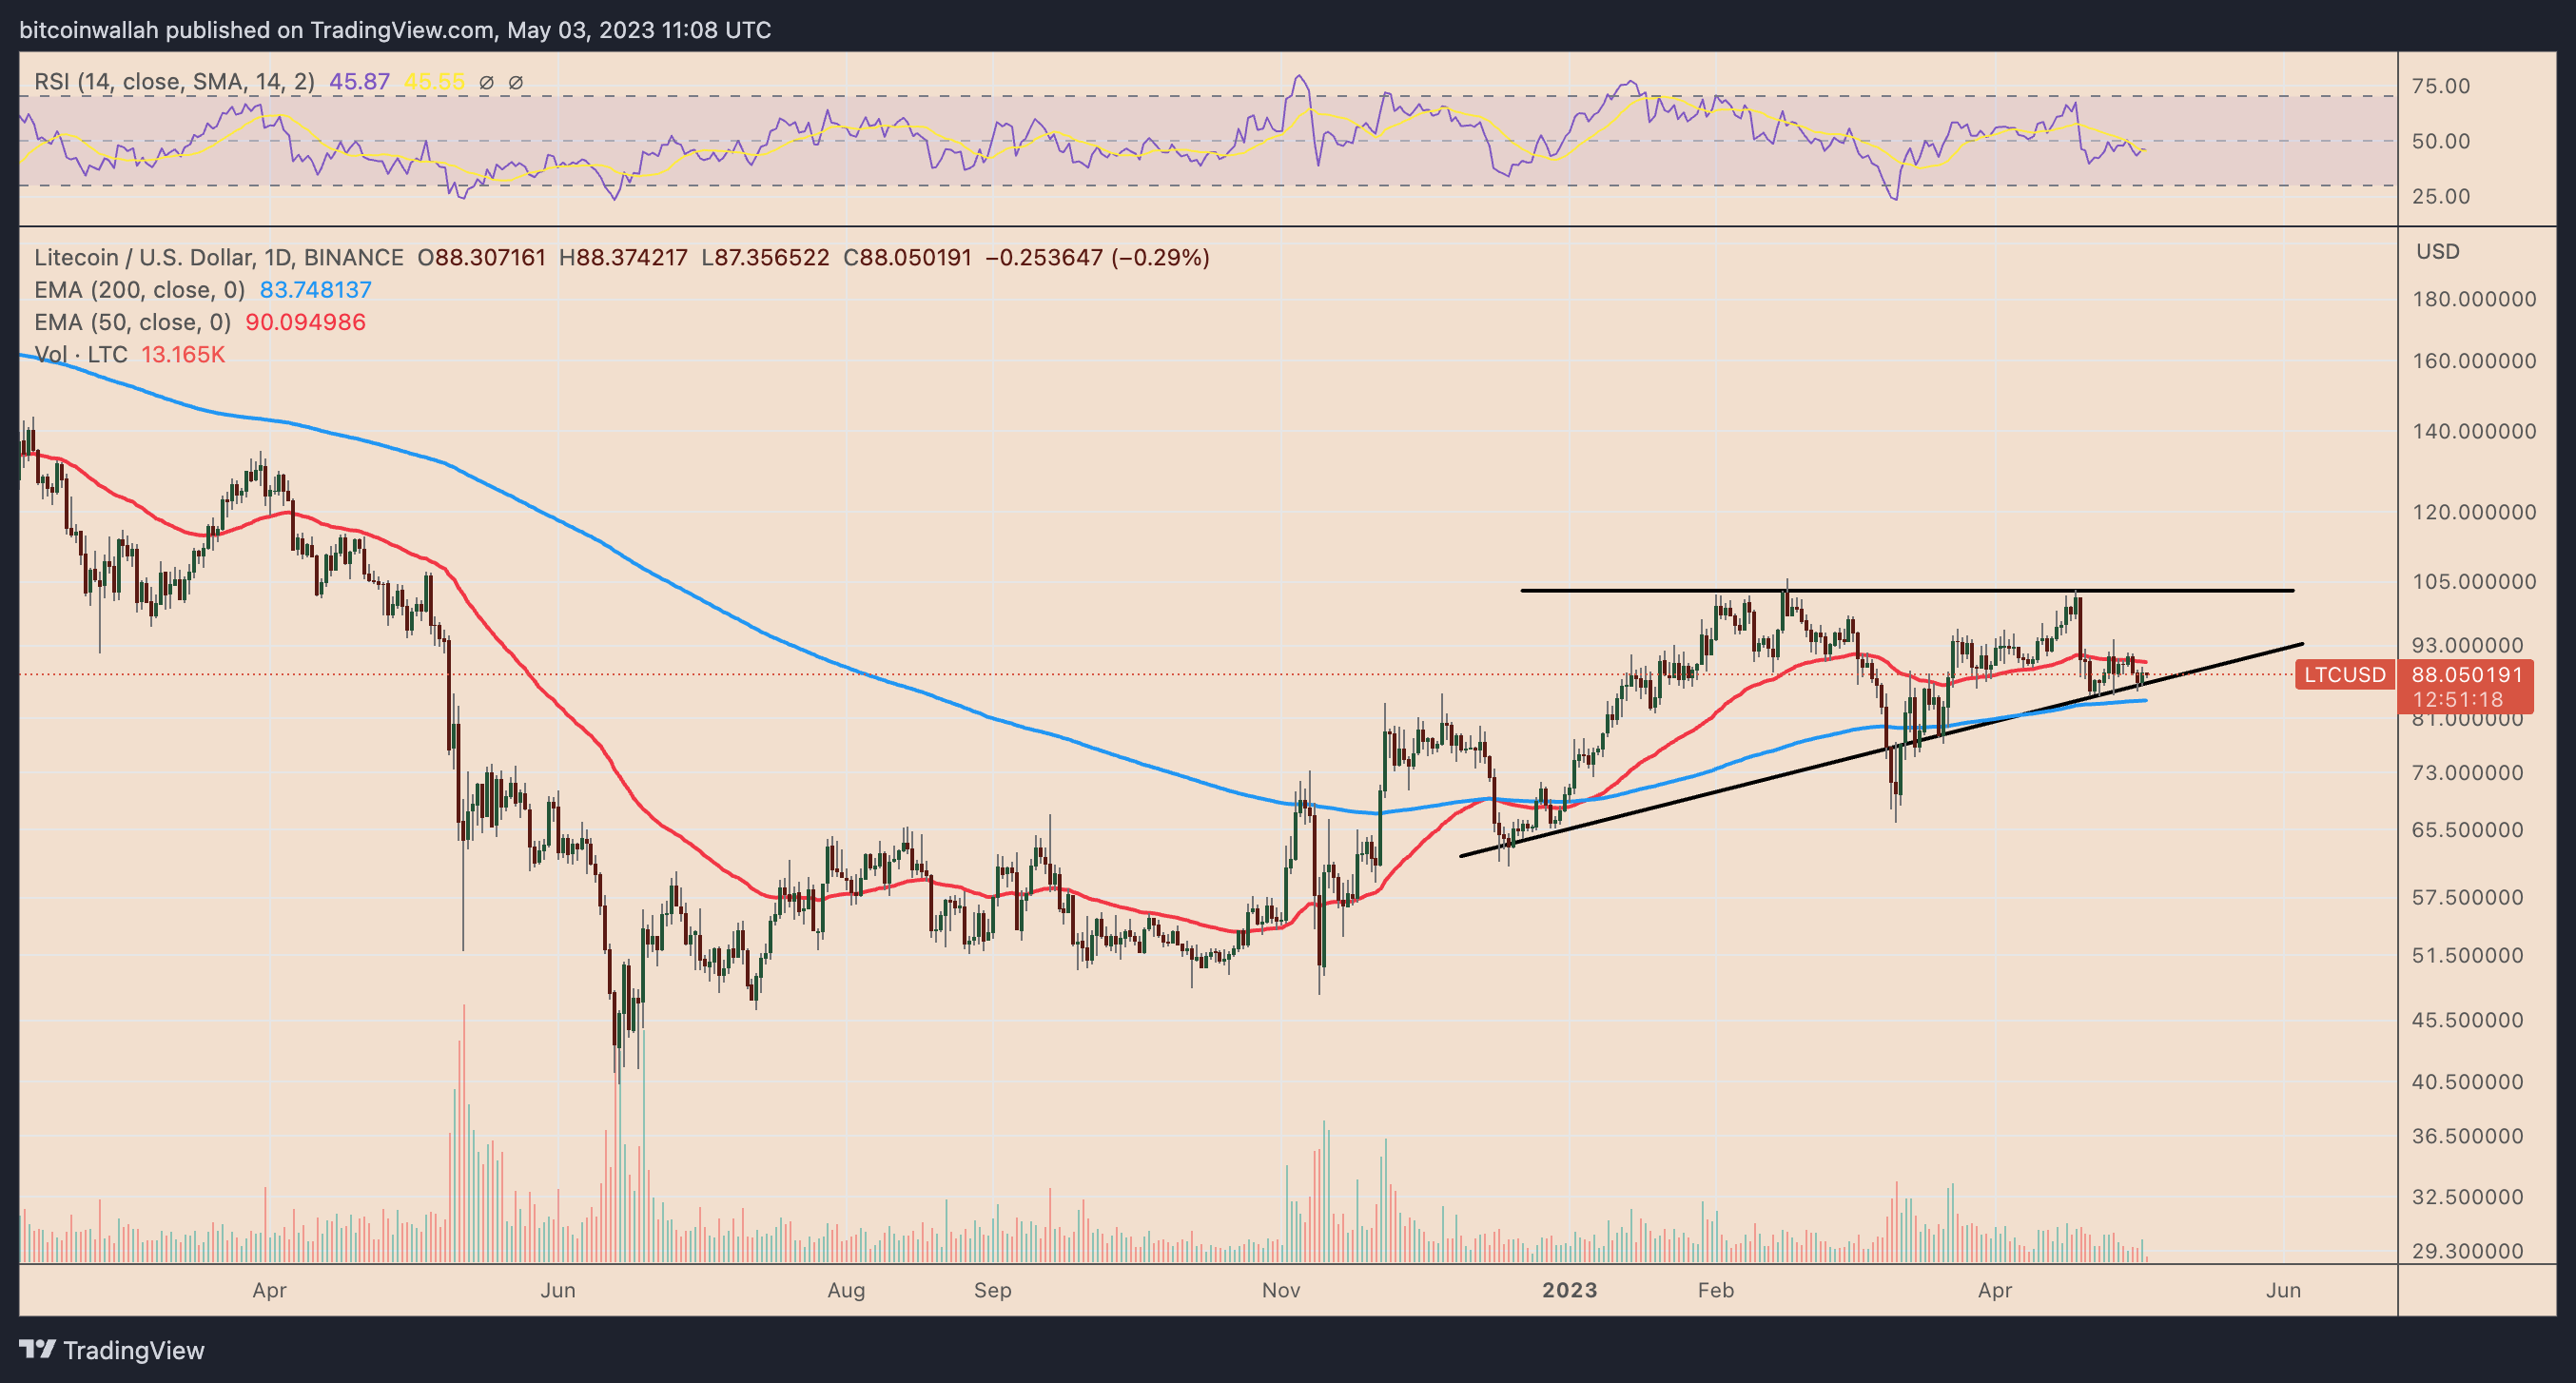 LTC/USD daily price chart. Source: TradingView
In this scenario, LTC/USD could rise towards its horizontal resistance level near $100, approximately 20% higher than current prices.
This article does not provide investment advice or recommendations. Every investment and trading decision carries risk, and readers should perform their own research before making a choice.