Disclaimer: Information found on CryptoreNews is those of writers quoted. It does not represent the opinions of CryptoreNews on whether to sell, buy or hold any investments. You are advised to conduct your own research before making any investment decisions. Use provided information at your own risk.
CryptoreNews covers fintech, blockchain and Bitcoin bringing you the latest crypto news and analyses on the future of money.

- Chainlink’s development activity sees a notable increase.
- LINK’s trading volume has risen by 2% despite bearish trends.
Chainlink, a prominent platform for Web3 services, is experiencing considerable enhancements to its network. Its GitHub development activity has notably increased this summer, elevating the asset into the top five most actively developed assets, as reported by Santiment.
The fourth quarter for Chainlink was characterized by a series of updates, with development activity rising from 25.88% in February to 31.25%.
Related Posts
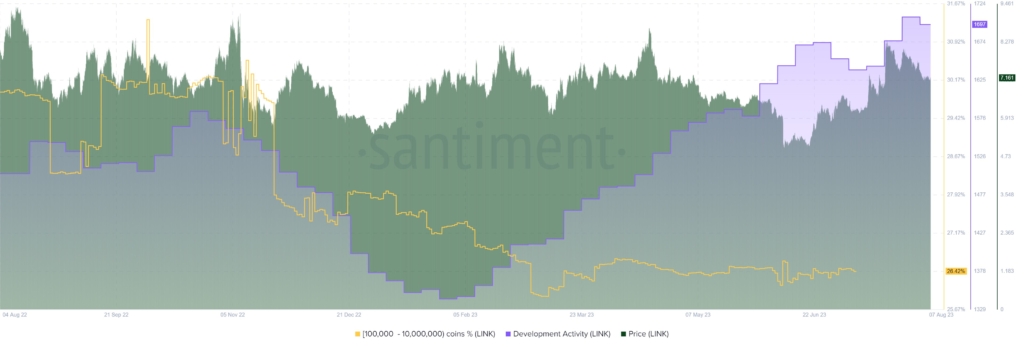 LINK development activity, Source: Sanbase
On July 17, the platform launched its Cross-Chain Interoperability Protocol (CCIP), designed to facilitate seamless integration between traditional financial institutions and various public and private blockchains. This initiative sparked a bullish rally, allowing Chainlink to reach a three-month peak.
Additionally, Chainlink Labs, the organization behind the leading Web3 services platform, revealed a collaboration with GitHub. As the largest AI-driven developer platform globally, GitHub will work with select startups within the Chainlink BUILD program.
Moreover, a significant trend is the accumulation of Chainlink tokens by whales and high-volume traders possessing between $100,000 and $10 million in LINK. This accumulation has reached its highest level since December 2022. In terms of trading volume, it has seen a 2.01% rise, now amounting to $132,300,234.
Meanwhile, as per CoinMarketCap‘s report, Chainlink’s native token, known as LINK, is currently valued at $7.16. After a 5.60% decline, the asset is experiencing bearish momentum, while its 50-day Simple Moving Average (SMA) is at $7.23.