Disclaimer: Information found on CryptoreNews is those of writers quoted. It does not represent the opinions of CryptoreNews on whether to sell, buy or hold any investments. You are advised to conduct your own research before making any investment decisions. Use provided information at your own risk.
CryptoreNews covers fintech, blockchain and Bitcoin bringing you the latest crypto news and analyses on the future of money.
Bitcoin (BTC) is poised to create two consecutive Doji candlestick formations on the weekly charts; however, a favorable indicator is that the price remains above the 20-week exponential moving average ($28,072). This implies that the bulls have maintained their influence.
Well-known pseudonymous trader TechDev utilized the three-week timeframe to illustrate that Bitcoin’s consolidation above the 20-period moving average is nearing levels observed only four times since Bitcoin’s inception. Notably, on all three prior occasions, the expansions occurred in an upward direction, indicating that historical trends favor the bulls.
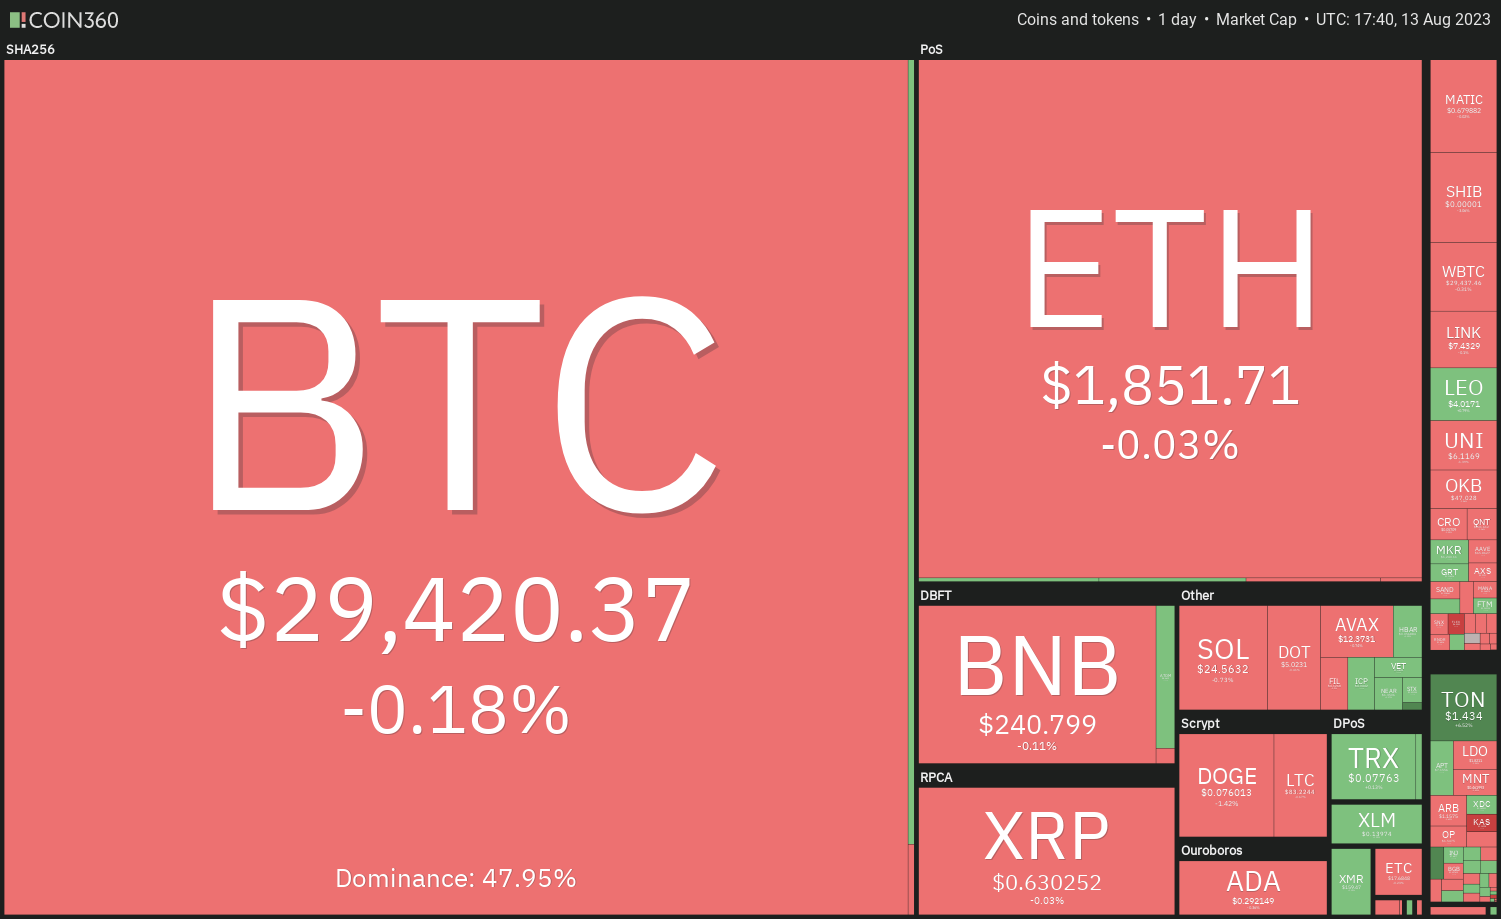 Crypto market data daily view. Source: Coin360
Nevertheless, in the short term, the absence of volatility has led Bitcoin futures trading volumes to reach their lowest point since December 2022. Cointelegraph contributor Marcel Pechman suggests this indicates that traders may have redirected their focus to other markets or are hesitant to make moves at the current price levels.
While numerous altcoins are looking to Bitcoin for guidance, some have shown stronger performance recently. Let’s analyze the charts of the top five cryptocurrencies that appear promising in the coming days.
Bitcoin price analysis
Bitcoin has been trading close to the 20-day EMA ($29,447) for the last two days, reflecting uncertainty between the bulls and the bears.
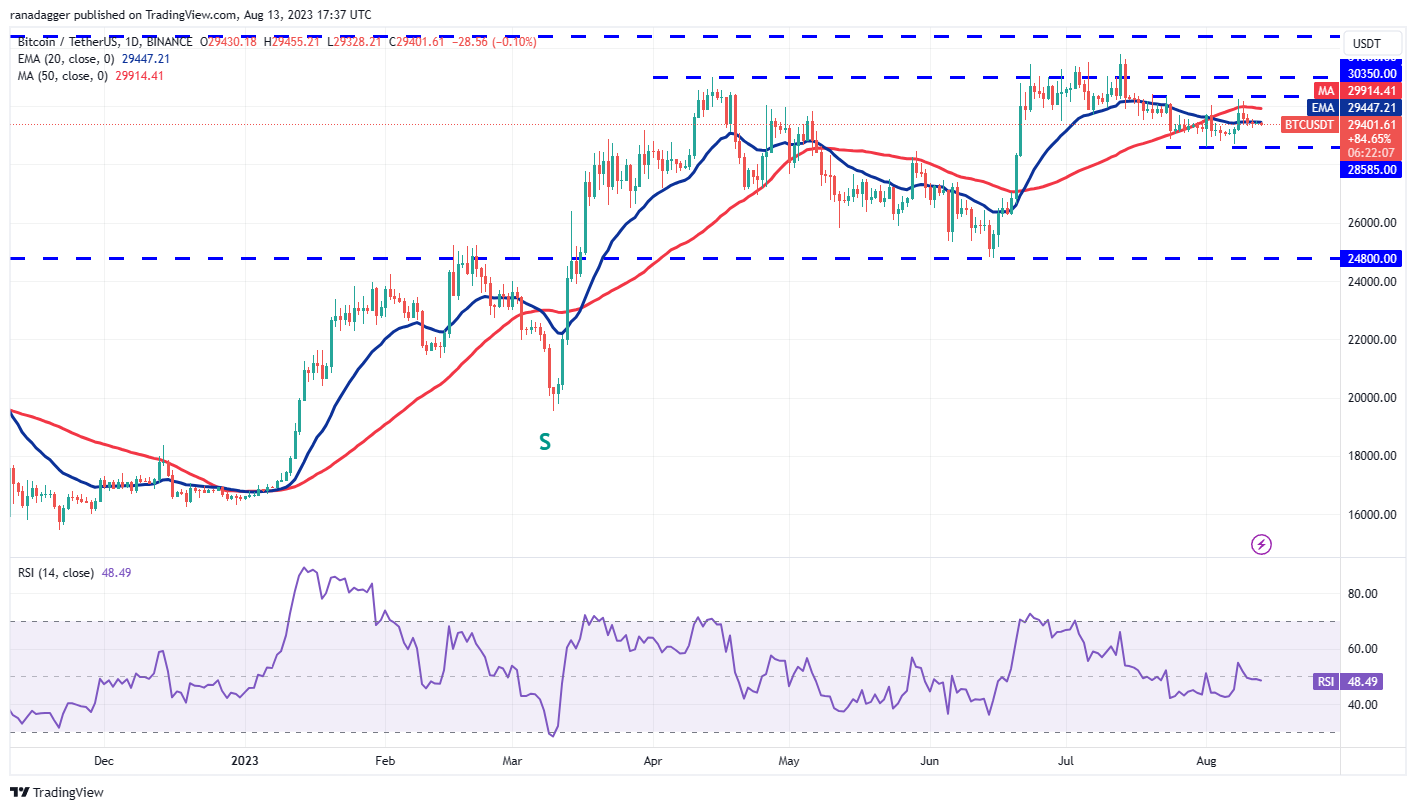 BTC/USDT daily chart. Source: TradingView
The flat moving averages and the relative strength index (RSI) hovering around the midpoint do not provide a definitive advantage to either the bulls or the bears. This could keep the BTC/USDT pair confined within the $28,585-to-$30,150 range for some time.
The next significant movement is expected to commence once the price breaks free from this range. Should the price fall below $28,585, selling pressure could increase, potentially driving the pair down to $26,000.
Conversely, a breakout and close above $30,150 may entice buyers. The pair could then rally toward the $31,804-to-$32,400 resistance area.
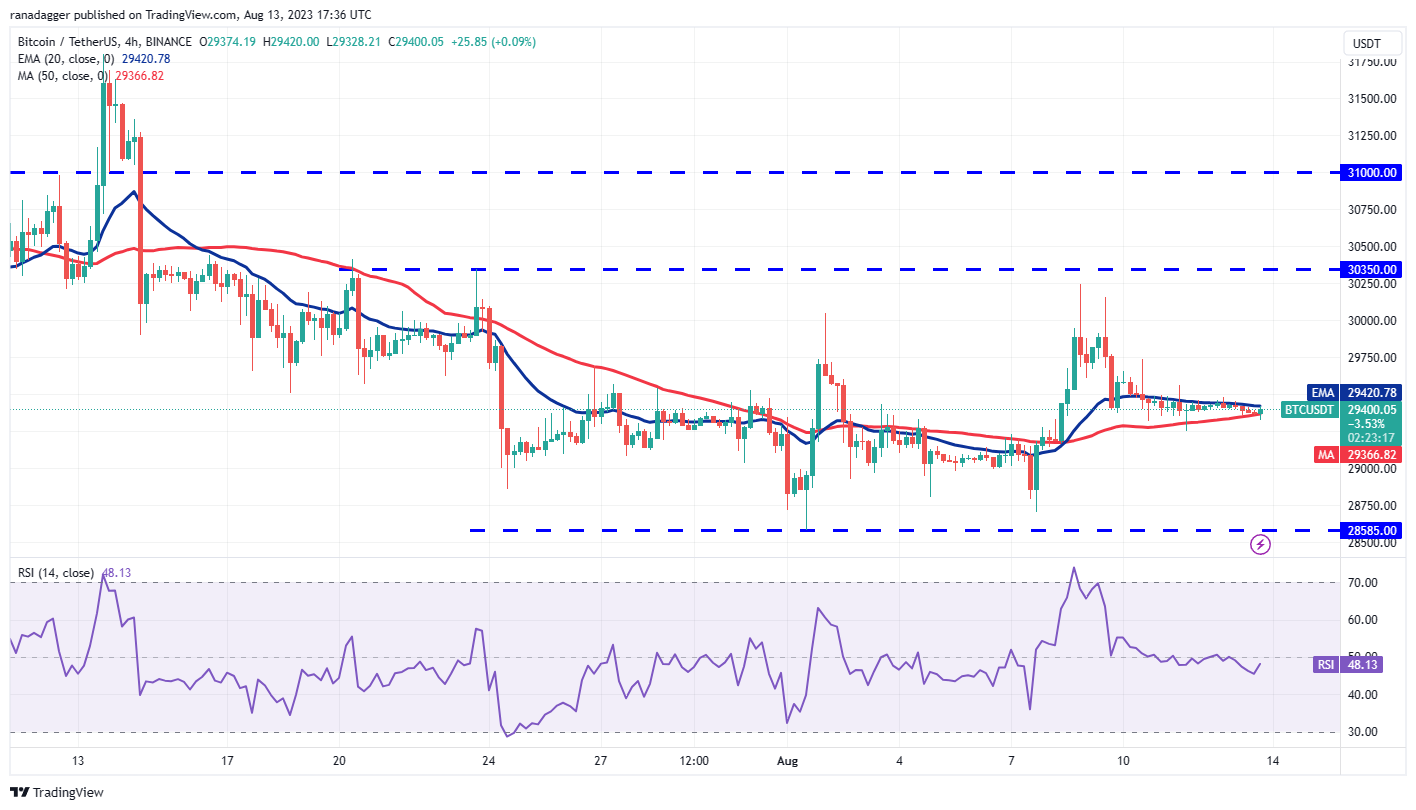 BTC/USDT four-hour chart. Source: TradingView
The four-hour chart indicates that the price is caught between the moving averages, suggesting uncertainty regarding the next significant movement. If the price closes below the 50-day simple moving average, the short-term advantage will shift toward the bears. This could pull the price down to $29,000 and subsequently to $28,585.
If the price rebounds and breaks above the 20-day EMA, it will indicate that the bulls are attempting to take control. The pair may initially rise to $29,738, and if this resistance is surpassed, the rally could extend to the overhead resistance at $30,350.
Shiba Inu price analysis
Shiba Inu (SHIB) is experiencing a robust recovery, but buyers are encountering resistance near the overhead level at $0.000012.
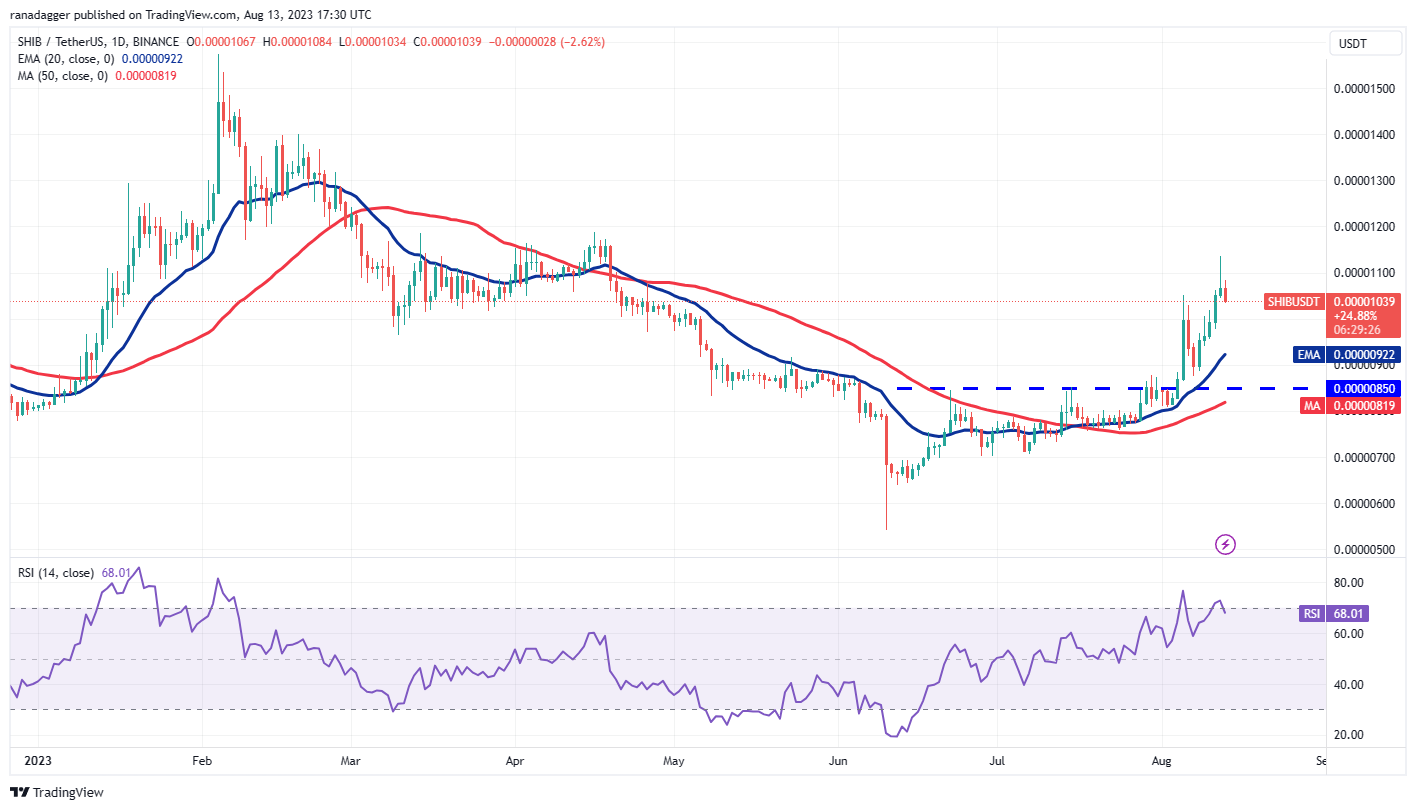 SHIB/USDT daily chart. Source: TradingView
The rising 20-day EMA ($0.000009) and the RSI near the overbought territory suggest that bulls are in control. If buyers maintain their position near the overhead resistance, it will improve the chances of a breakout above $0.000012. If successful, the SHIB/USDT pair could surge to $0.000014 and then to $0.000016.
On the other hand, if the price declines below $0.000010, the pair may continue its pullback toward the 20-day EMA. This level is crucial to monitor, as a breach below it may indicate the end of the recovery.
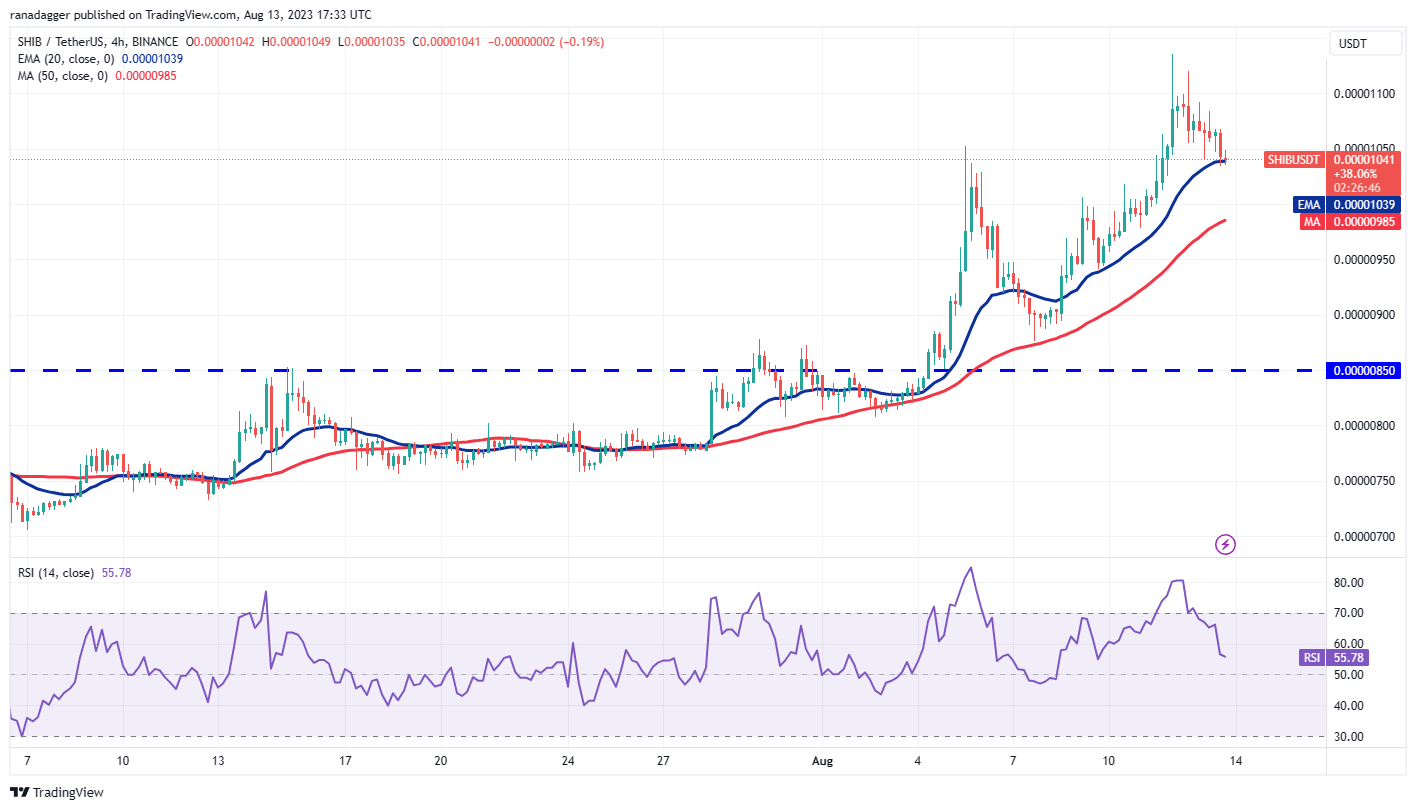 SHIB/USDT four-hour chart. Source: TradingView
The four-hour chart reveals that the price has retraced to the 20-day EMA. The bulls are anticipated to defend this level vigorously. If they succeed, the pair may once again attempt to break and hold above the overhead resistance at $0.000011.
If the price declines and remains below the 20-day EMA, it will indicate that the bulls are losing their strength. The pair may then fall to the next significant support at the 50-day SMA, where aggressive buying by the bulls may occur.
Uniswap price analysis
Uniswap (UNI) bounced off the 50-day SMA ($5.79) on Aug. 7 and climbed above the 20-day EMA ($6.09) on Aug. 8. This indicates that buyers are active at lower price levels.
Related Posts
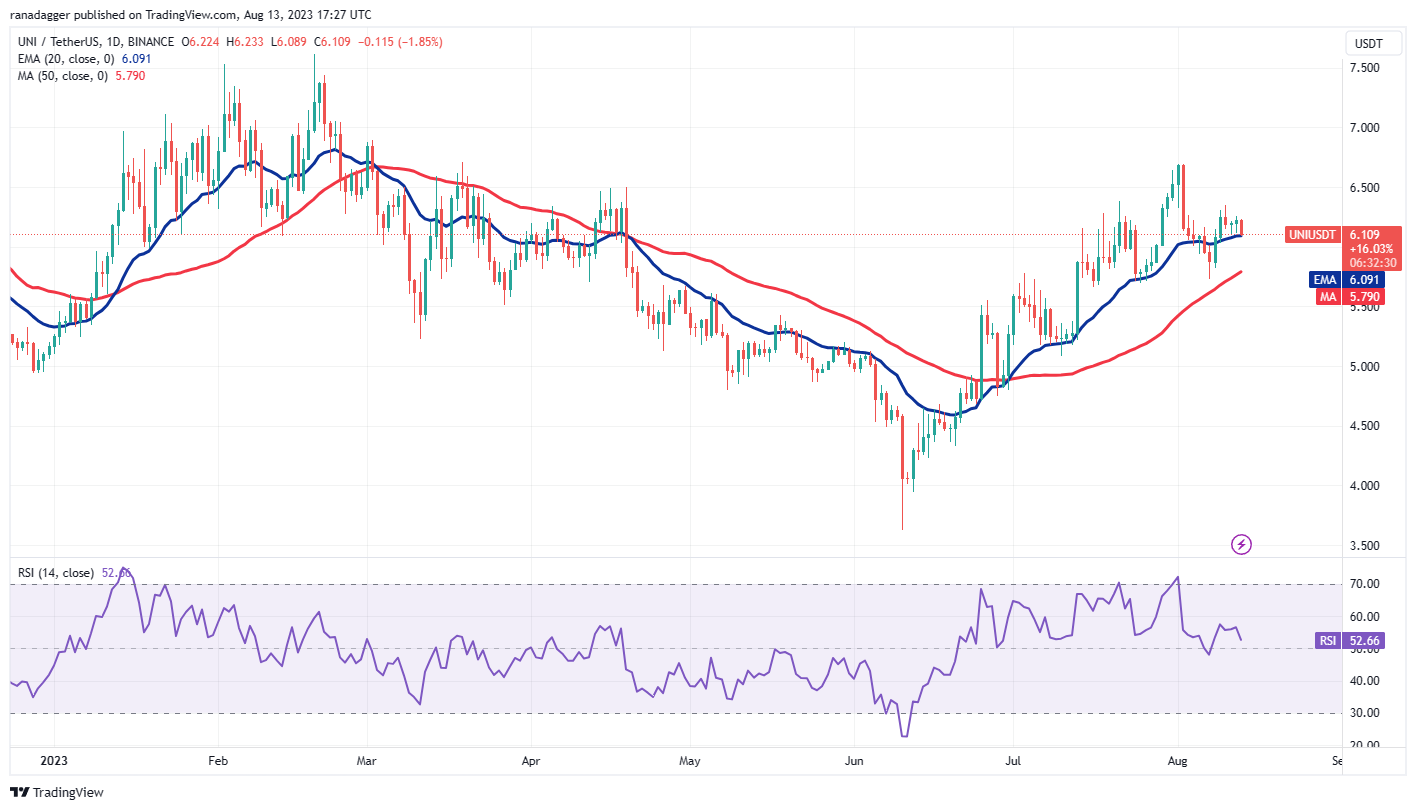 UNI/USDT daily chart. Source: TradingView
The UNI/USDT pair is facing a challenging struggle near the 20-day EMA, suggesting that the bears are still in the fight. If the price remains below the 20-day EMA, selling pressure could escalate, potentially leading the pair down to the 50-day SMA.
Alternatively, if the price rebounds from the 20-day EMA, it will indicate that the bulls are attempting to convert this level into support. If they succeed, the pair may rise above the immediate resistance at $6.35 and reach $6.70.
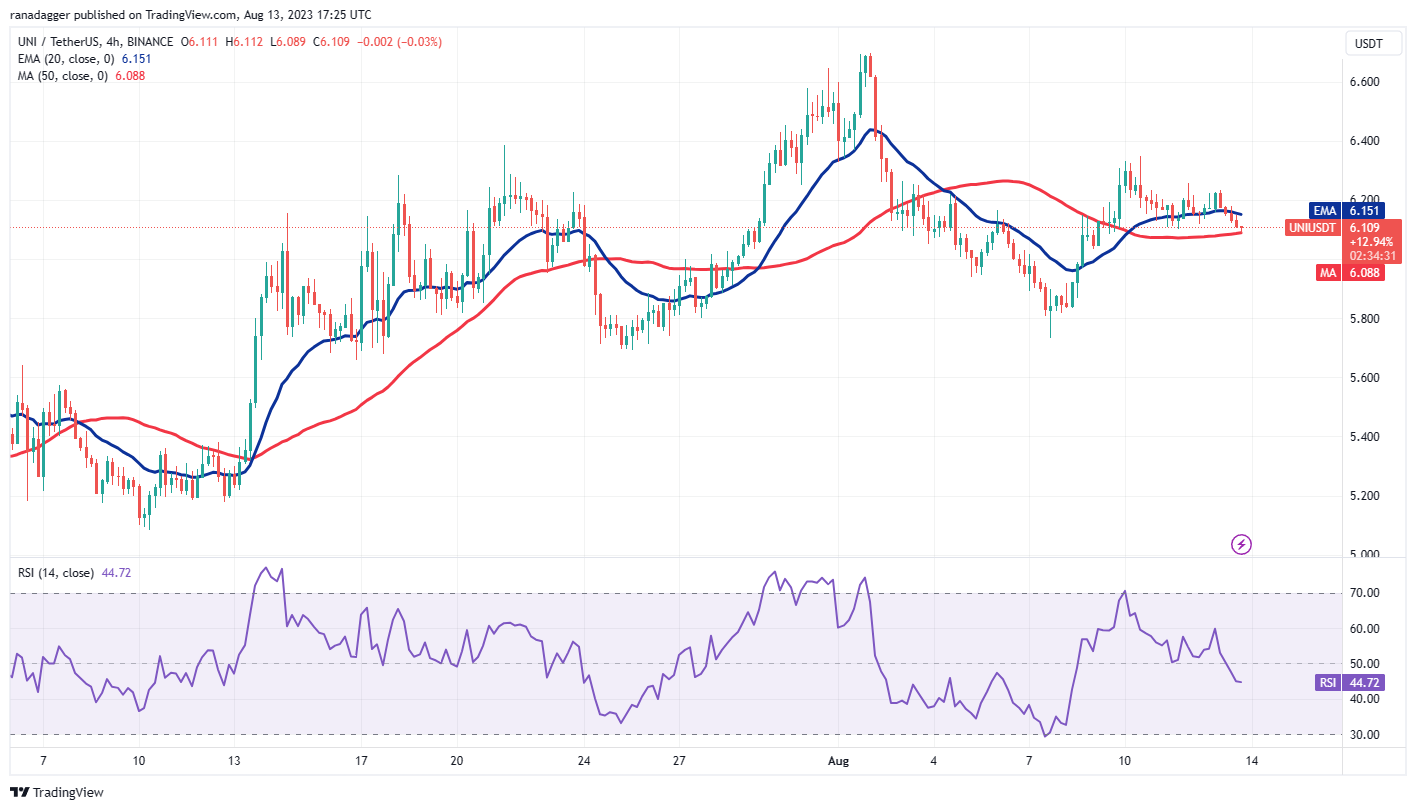 UNI/USDT four-hour chart. Source: TradingView
Both moving averages have leveled off on the four-hour chart, indicating a balance between supply and demand. If the price drops below the 50-day SMA, the advantage will shift to the bears. The pair may then decline to $5.80.
Conversely, if the price rebounds from the 50-day SMA and rises above the 20-day EMA, it will suggest buying on dips. The pair could then increase to $6.35. Buyers will need to overcome this resistance to gain the upper hand. The pair may then surge to $6.70.
Related: Voyager’s token transfer to Coinbase sparks sell-off suspicions
Maker price analysis
Maker (MKR) has been trading above the breakout level of $1,200 for several days, indicating that the bulls are trying to convert this level into support.
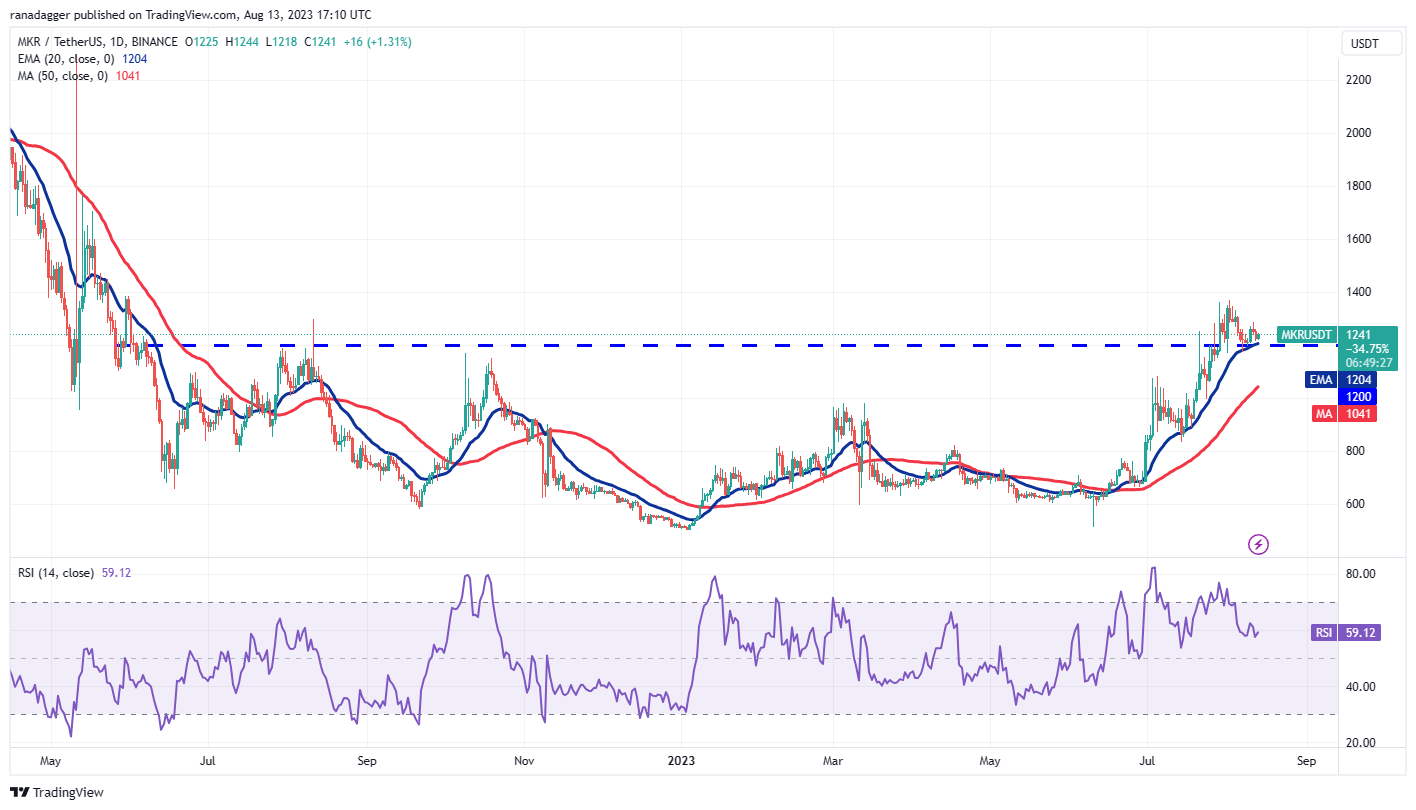 MKR/USDT daily chart. Source: TradingView
The 20-day EMA ($1,204) is gradually rising, and the RSI is in positive territory, suggesting that the bulls hold an advantage. Buyers will aim to push the price above the immediate resistance of $1,284 and challenge the local high at $1,370. A breakout and close above this level could indicate the beginning of a new uptrend.
If the bears wish to thwart the uptrend, they must quickly pull the price back below the breakout level of $1,200. This could pave the way for a decline to the 50-day SMA ($1,041).
 MKR/USDT four-hour chart. Source: TradingView
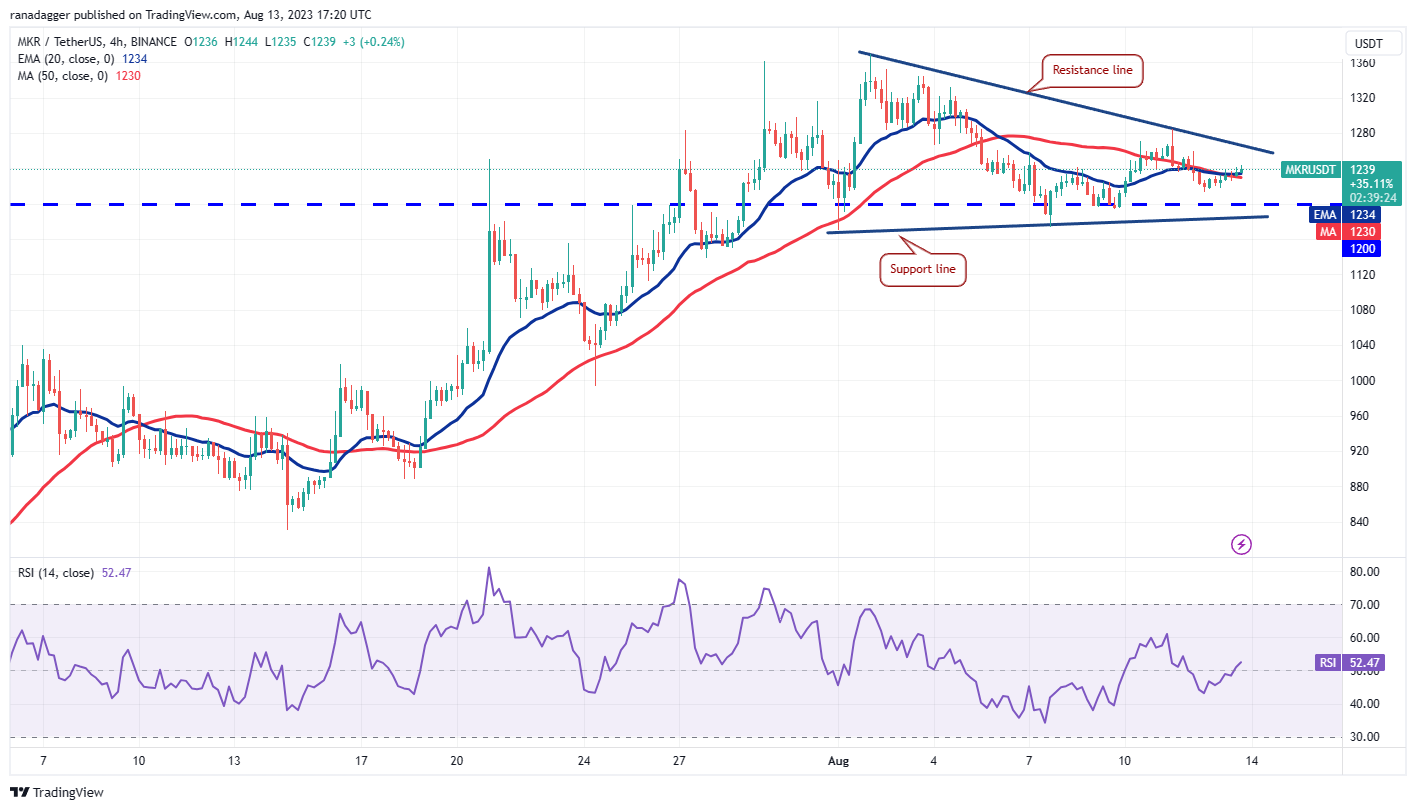
The 20-day EMA on the four-hour chart has flattened, and the RSI is just above the midpoint. The price action has formed a symmetrical triangle pattern, indicating indecision among the bulls and bears.
If buyers push the price above the triangle, the MKR/USDT pair may initiate an upward movement toward the pattern target of $1,463. Conversely, a break below the triangle could signal that bears are regaining control. The pattern target on the downside is $986.
XDC Network price analysis
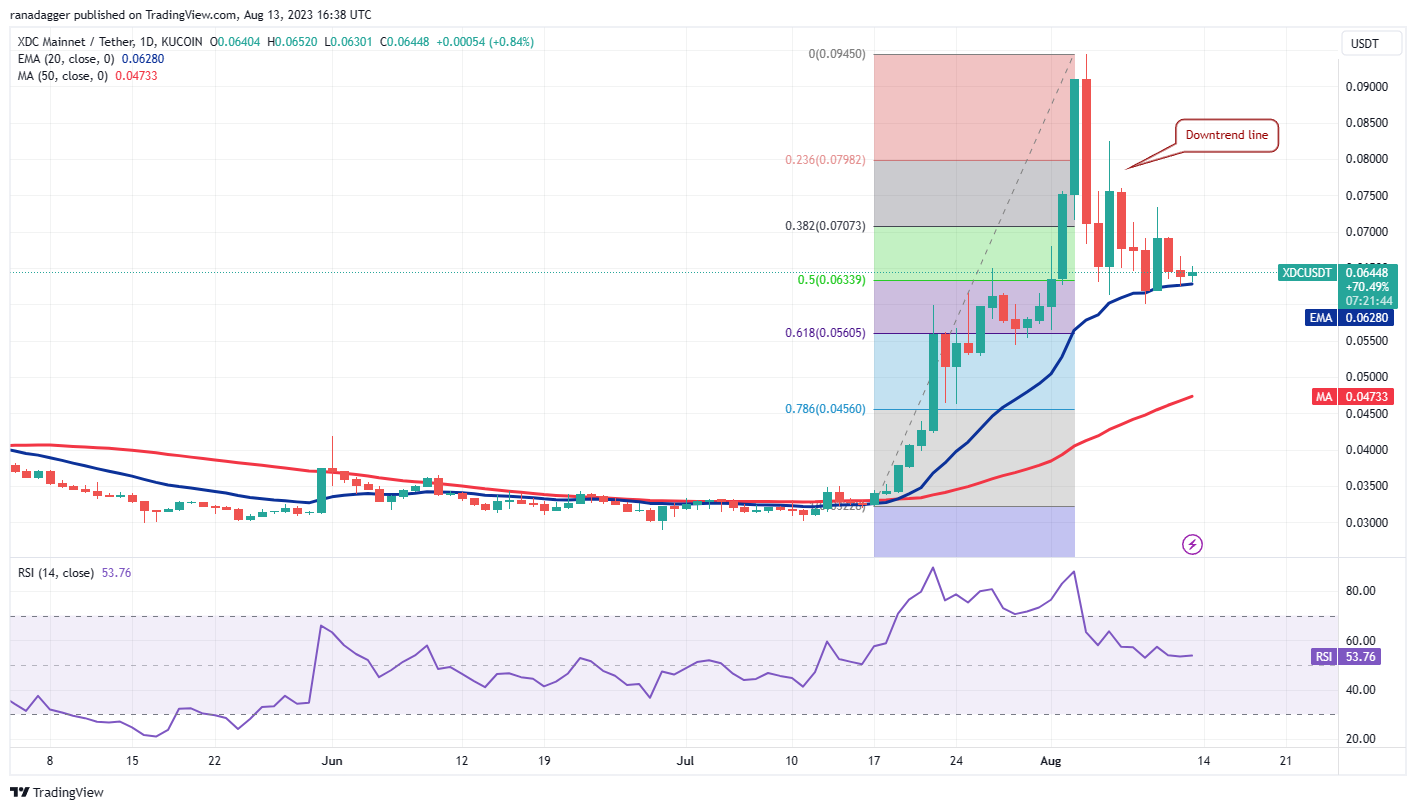
XDC Network (XDC) has retraced to the 20-day EMA ($0.062), which is a crucial support level to monitor.
 XDC/USDT daily chart. Source: TradingView
The 20-day EMA is flattening, and the RSI is just above the midpoint, indicating that bullish momentum may be waning. If buyers wish to gain control, they must drive the price above the overhead resistance at $0.073. This could initiate an upward movement to $0.082.
Conversely, a break and close below the 20-day EMA could lead the pair down to the 61.8% Fibonacci retracement level of $0.056. Such a move could postpone the onset of the next leg of the uptrend.
 XDC/USDT 4-hour chart. Source: TradingView
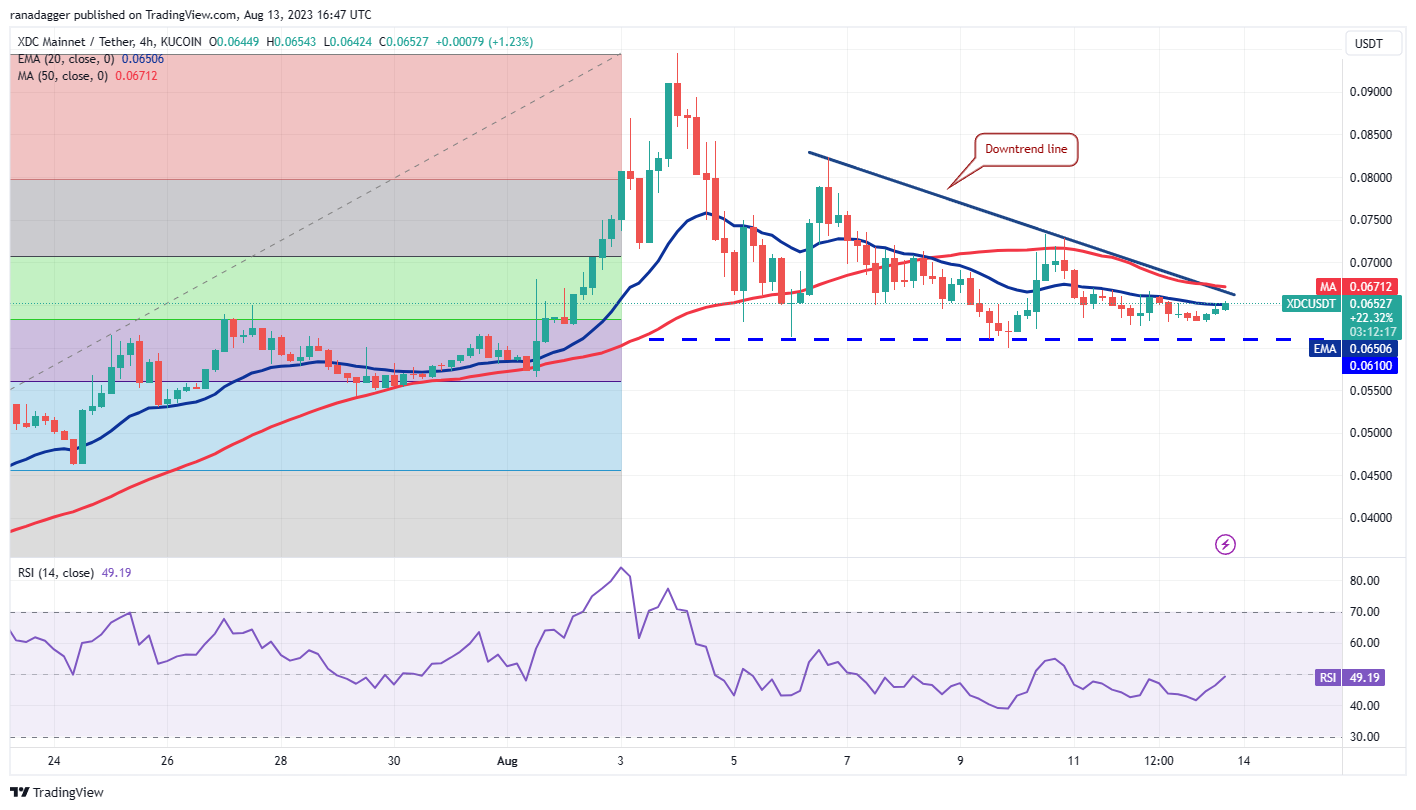
The four-hour chart illustrates a descending triangle formation, which will complete upon a break and close below $0.061. If this occurs, the pair could begin a downward move to $0.054 and subsequently to the pattern target of $0.040.
In contrast, if the price continues to rise from the current level and breaks above the downtrend line, it will invalidate the bearish setup. The failure of a negative setup is a positive indication. This could open the pathway for a potential rally to $0.082.
This article does not contain investment advice or recommendations. Every investment and trading move involves risk, and readers should conduct their own research when making a decision.