Disclaimer: Information found on CryptoreNews is those of writers quoted. It does not represent the opinions of CryptoreNews on whether to sell, buy or hold any investments. You are advised to conduct your own research before making any investment decisions. Use provided information at your own risk.
CryptoreNews covers fintech, blockchain and Bitcoin bringing you the latest crypto news and analyses on the future of money.
The S&P 500 Index (SPX) concluded the week with a nominal decline of 0.29%, while Bitcoin (BTC) is poised to end the week with a more significant drop exceeding 5%. The downturn in Bitcoin has dragged several altcoins down, reflecting a decline in market sentiment.
A positive aspect is Bitcoin’s robust rebound on May 12. Numerous analysts expect Bitcoin to initiate a recovery, although monitoring resource Material Indicators expressed caution.
In a recent assessment, they noted that the absence of strong buying interest from whales at lower price levels could be a troubling indicator. They believe that the bullish outlook will be negated if Bitcoin remains below the 200-week moving average.
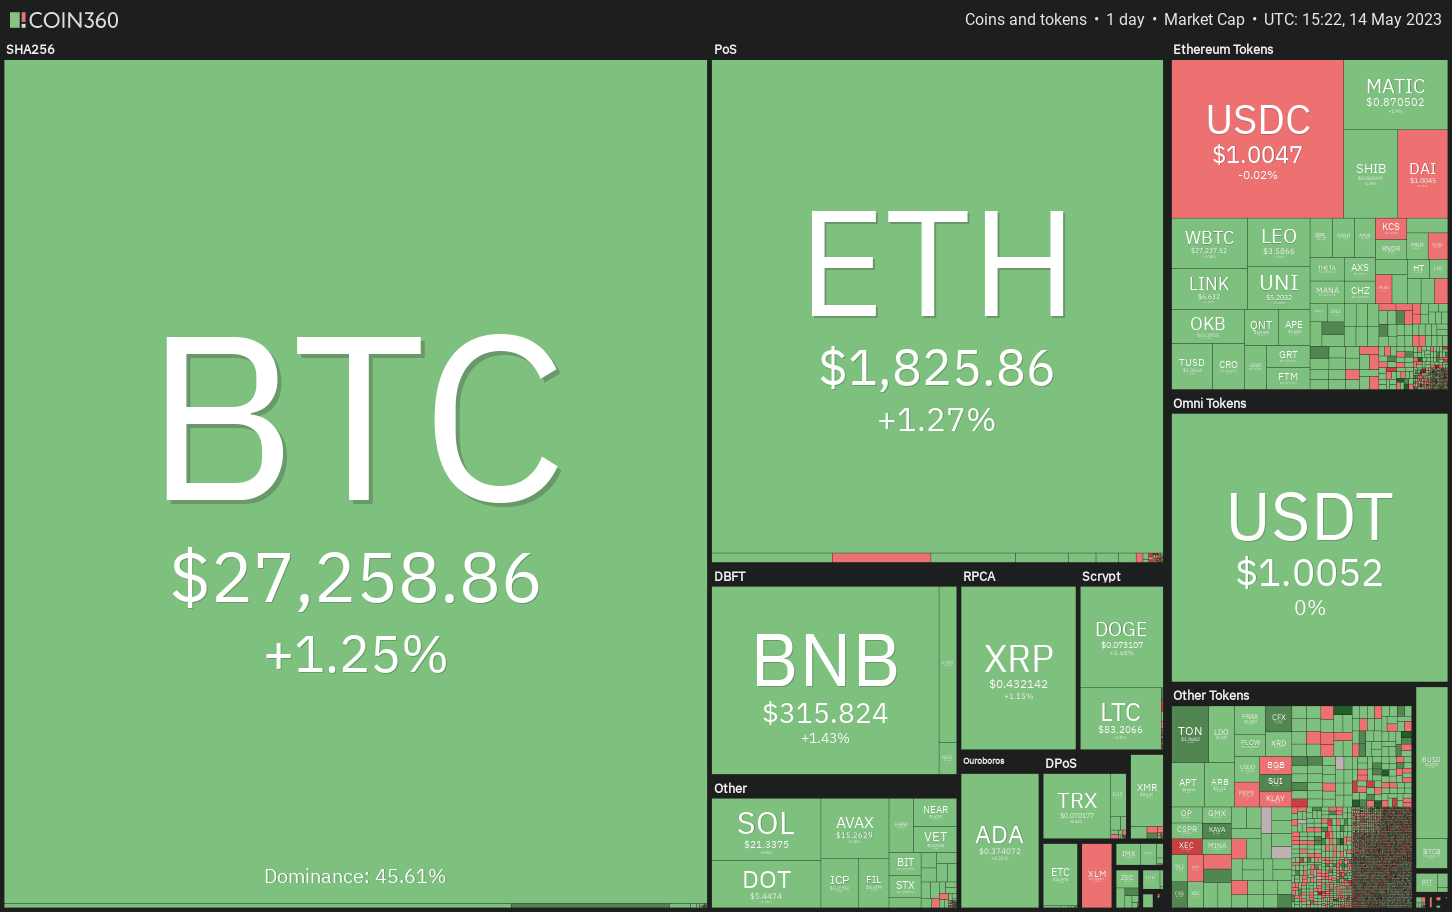 Crypto market data daily view. Source:Coin360
In the coming days, developments regarding the debt ceiling negotiations between Congressional leaders and the White House are anticipated to take precedence. The uncertainty and potential risks of a U.S. default may keep the equity market rally in check, but predicting how Bitcoin and altcoins will respond to the turmoil remains challenging.
Bitcoin has entered a corrective phase, and most altcoins have fallen below their respective support levels. Only a few cryptocurrencies are showing positive trends on the charts. Let’s examine the charts of the top five cryptocurrencies that may experience upward movement in the near future.
Bitcoin price analysis
The long tail on Bitcoin’s May 12 candlestick indicates that buyers are actively purchasing dips to the neckline of the inverse head and shoulders (H&S) pattern.
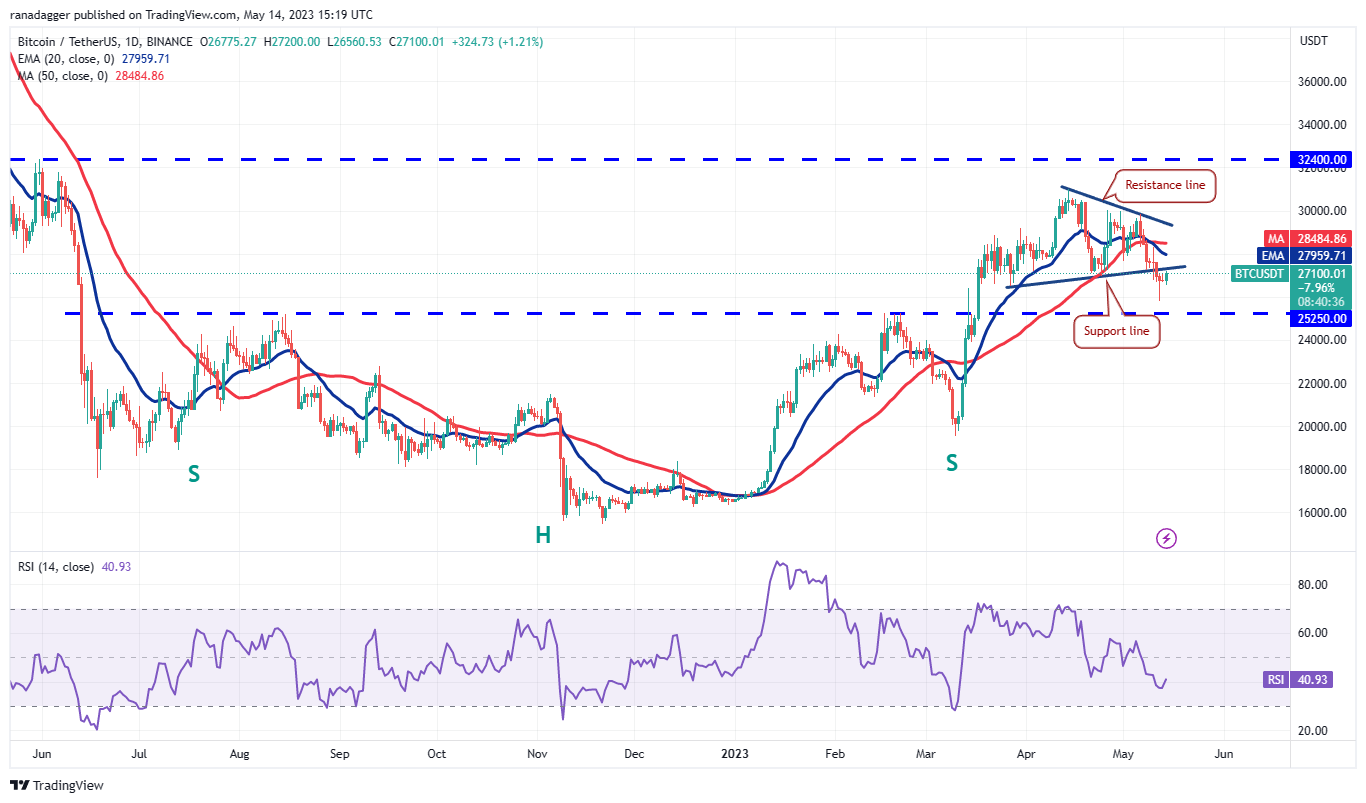 BTC/USDT daily chart. Source: TradingView
Buyers will attempt to push the price back into the triangle but may encounter significant resistance from sellers. The declining 20-day exponential moving average ($27,959) and the relative strength index (RSI) below 41 suggest that sellers have a slight advantage.
If the price declines from the 20-day EMA, sellers will once again try to push the BTC/USDT pair below $25,250. If successful, selling pressure may increase, potentially causing the pair to drop to $20,000.
On the upside, bulls must overcome the resistance line to regain control. The pair may then retest the overhead resistance at $31,000.
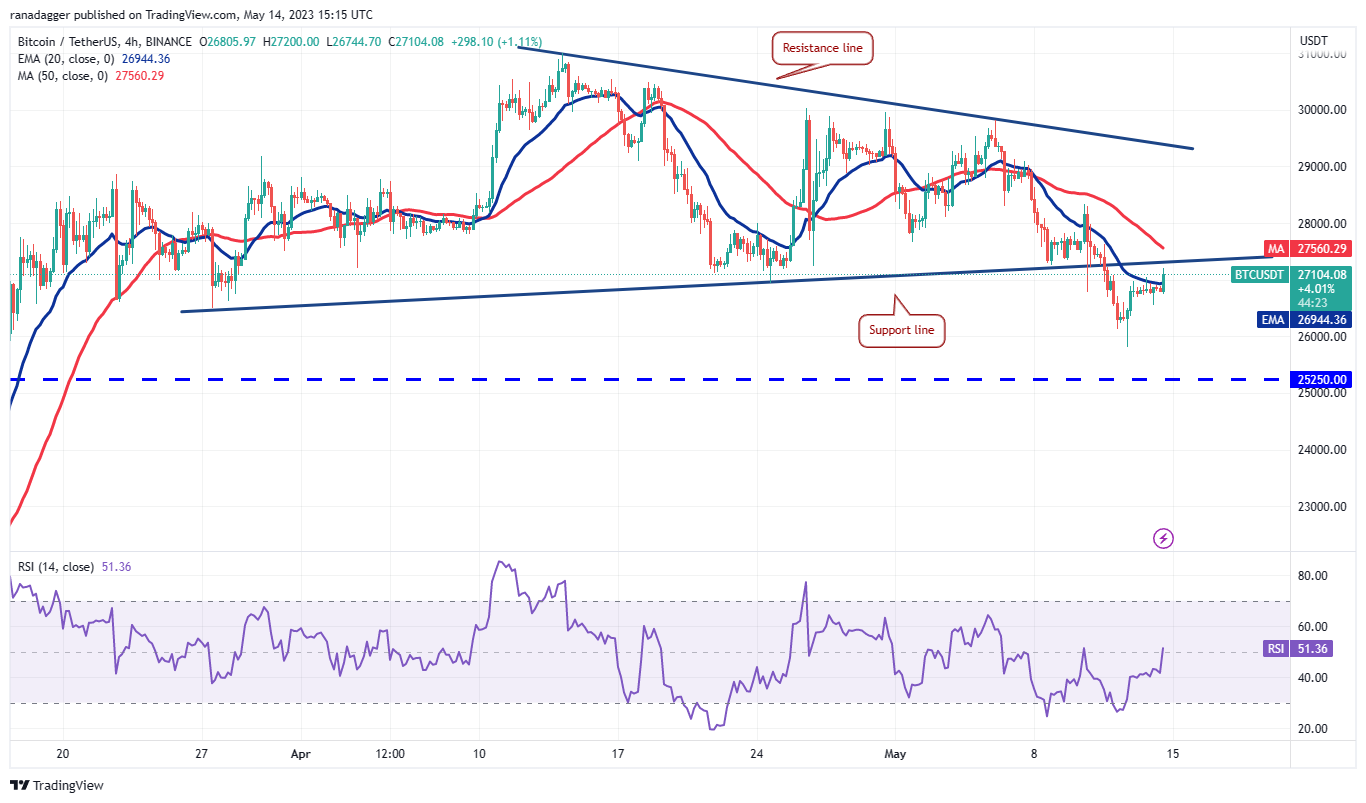 BTC/USDT 4-hour chart. Source: TradingView
After encountering strong resistance at the 20-EMA, bulls have managed to surpass this barrier. This suggests that buyers are attempting to take control. The pair may first rise to the 50-simple moving average and then to $28,400.
Conversely, if the price sharply declines from the current level, it will indicate that sellers are trying to convert the support line of the triangle into resistance. The pair may then fall to the critical support at $25,250.
Cardano price analysis
Cardano’s (ADA) notable rebound from the uptrend line on May 11 indicates that lower price levels continue to attract strong buying interest.
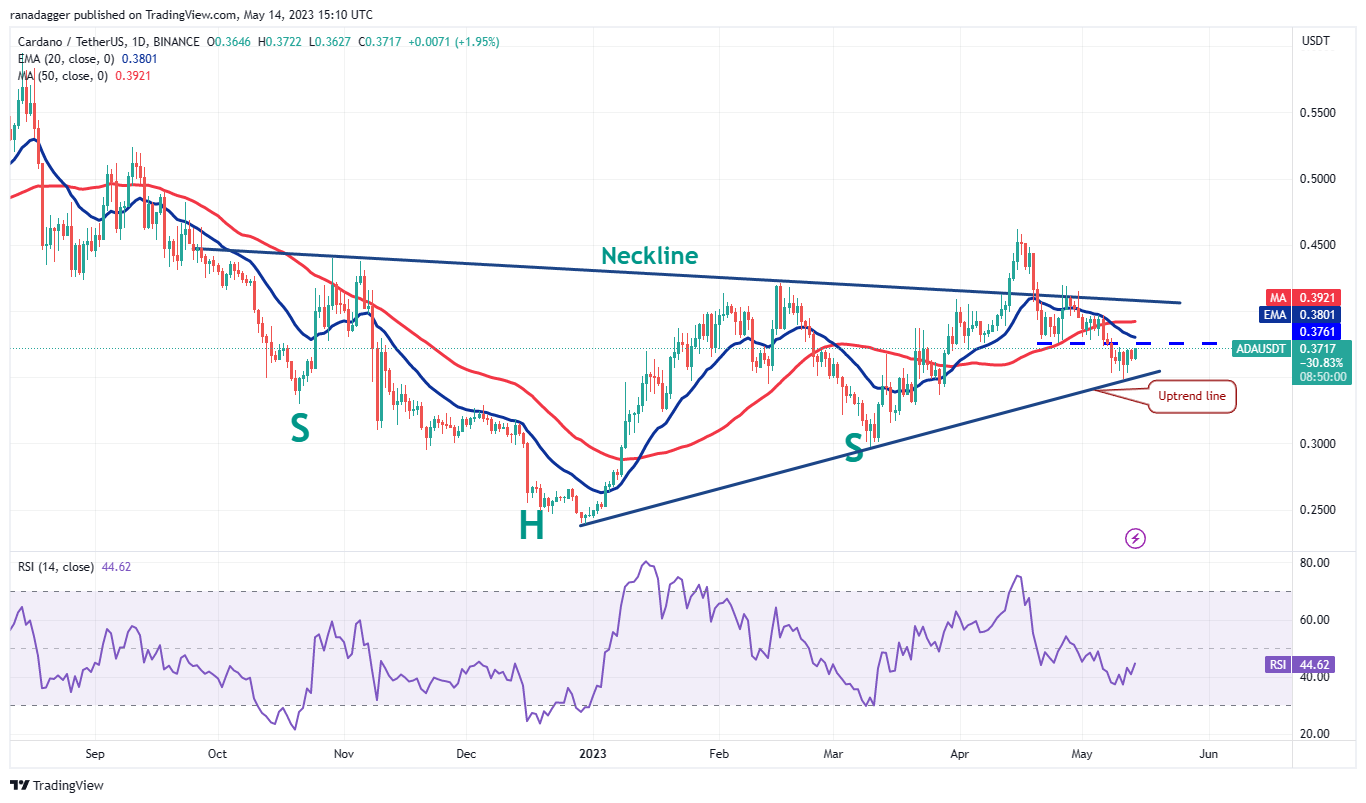 ADA/USDT daily chart. Source: TradingView
Bulls will attempt to continue the recovery by driving the price to the 20-day EMA ($0.38). This level may serve as a minor obstacle, but if bulls surpass it, the ADA/USDT pair could surge toward the neckline of the inverse H&S pattern. This level is likely to see a fierce contest between bulls and bears.
Alternatively, the price may decline from the 20-day EMA and drop to the uptrend line. Frequent retesting of a support level tends to weaken it, potentially paving the way for a decline to $0.30.
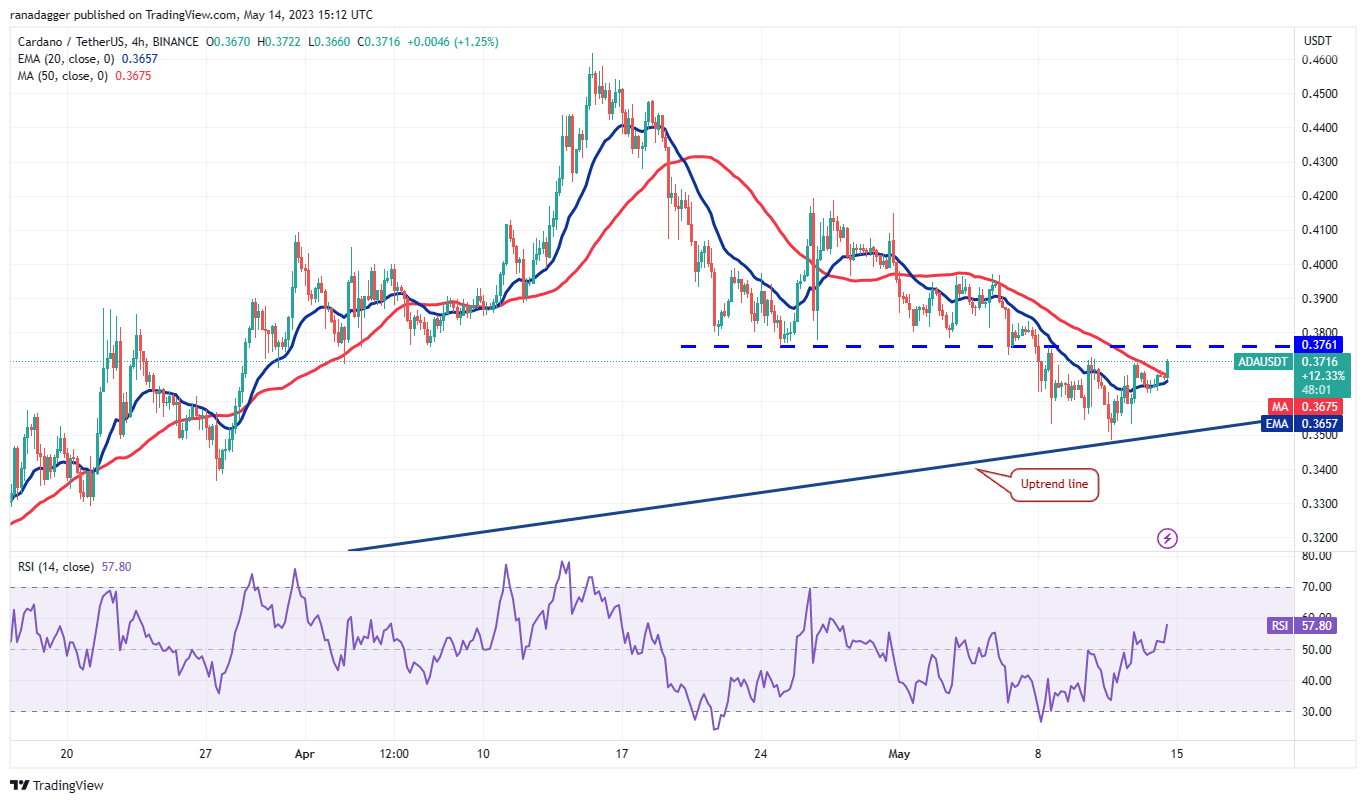 ADA/USDT 4-hour chart. Source: TradingView
Bulls have pushed the price above the moving averages, indicating that sellers may be losing their grip. The 20-EMA has begun to rise gradually, and the RSI is in the positive zone, suggesting that buyers are making a comeback.
If buyers break through the overhead resistance at $0.37, the pair could gain momentum and rally to $0.40 and subsequently to $0.42. Conversely, if the price declines from $0.37, the pair may fall to the uptrend line.
Cosmos price analysis
Cosmos (ATOM) rebounded from the $10.20 support on May 10, indicating that buyers are purchasing dips at this level.
Related Posts
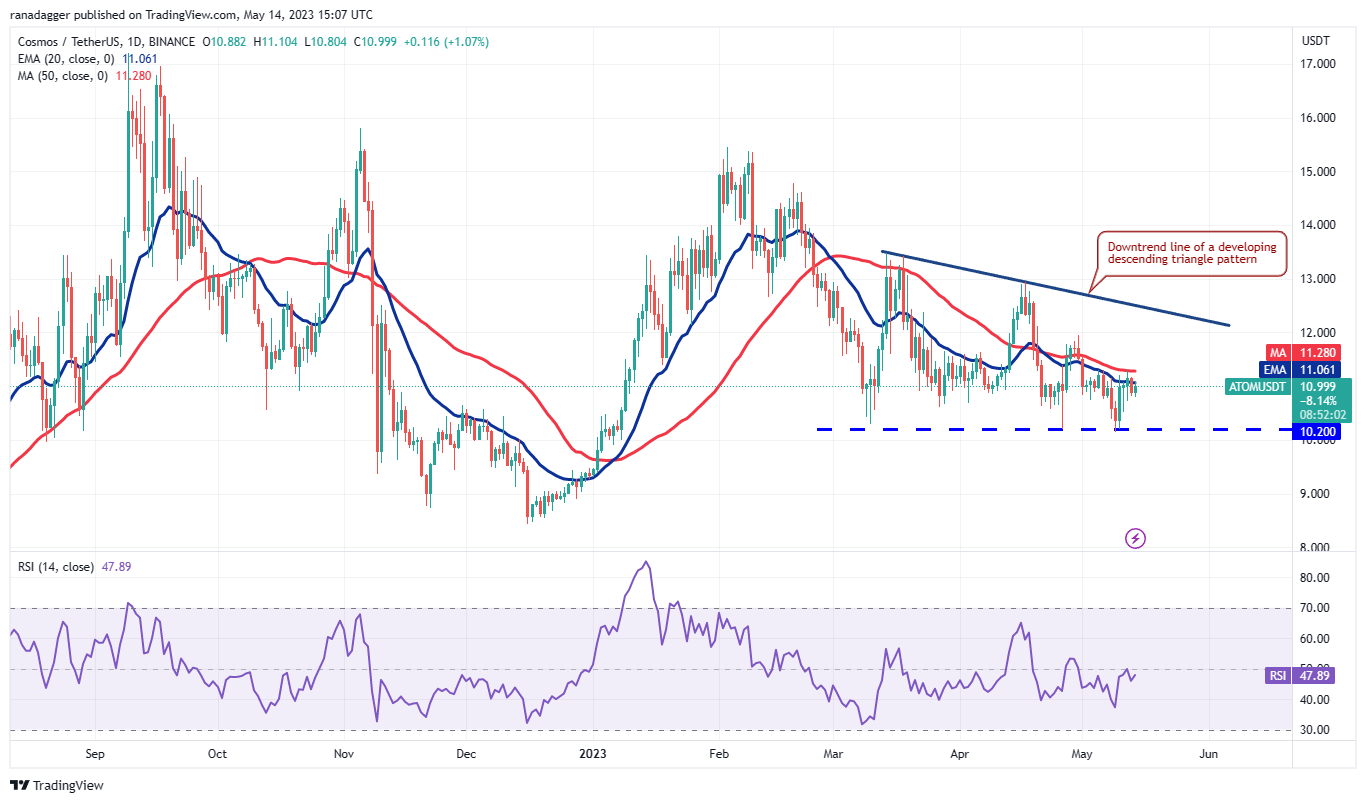 ATOM/USDT daily chart. Source: TradingView
Sellers are attempting to halt the relief rally at the 50-day SMA ($11.28), but buyers have not relinquished much ground. This enhances the likelihood of a rally above the 50-day SMA. If successful, the ATOM/USDT pair could rise to the downtrend line.
This level is crucial for sellers to defend, as a breakout above it would invalidate the bearish descending triangle pattern.
The key support to monitor on the downside is $10.20. If this level is breached, the descending triangle will complete, and the pair may plummet to $8.50.
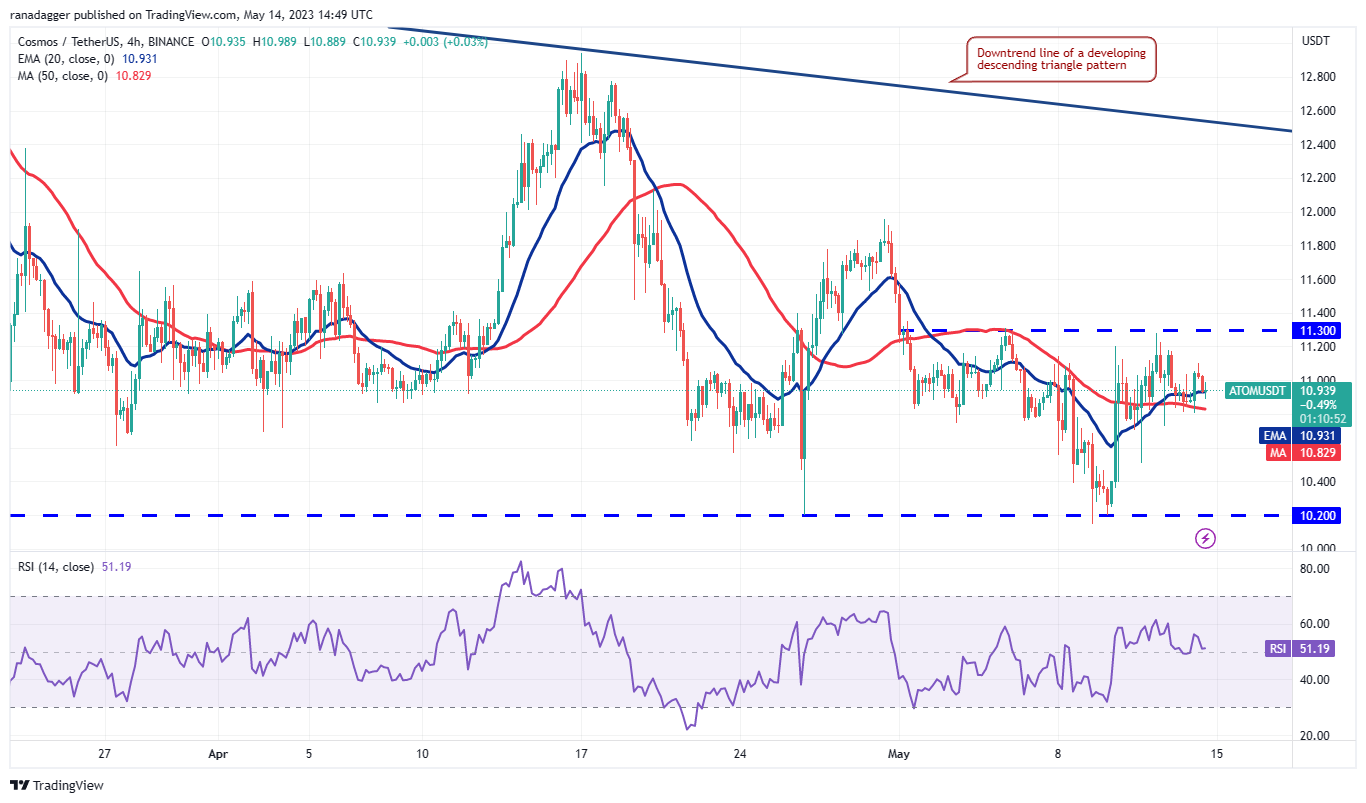 ATOM/USDT 4-hour chart. Source: TradingView
The 4-hour chart indicates that the relief rally is facing selling pressure at higher levels, but the price action is forming a potential inverse H&S pattern that will complete with a break and close above $11.30. The pair may then initiate an upward movement to $12 and subsequently to $12.50.
Alternatively, if the price declines and breaks below the 50-SMA, it will suggest that sellers are in control. The pair may then drop toward the critical support at $10.20. A rebound from this level could keep the pair within the range of $11.30 and $10.20 for a longer period.
Related: 4 alarming charts for Bitcoin bulls as $27K becomes formidable hurdle
Lido DAO price analysis
Lido Dao (LDO) bounced off the $1.60 support and has reached the overhead resistance at the 20-day EMA ($1.95).
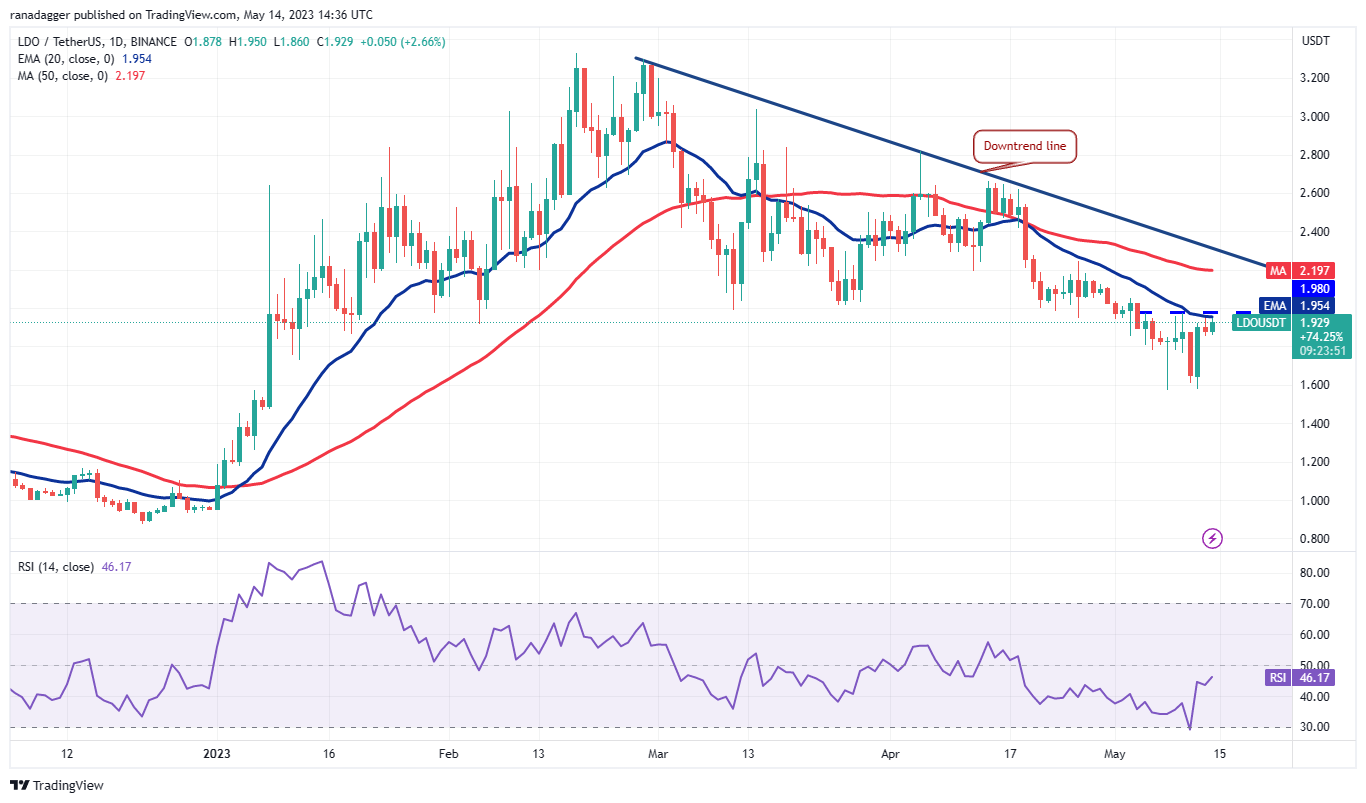 LDO/USDT daily chart. Source: TradingView
Sellers are attempting to defend the 20-day EMA, but buyers have not backed down. This indicates that buyers are optimistic about the continuation of the recovery. If buyers push the price above the 20-day EMA, the LDO/USDT pair could rally to the downtrend line. This level is likely to attract significant selling from sellers.
If buyers manage to halt the next decline above the 20-day EMA, it will indicate a shift in sentiment from selling on rallies to buying on dips. The pair could then initiate a sustained recovery above the downtrend line.
On the downside, sellers must drive the price below $1.60 to signal the resumption of the downtrend.
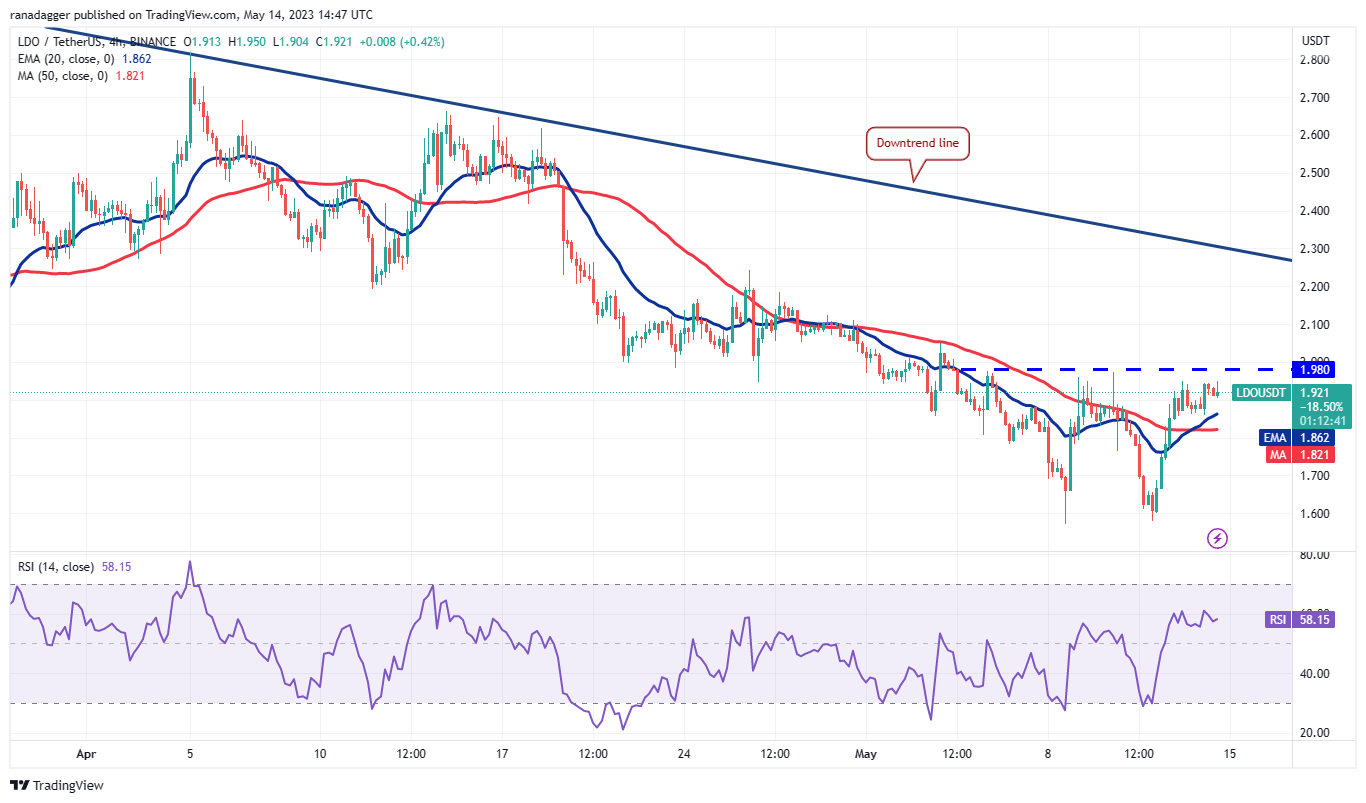 LDO/USDT 4-hour chart. Source: TradingView
The 4-hour chart reveals that buyers are attempting to push the price above the overhead resistance at $1.98. If successful, the pair will complete a bullish double bottom pattern. This reversal setup has a target objective of $2.39. If this level is also surpassed, the pair may reach $2.60.
Conversely, if the price declines from the current level or $1.98 and breaks below the moving averages, it will suggest that sellers are active at higher levels. This may keep the pair confined between $1.57 and $1.98 for a period.
Arbitrum price analysis
Arbitrum (ARB) has been finding support near the psychologically significant level of $1, indicating that buyers are actively purchasing dips.
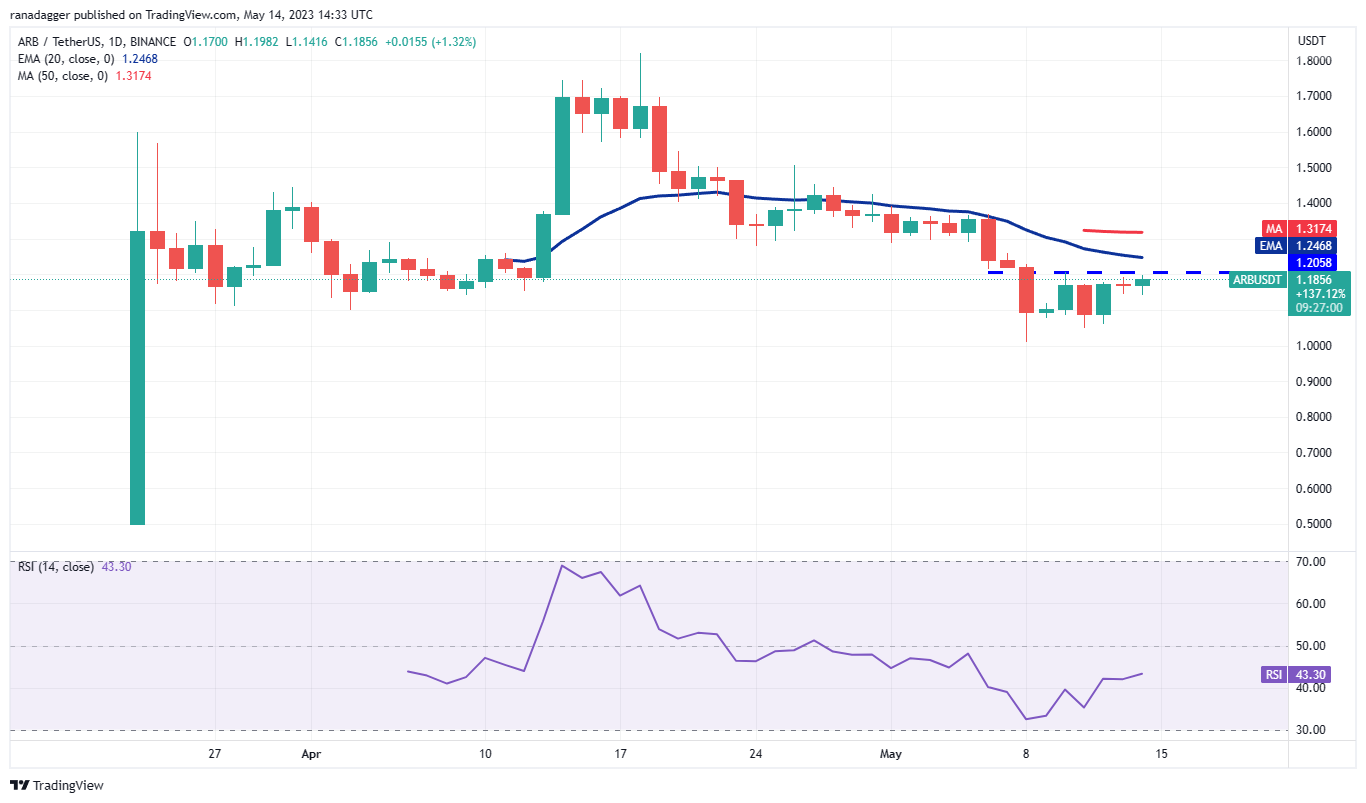 ARB/USDT daily chart. Source: TradingView
On the upside, sellers have been trying to impede the recovery at $1.20, but a slight positive for buyers is that they have maintained buying pressure. This increases the chances of a breakout above $1.20. If that occurs, the ARB/USDT pair could rise to $1.40 and later to $1.50.
This optimistic outlook will be invalidated in the short term if the price sharply declines from $1.20. This would indicate a potential consolidation between $1 and $1.20 for several days.
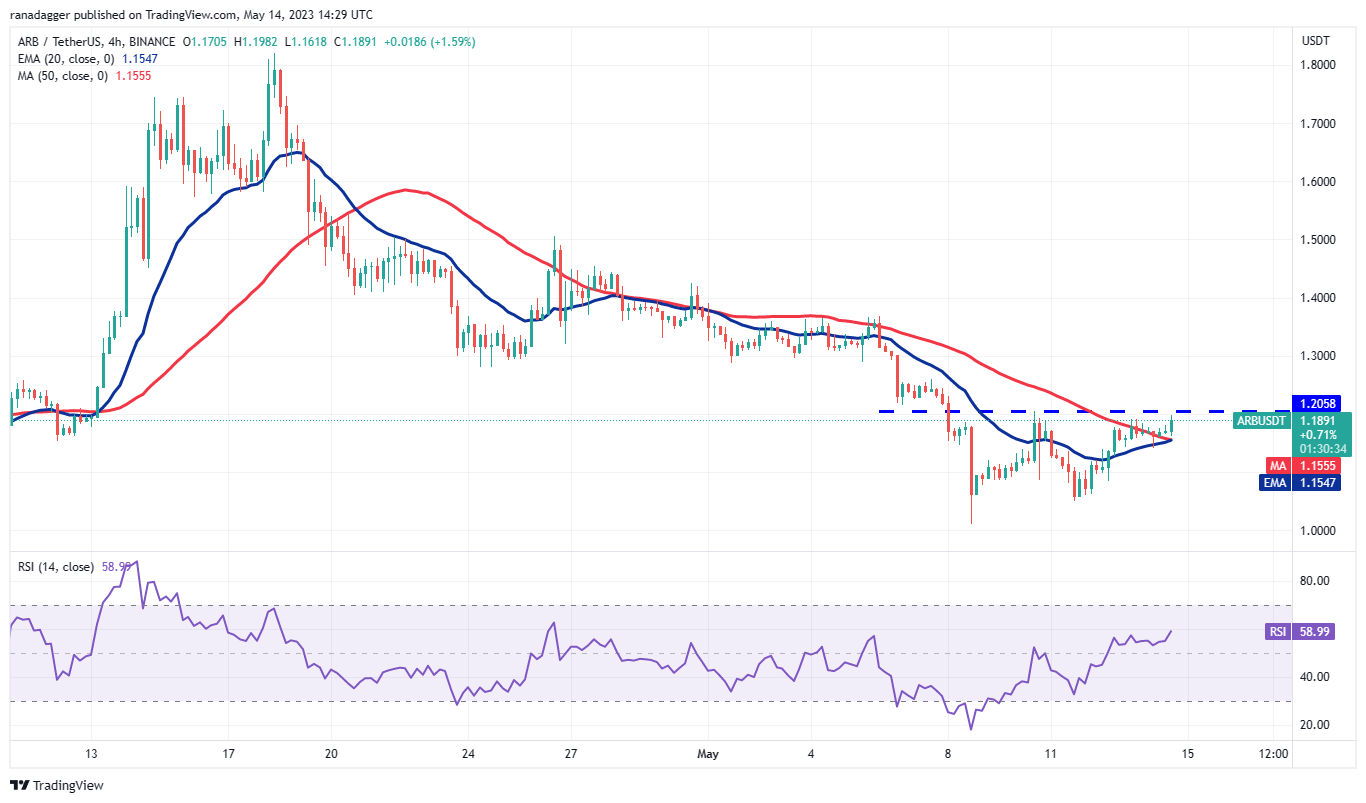 ARB/USDT 4-hour chart. Source: TradingView
The 20-EMA on the 4-hour chart has begun to trend upward, and the RSI is in positive territory, indicating that selling pressure is diminishing. Buyers will aim to strengthen their position by pushing the pair above $1.20. If they succeed, the pair will complete a double bottom pattern, which has a target objective of $1.35.
The first indication of strength for sellers will be a break and close below the 20-EMA. This could pull the pair down to $1.05. A drop below $1 will signal the resumption of the downtrend.
This article does not contain investment advice or recommendations. Every investment and trading move involves risk, and readers should conduct their own research when making a decision.