Disclaimer: Information found on CryptoreNews is those of writers quoted. It does not represent the opinions of CryptoreNews on whether to sell, buy or hold any investments. You are advised to conduct your own research before making any investment decisions. Use provided information at your own risk.
CryptoreNews covers fintech, blockchain and Bitcoin bringing you the latest crypto news and analyses on the future of money.
Bitcoin trades within a range as volatility decreases; will TON, LINK, MKR, and XTZ follow suit?
Last week, Bitcoin (BTC) attempted to escape its trading range, but the bulls were unable to maintain the elevated levels. Bitcoin has returned to the range and is currently trading close to the $26,000 mark. The price movements over the past few days have established two consecutive Doji candlestick formations on the weekly chart, reflecting uncertainty regarding the upcoming directional shift.
While it’s challenging to forecast the breakout direction, the potential downside may be constrained in the short term due to expectations that the United States Securities and Exchange Commission (SEC) might eventually approve one or more pending applications for a spot Bitcoin exchange-traded fund. Former SEC chair Jay Clayton expressed confidence during a recent interview, stating that “an approval is inevitable.”
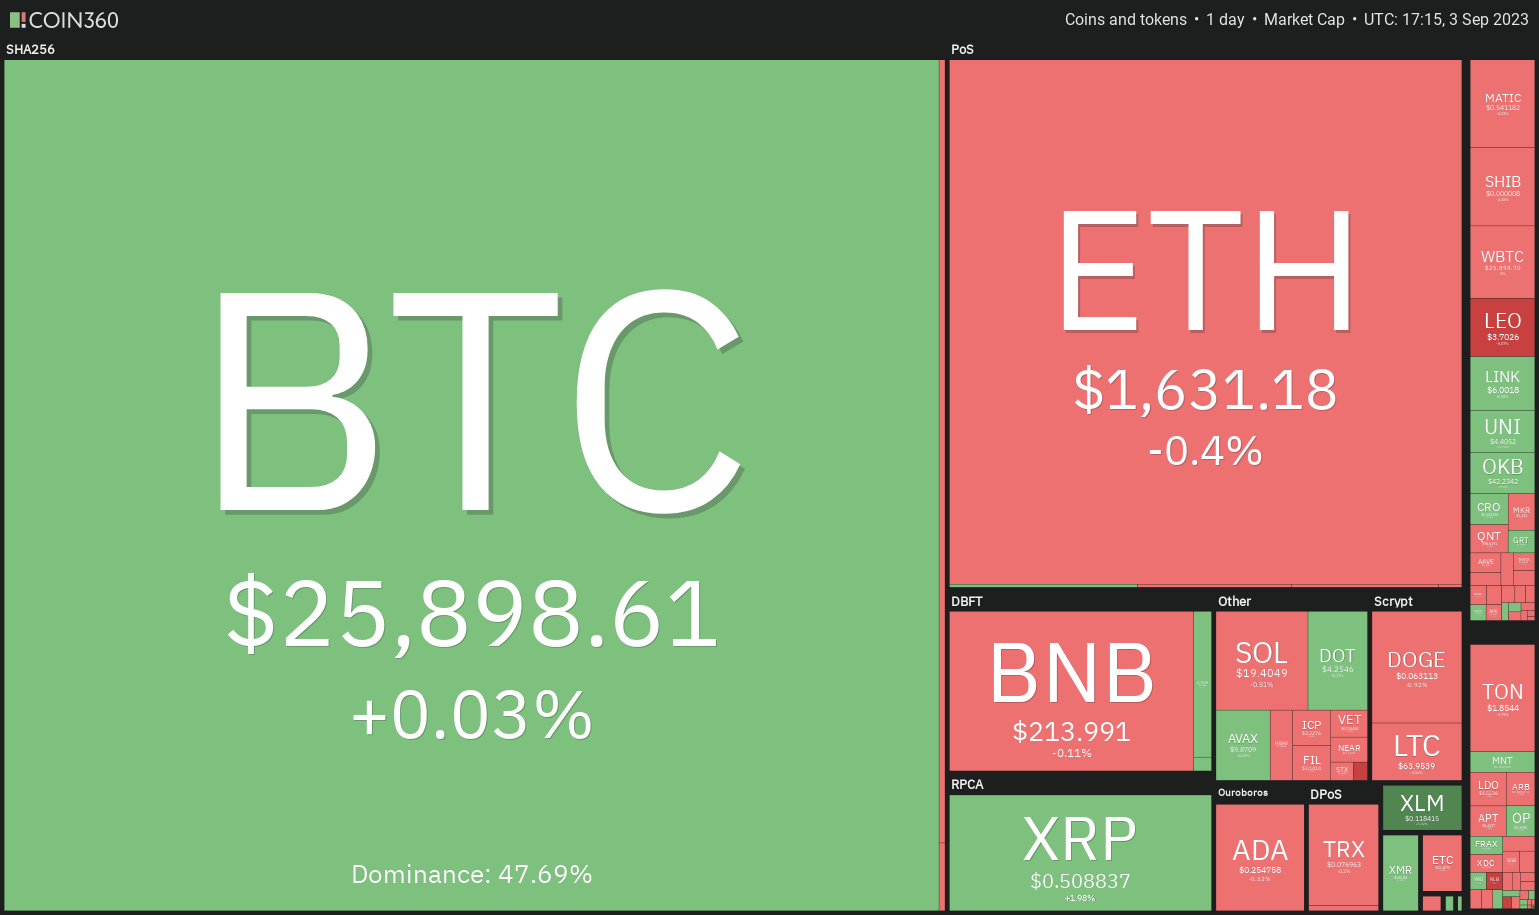 Crypto market data daily view. Source:Coin360
In the short term, identifying a specific catalyst that could propel Bitcoin out of its range remains difficult. The uncertainty surrounding Bitcoin’s next trend has kept most significant altcoins under pressure.
Only a few altcoins are demonstrating signs of strength in the near term. Let’s examine the charts of the top five cryptocurrencies that may initiate a rally if they surpass their respective overhead resistance levels.
Bitcoin price analysis
Bitcoin has re-entered the $24,800 to $26,833 range, but a positive indicator is that the bulls continue to purchase dips, as evidenced by the long tail on the September 1 candlestick.
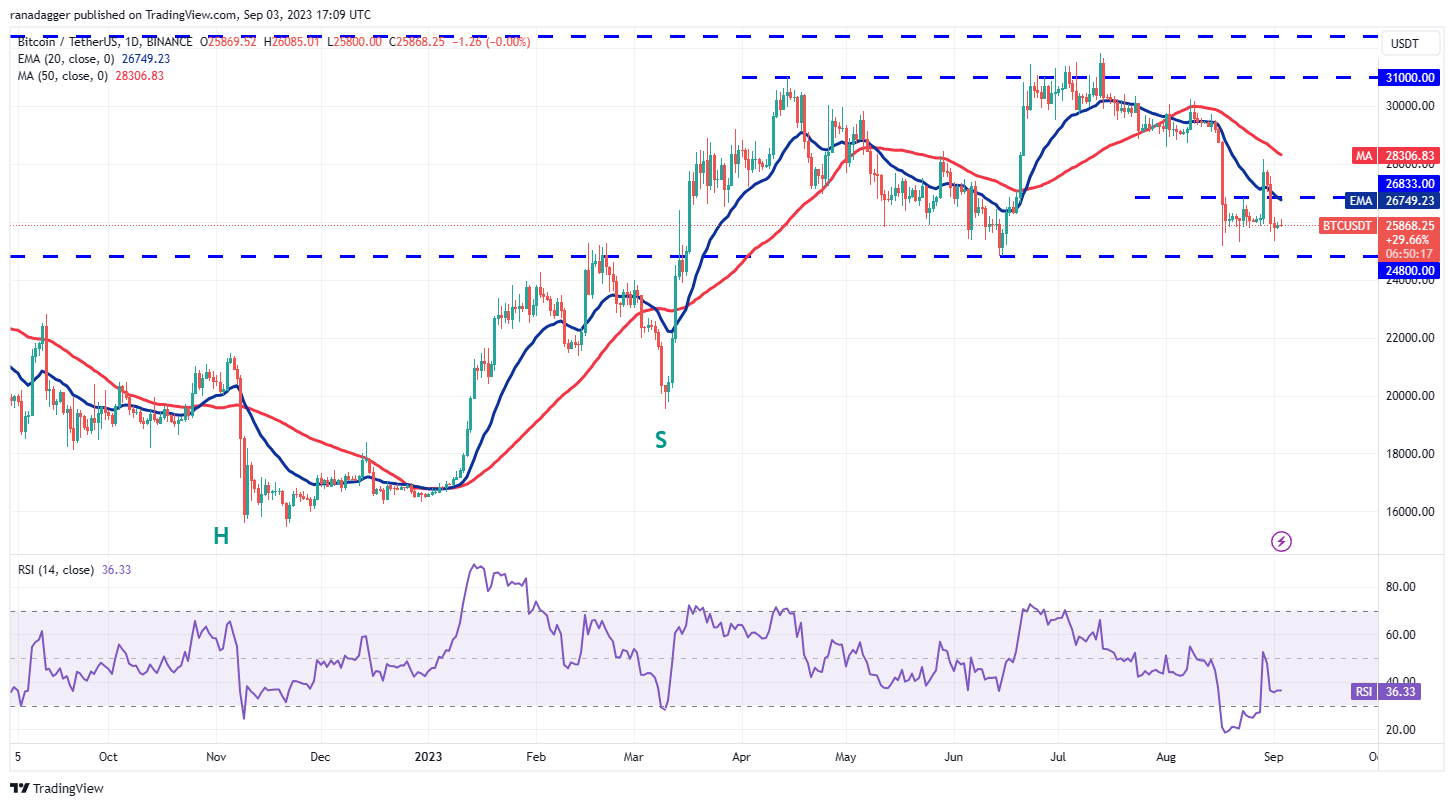 BTC/USDT daily chart. Source: TradingView
Although the descending moving averages suggest an advantage for bears, the gradually improving relative strength index (RSI) indicates that the bearish momentum may be diminishing. The initial sign of strength will occur with a break and close above the range at $26,833. If this occurs, the BTC/USDT pair could re-test the intraday high of $28,142 from August 29.
If bears aim to take control, they must push and hold the price below $24,800. This will be a challenging task, as the bulls are likely to defend this level vigorously. However, if the bears succeed, the pair could drop to $20,000. A minor support level exists at $24,000, but it may not stop the decline.
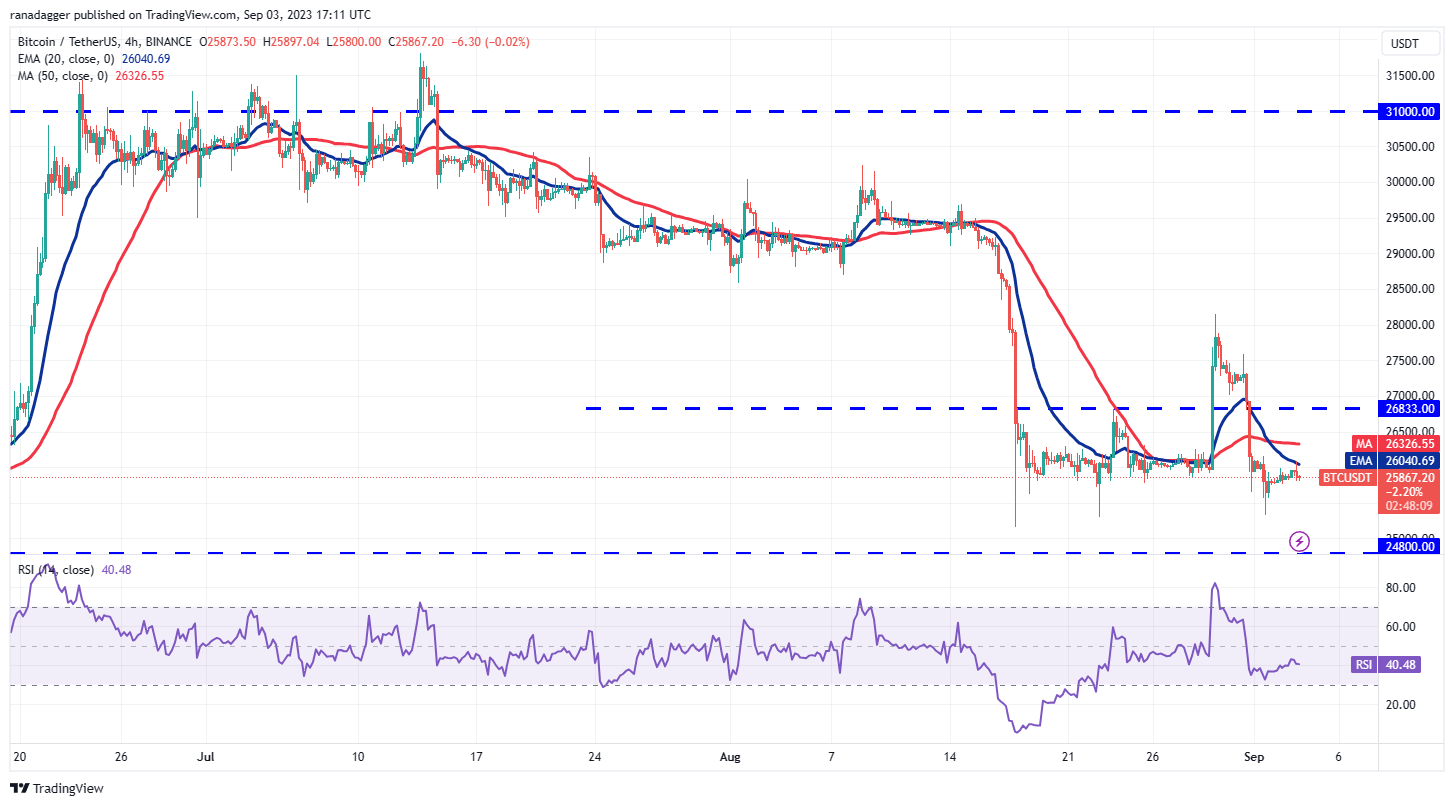 BTC/USDT 4-hour chart. Source: TradingView
The bears attempted to push the price below the immediate support at $25,300, but the bulls maintained their position. Buyers will now aim to build their strength by driving the price above the 20-exponential moving average. If they succeed, it will signal the beginning of a more robust recovery.
The 50-day simple moving average may serve as a barrier, but it is likely to be surpassed. This could clear the way for a potential rally to the overhead resistance at $26,833.
Sellers are expected to have alternative plans. They will attempt to drive the price below $25,300 and challenge the critical support level at $24,800.
Toncoin price analysis
Toncoin (TON) is on an upward trajectory, but bears are trying to impede the rise near the overhead resistance at $2.07.
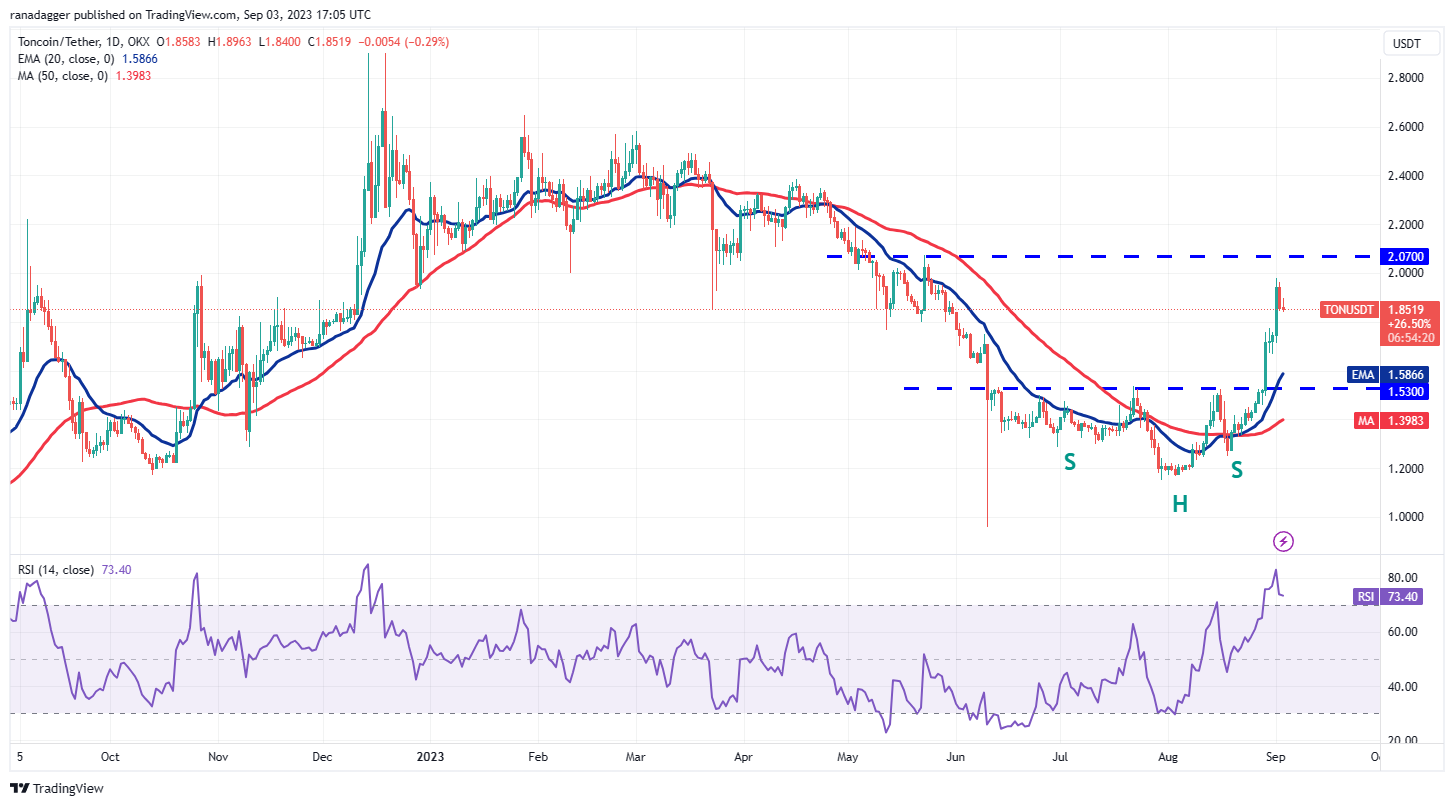 TON/USDT daily chart. Source: TradingView
Both moving averages have turned upward, signaling a favorable position for buyers; however, the overbought levels on the RSI imply that a minor correction or consolidation may be on the horizon. If the bulls can maintain their current position without significant loss, the chances of a rally above $2.07 increase. The TON/USDT pair could then surge to $2.40.
Conversely, a more substantial correction could bring the price down to the 20-day EMA ($1.58). A strong rebound from this level would suggest a positive sentiment, indicating that traders are buying on dips. The trend will turn negative if the 20-day EMA support fails.
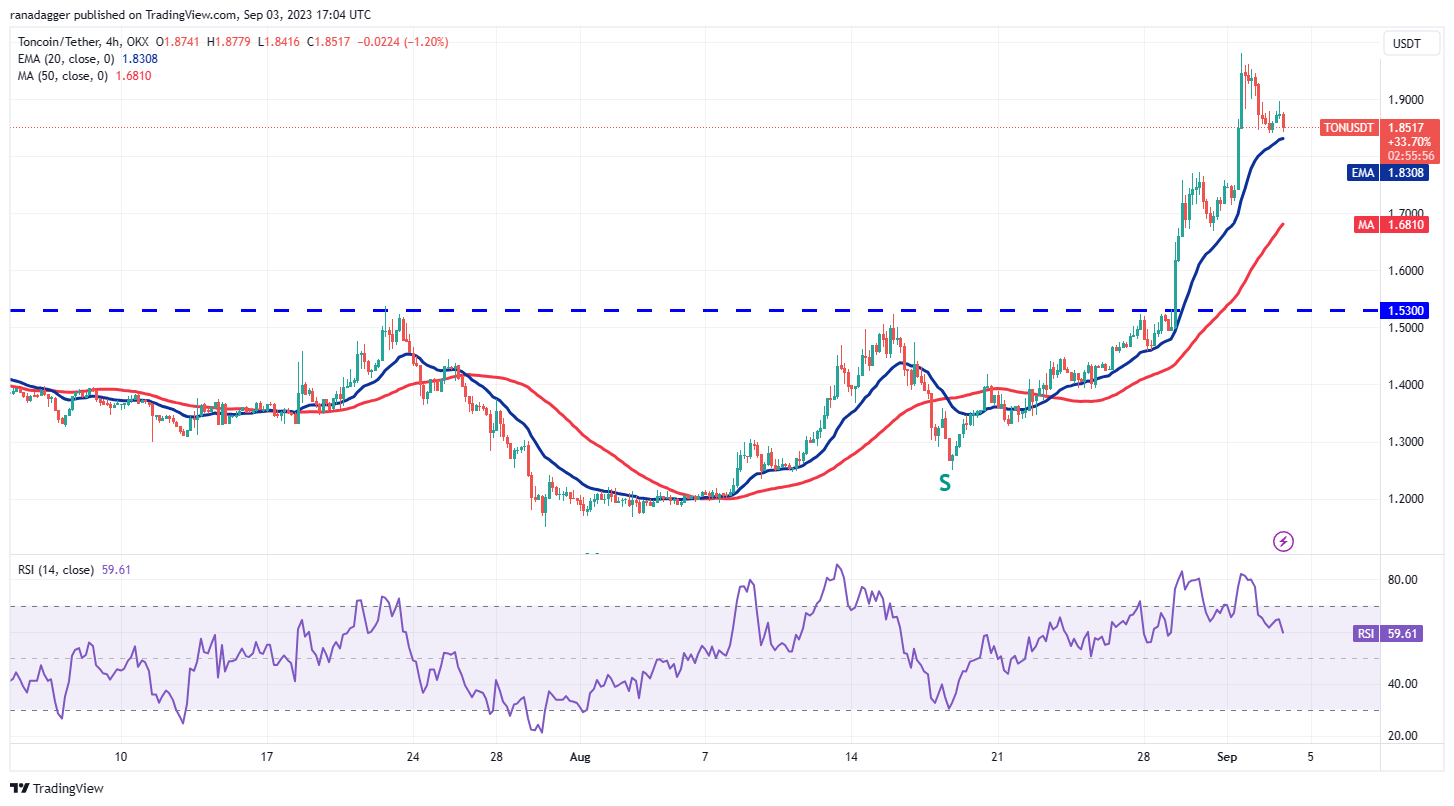 TON/USDT 4-hour chart. Source: TradingView
The 4-hour chart indicates that bulls have been buying the dips to the 20-EMA. This remains a crucial level to monitor. If the price bounces off the 20-EMA with strength, the pair could retest the local high at $1.98. A breakthrough above this could challenge the resistance at $2.07.
On the other hand, if the 20-EMA support breaks down, it will signify that traders are exiting positions. This could lead to a deeper pullback toward the 50-SMA. A rebound from this level may encounter selling at the 20-EMA, but if this barrier is overcome, it would suggest that bulls are regaining control.
Chainlink price analysis
Chainlink (LINK) has been trading within a broad range of $5.50 to $9.50 for several months. The bears pulled the price below the range support on June 10, but they could not maintain the lower levels.
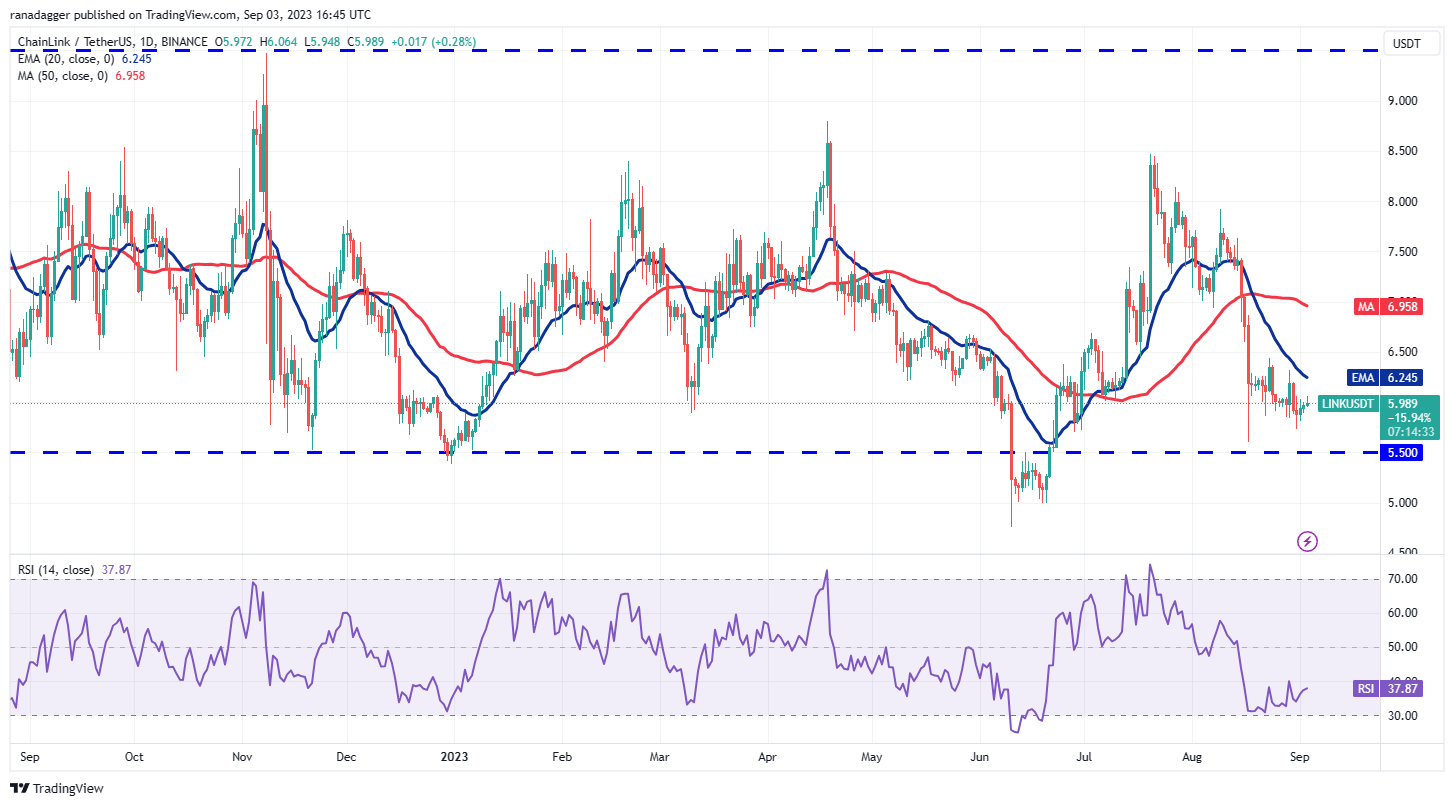 LINK/USDT daily chart. Source: TradingView
Related Posts
The LINK/USDT pair approached the range support on August 17, but the bulls purchased this dip, as indicated by the long tail on the candlestick. Buyers are attempting to initiate a recovery but are encountering resistance near the 20-day EMA ($6.24). Thus, this becomes a significant level to watch.
If buyers can push the price above the 20-day EMA, the pair may embark on a journey toward the 50-day SMA ($6.95). There is minor resistance at $6.40, but it is likely to be surpassed.
Conversely, if the price sharply declines from the 20-day EMA, it will imply that sentiment remains negative and traders are selling on rallies. This could pull the price down to $5.50.
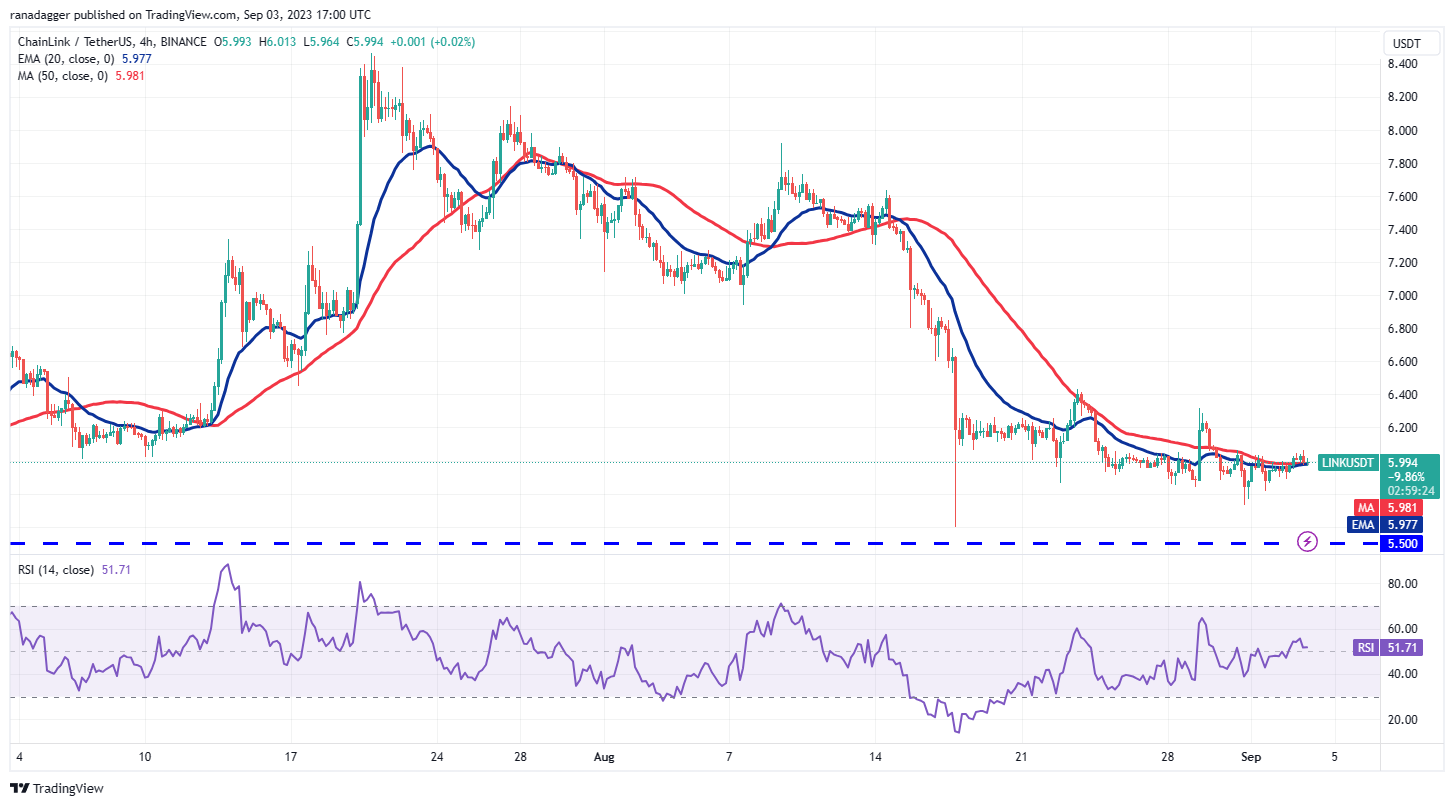 LINK/USDT 4-hour chart. Source: TradingView
The moving averages have flattened out on the 4-hour chart, and the RSI is near the midpoint. This indicates a reduction in selling pressure. Buyers will need to push the price above $6.40 to initiate a new upward movement. The pair could subsequently rise to $6.87 and then to $7.07.
Alternatively, if the price declines from $6.40, it will signal that bears are selling during rallies. This may keep the pair oscillating between $5.50 and $6.40 for a while longer.
Related: Bitcoin chart highlights $24.7K as analyst says ‘nothing has changed’
Maker price analysis
Maker (MKR) has found support near $1,000 and is attempting to recommence its upward trend. The bulls are facing resistance at the downtrend line, yet a positive sign is that they have maintained the price above the 20-day EMA ($1,107).
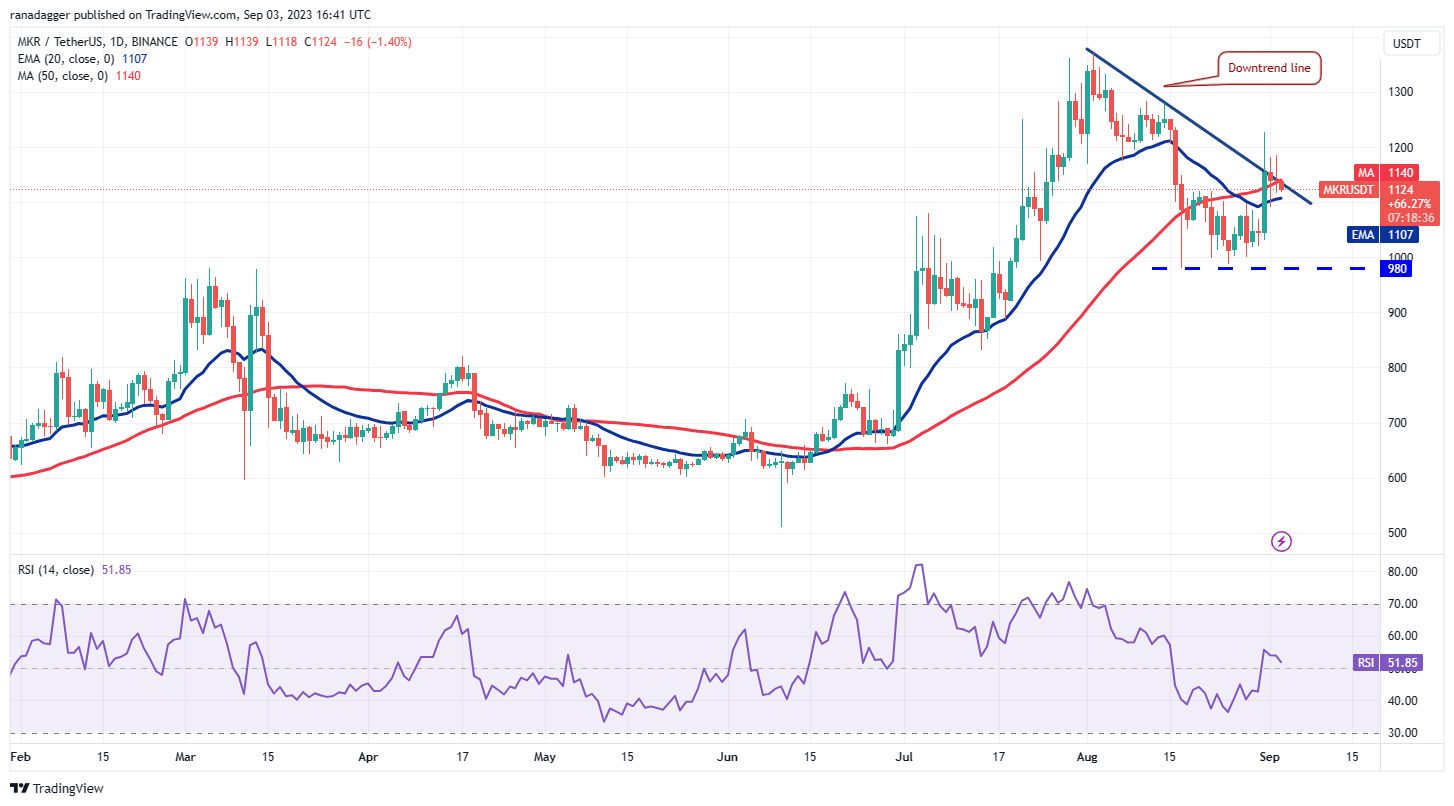 MKR/USDT daily chart. Source: TradingView
If the price rises from the current level, it will indicate that sentiment has turned positive and that traders are viewing dips as buying opportunities. The bulls will then attempt to push the price to $1,370 once again.
On the other hand, if the price continues to decline and breaks below the 20-day EMA, it will indicate that bears are aggressively defending the downtrend line. The MKR/USDT pair may then fall to the strong support level at $980 and potentially to $860.
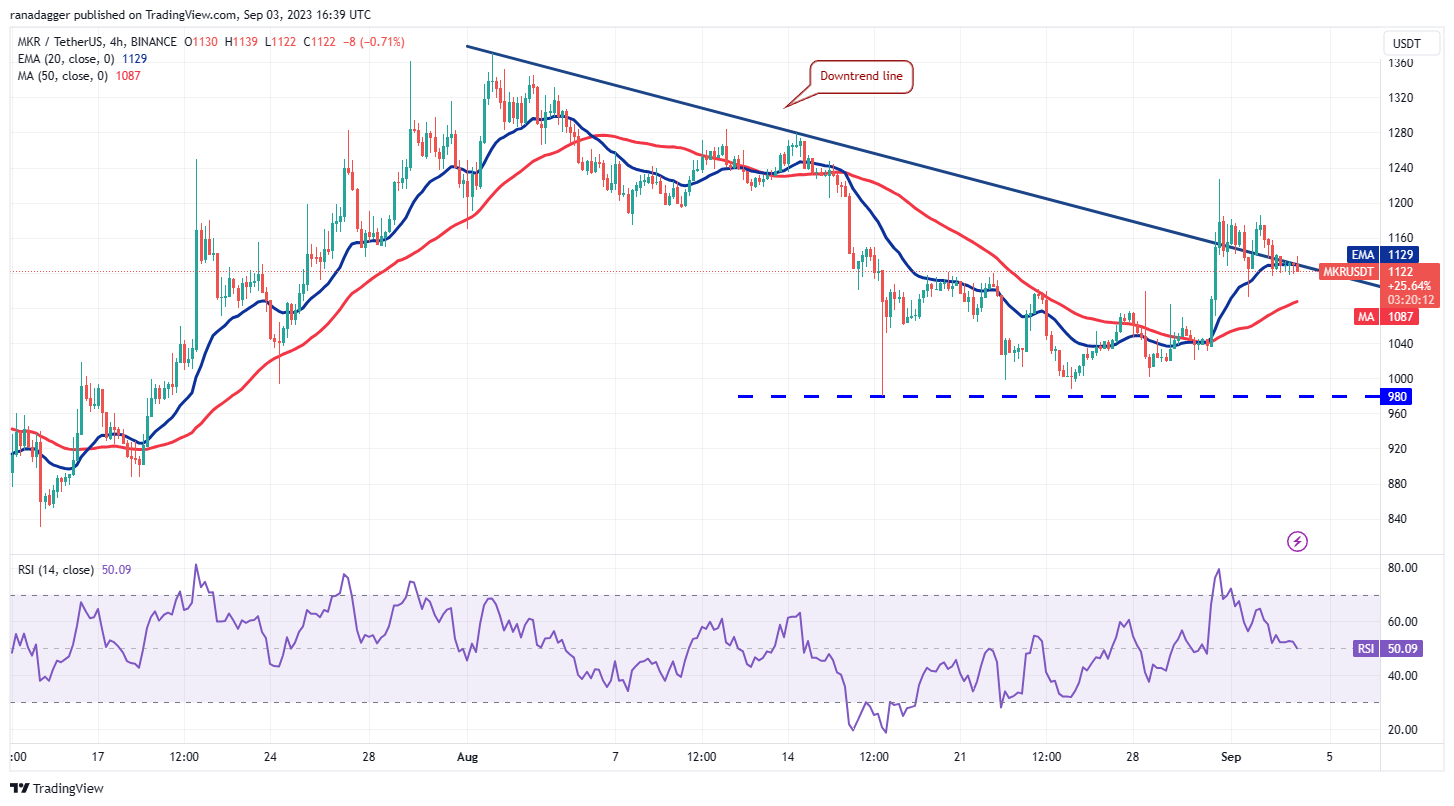 MKR/USDT 4-hour chart. Source: TradingView
The 4-hour chart illustrates that the bulls managed to push the price above the downtrend line, but they are struggling to maintain the higher levels. This indicates that bears have not surrendered yet and continue to sell during rallies.
The 20-EMA is witnessing a fierce contest between the bulls and bears. If the price rebounds from this level, the bulls will make another attempt to overcome the resistance at $1,186 and subsequently at $1,227. If this area is surpassed, the rally could extend to $1,280.
Conversely, if the price remains below the 20-EMA, it may open the door for a decline toward the 50-SMA and subsequently to $1,040.
Tezos price analysis
Tezos (XTZ) has been experiencing a battle between bulls and bears near the strong support at $0.70. The bears’ failure to push and maintain the price below this level indicates buying interest at lower levels.
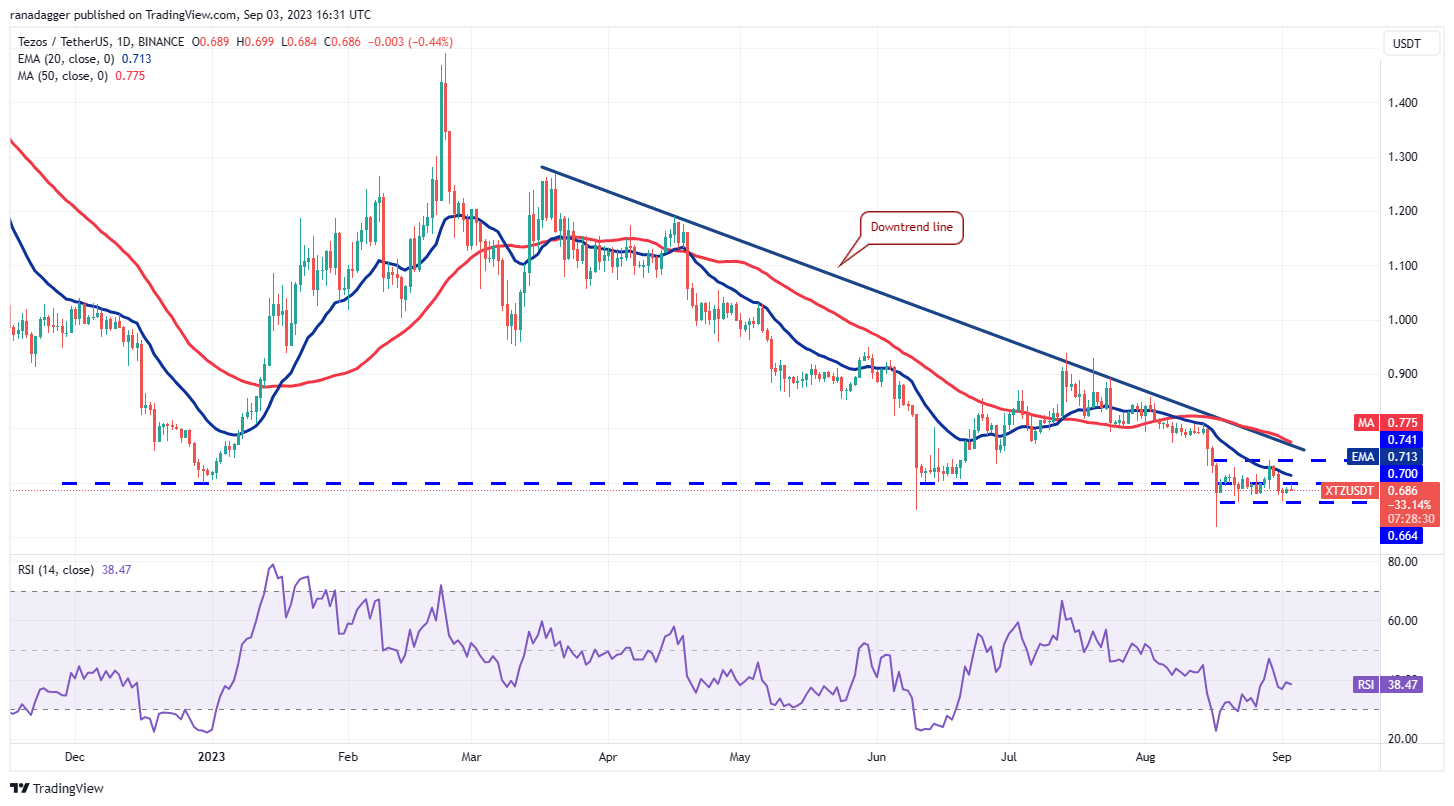 XTZ/USDT daily chart. Source: TradingView
The declining moving averages suggest an advantage for bears, but the rising RSI indicates that the bearish momentum is easing. A close above the 20-day EMA ($0.71) will serve as the first indication of strength. This could set the stage for a rally toward the downtrend line.
This level may prove to be a significant hurdle, but if the bulls can surpass it, the XTZ/USDT pair may initiate a new upward movement. The pair could initially rally to $0.94 and then to $1.04. This optimistic outlook will be negated if the price falls and holds below $0.66.
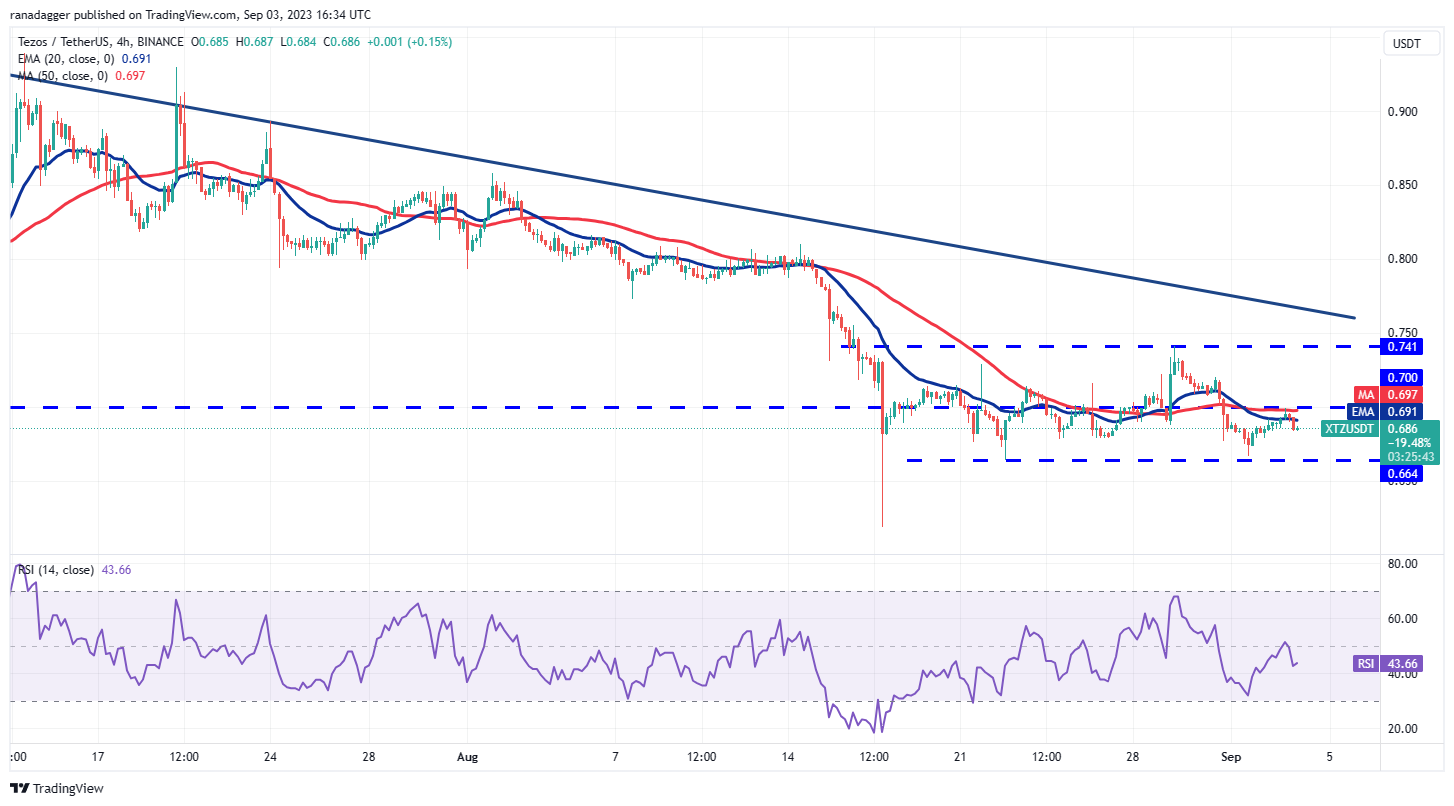 XTZ/USDT 4-hour chart. Source: TradingView
The 4-hour chart reveals that the price is consolidating between $0.69 and $0.66. The intersecting moving averages and the RSI just below the midpoint indicate that bears have a slight upper hand. Sellers will attempt to drag the price down to the strong support at $0.66. If this level breaks, the pair may initiate the next phase of the downtrend toward $0.61.
Conversely, if the price rebounds and rises above $0.69, it will signify buying interest at lower levels. The pair could then surge to the overhead resistance at $0.74. Buyers will need to push the price above the downtrend line to indicate the beginning of a new upward movement.
This article does not offer investment advice or recommendations. Every investment and trading decision carries risk, and readers should perform their own research before making a decision.