Disclaimer: Information found on CryptoreNews is those of writers quoted. It does not represent the opinions of CryptoreNews on whether to sell, buy or hold any investments. You are advised to conduct your own research before making any investment decisions. Use provided information at your own risk.
CryptoreNews covers fintech, blockchain and Bitcoin bringing you the latest crypto news and analyses on the future of money.
Bitcoin (BTC) experienced a favorable week, with prices increasing approximately 10% to hit the psychologically significant threshold of $30,000. Following this surge, investors are left pondering whether the upward trend will persist or if a reversal is imminent.
The trading team Stockmoney Lizards recently indicated that Bitcoin might soon surpass its resistance level and initiate a significant rally. They believe that the approval of the exchange-traded fund will catalyze widespread adoption and provoke this rally ahead of the halving expected in April 2024.
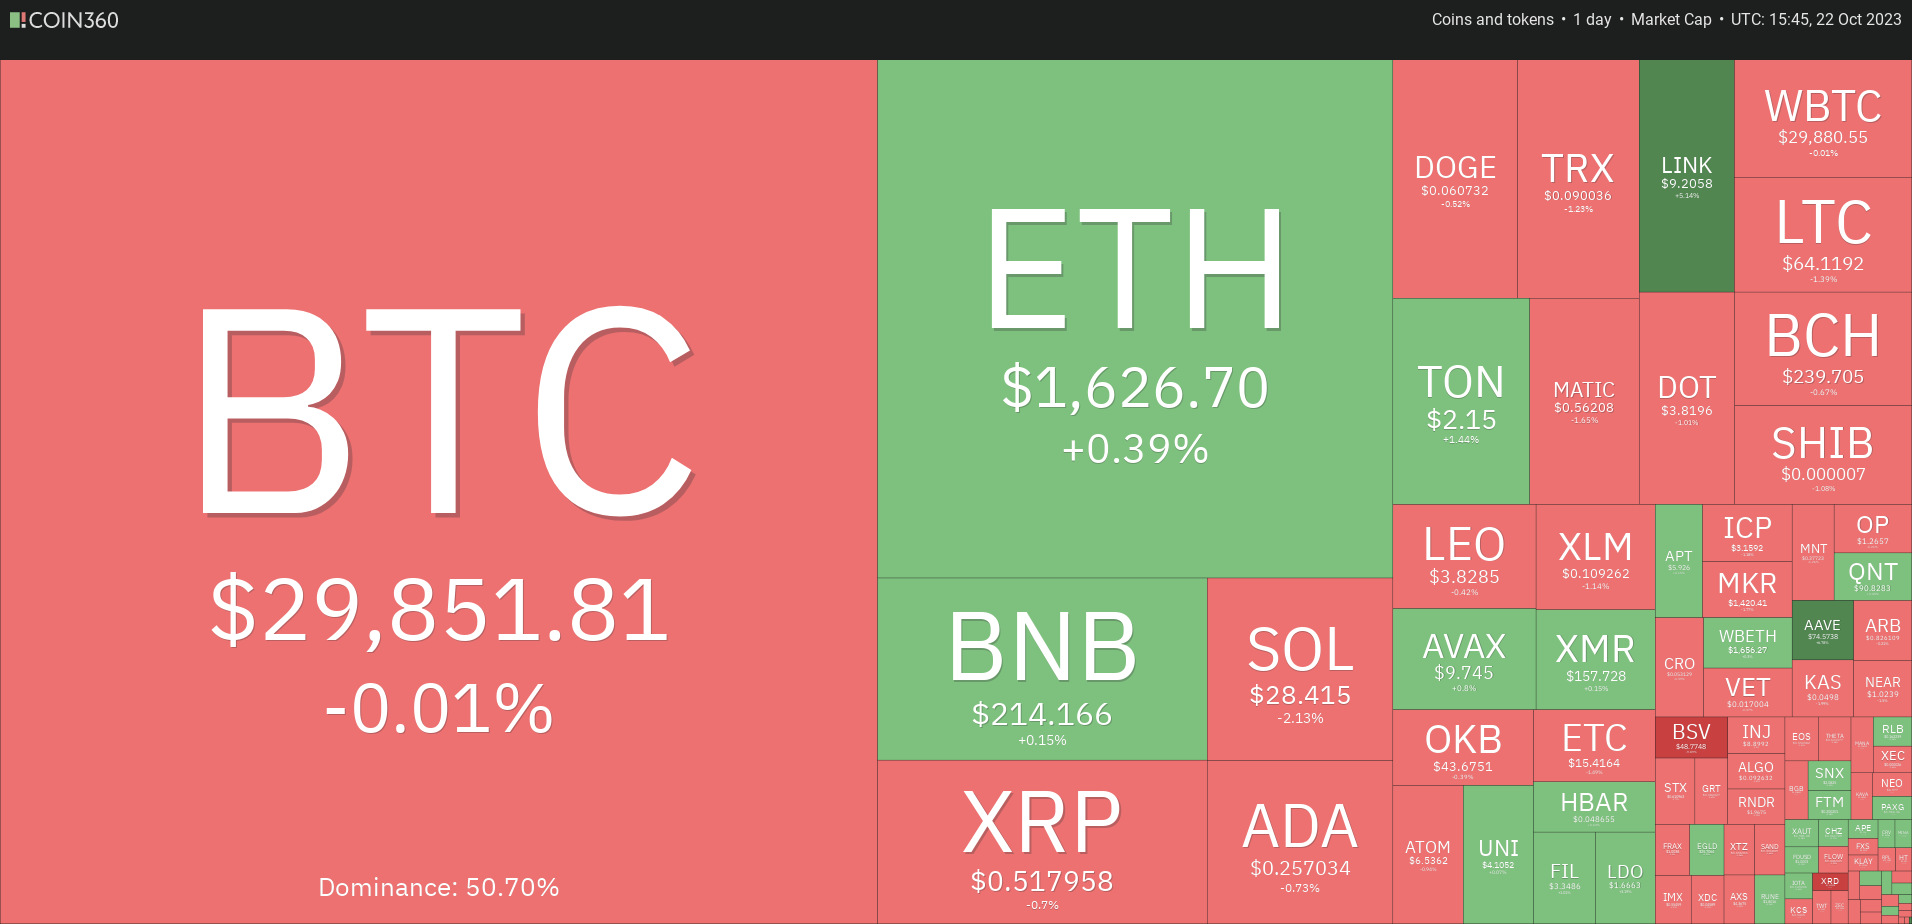
A notable advancement this week was that Bitcoin’s momentum positively influenced several altcoins, pushing them above their respective resistance levels. This indicates a gradual shift in sentiment towards the positive, suggesting it may be time to consider selective buying.
Typically, the cryptocurrencies that lead the market higher are those that perform well. Coins that lag are usually the last to gain traction, making them less attractive initially.
Let’s examine the charts of the top-5 cryptocurrencies that may excel in the near future.
Bitcoin price analysis
Bitcoin is currently engaged in a fierce struggle between bulls and bears around the $30,000 level, but a reassuring sign is that buyers have not conceded much ground.
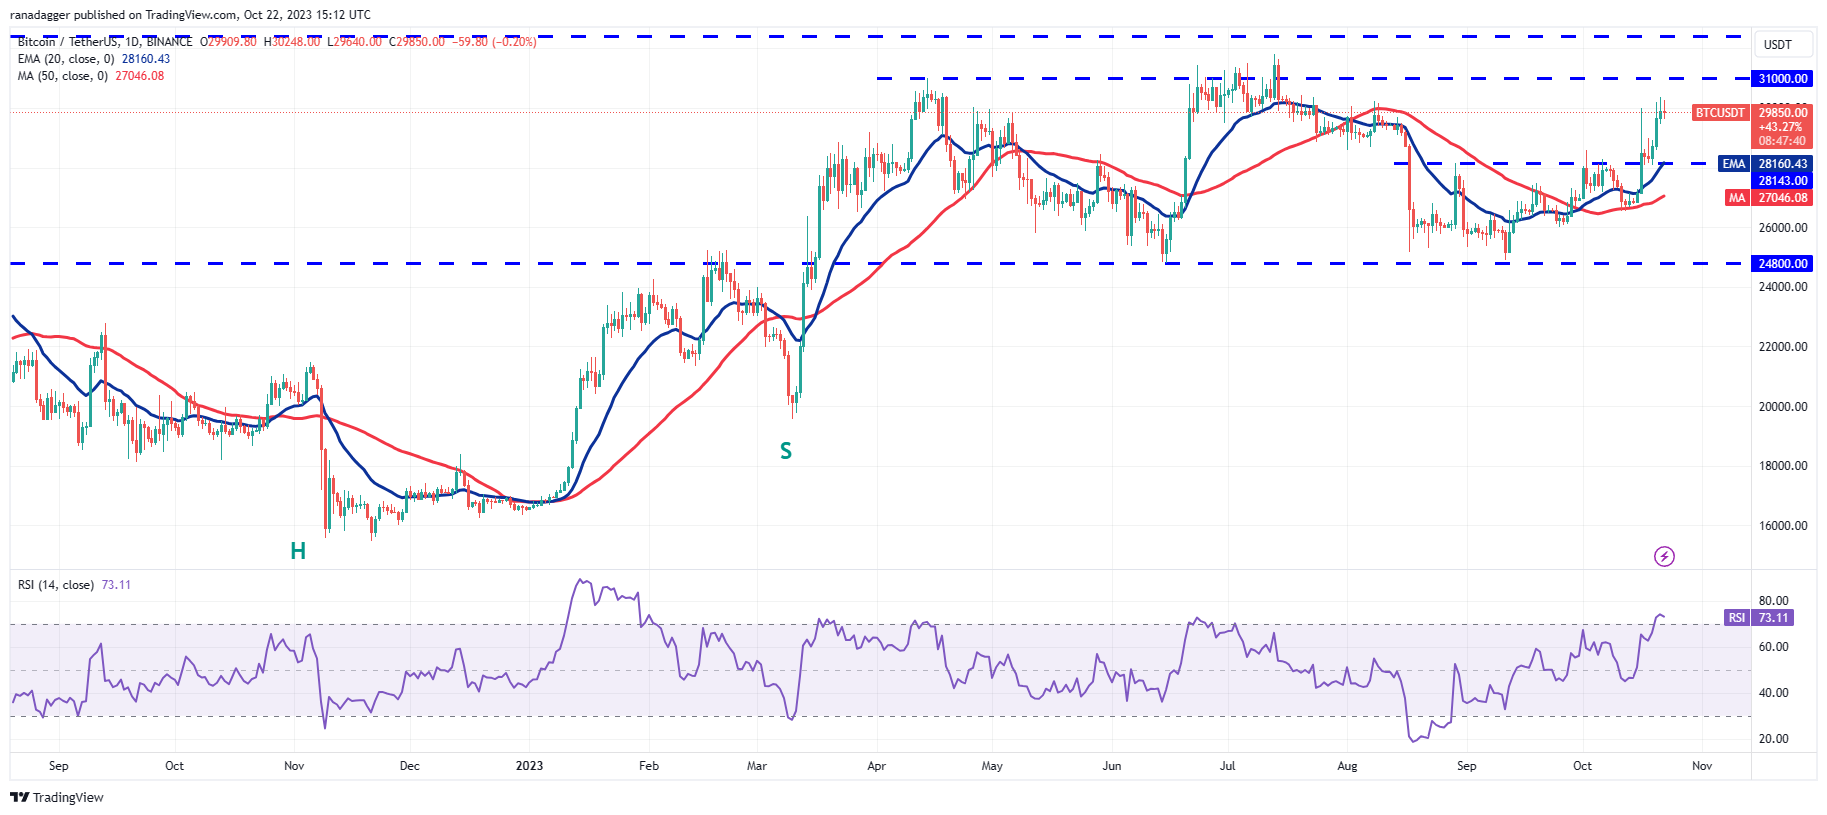
A consolidation at the present level indicates that bulls are not rushing to realize profits, as they anticipate another upward movement. This could propel the price toward the resistance area between $31,000 and $32,400.
On the other hand, if the price declines from $31,000, the BTC/USDT pair could fall to the 20-day exponential moving average ($28,160). If the price rebounds from this point, bulls will once again attempt to overcome the resistance barrier.
Positive sentiment would be negated by a drop below the 20-day EMA, which could confine the pair within the $31,000 to $24,800 range for an extended period.
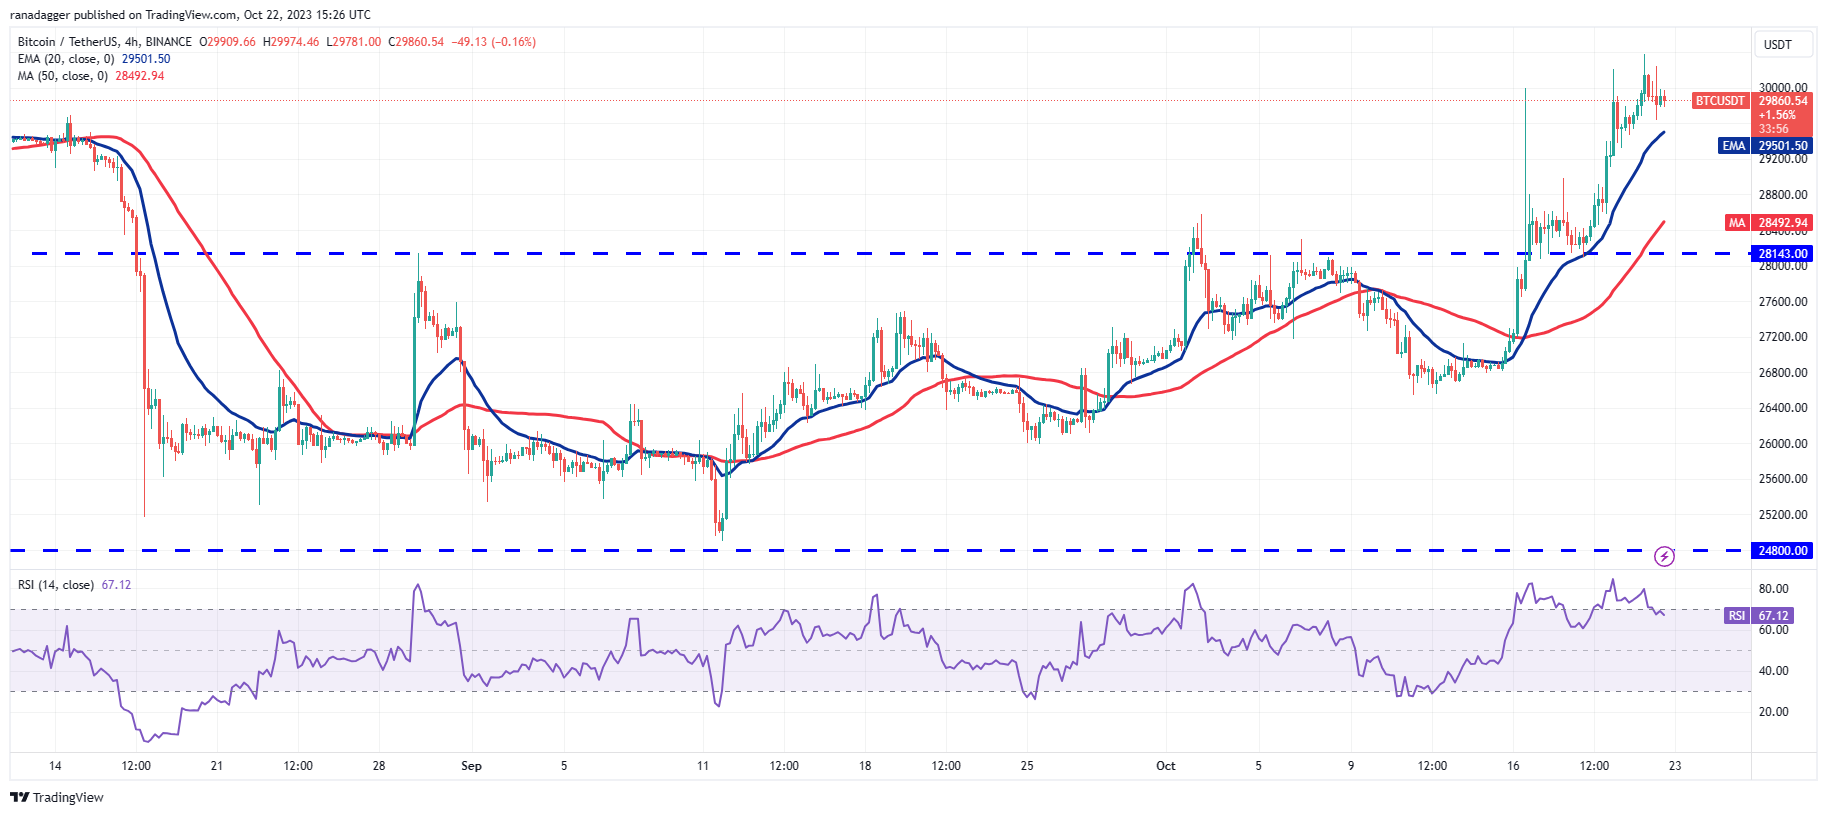
The pair is trending upward as observed in the 4-hour chart. Typically, during an ascent, traders buy the dips towards the 20-EMA. If this occurs, it will indicate that bullish sentiment remains intact and that minor dips are being purchased. The pair may then continue its path towards $32,400.
Conversely, if the price drops below the 20-EMA, it will signify that traders may be hastily closing their positions. This could pave the way for a further decline to the crucial support at $28,143.
Solana price analysis
Solana (SOL) broke out from the neckline on Oct. 19, completing a bullish inverse head and shoulders pattern, which has a target objective of $32.81.
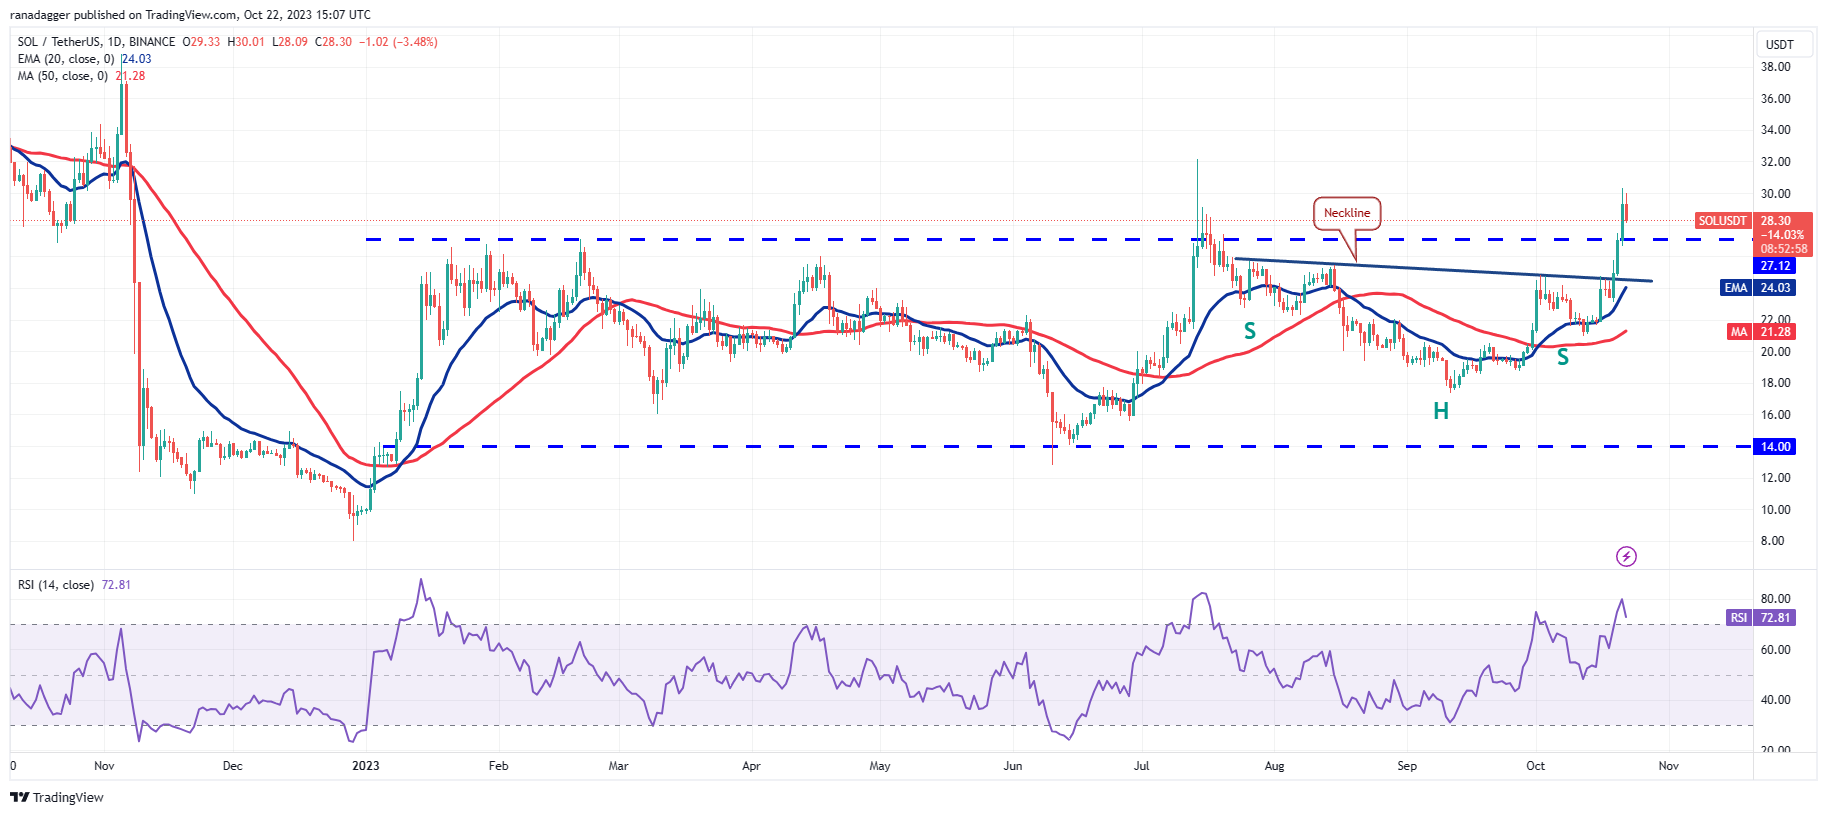
The overbought levels on the relative strength index (RSI) suggest a potential correction. The critical support to monitor on the downside is $27.12. A robust bounce from this level will indicate that bulls have converted this level into support, improving the chances of an ongoing uptrend. Beyond $32.81, the rally could extend to $39.
The bears have limited time. To stop the upward movement, they need to bring the price back below $27.12. If this occurs, the SOL/USDT pair may fall to the neckline, which remains a critical level to watch, as a drop below it would imply that the breakout above $27.12 may have been a false signal.
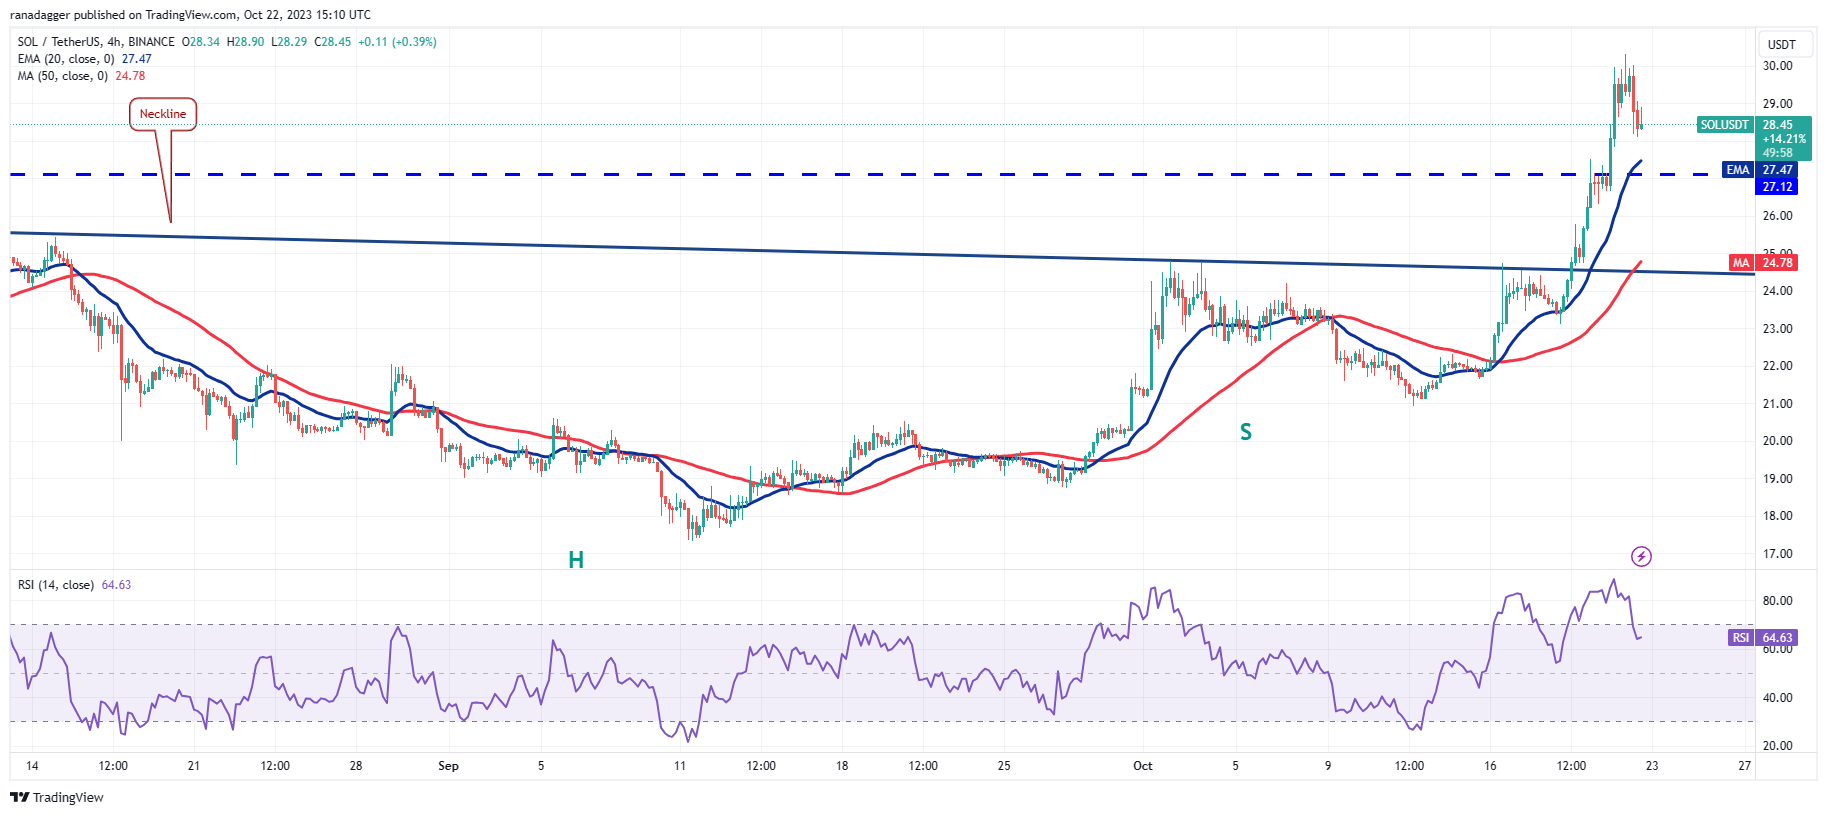
The 4-hour chart indicates that the bulls are facing significant resistance near $30. This could initiate a pullback, potentially reaching the breakout level of $27.12, which buyers are expected to defend vigorously. A strong rebound from this level may suggest a resumption of the upward movement.
Conversely, if the price declines and breaks below $27.12, it will signal that bears are aggressively selling at higher levels. The pair may then plummet to the neckline near $24.50, which may again see strong buying from the bulls.
Chainlink price analysis
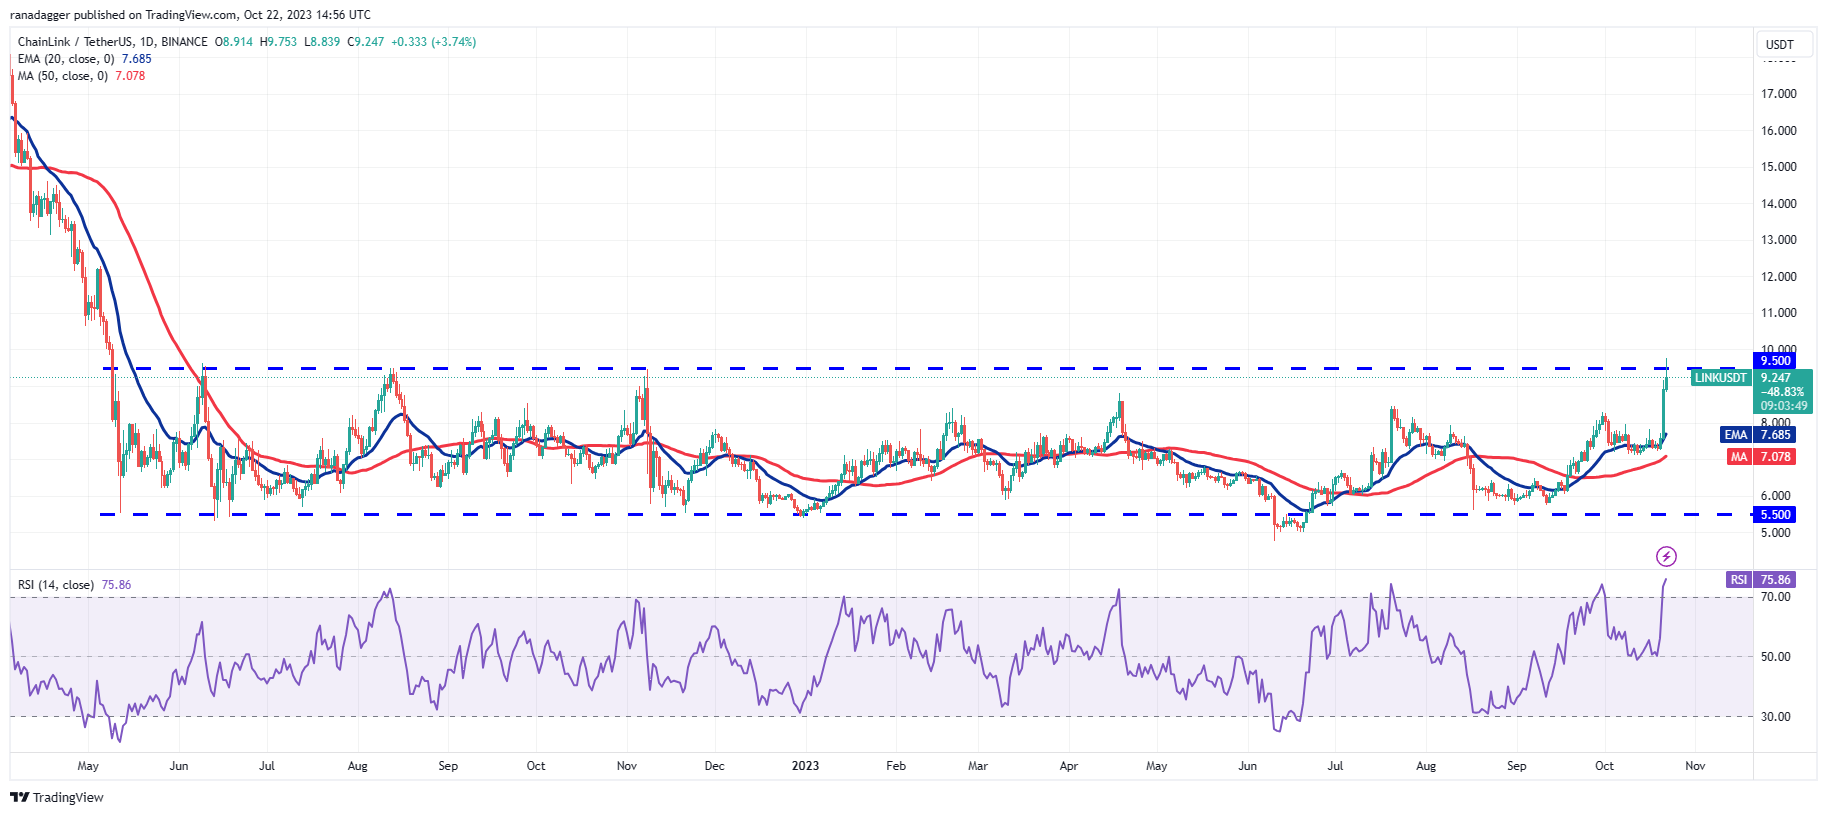
Chainlink (LINK) has been trading within a narrow range between $5.50 and $9.50 since May 2022, indicating a balance between supply and demand.
Related Posts
The bulls attempted to resolve the uncertainty upward with a breakout above the range on Oct. 22, but the long wick on the candlestick indicates that bears are not ready to relent. If the bulls maintain their ground from the current levels, it will enhance the prospects of a rally above $9.50.
The LINK/USDT pair could then begin a move toward the pattern target of $13.50. Typically, a breakout from a prolonged consolidation leads to a sharp rally. In this scenario, the uptrend could extend to $15 and eventually to $18.
The initial support on the downside is at $8.50. If bears manage to pull the price below this level, it will suggest that the range-bound action may persist for a while longer.
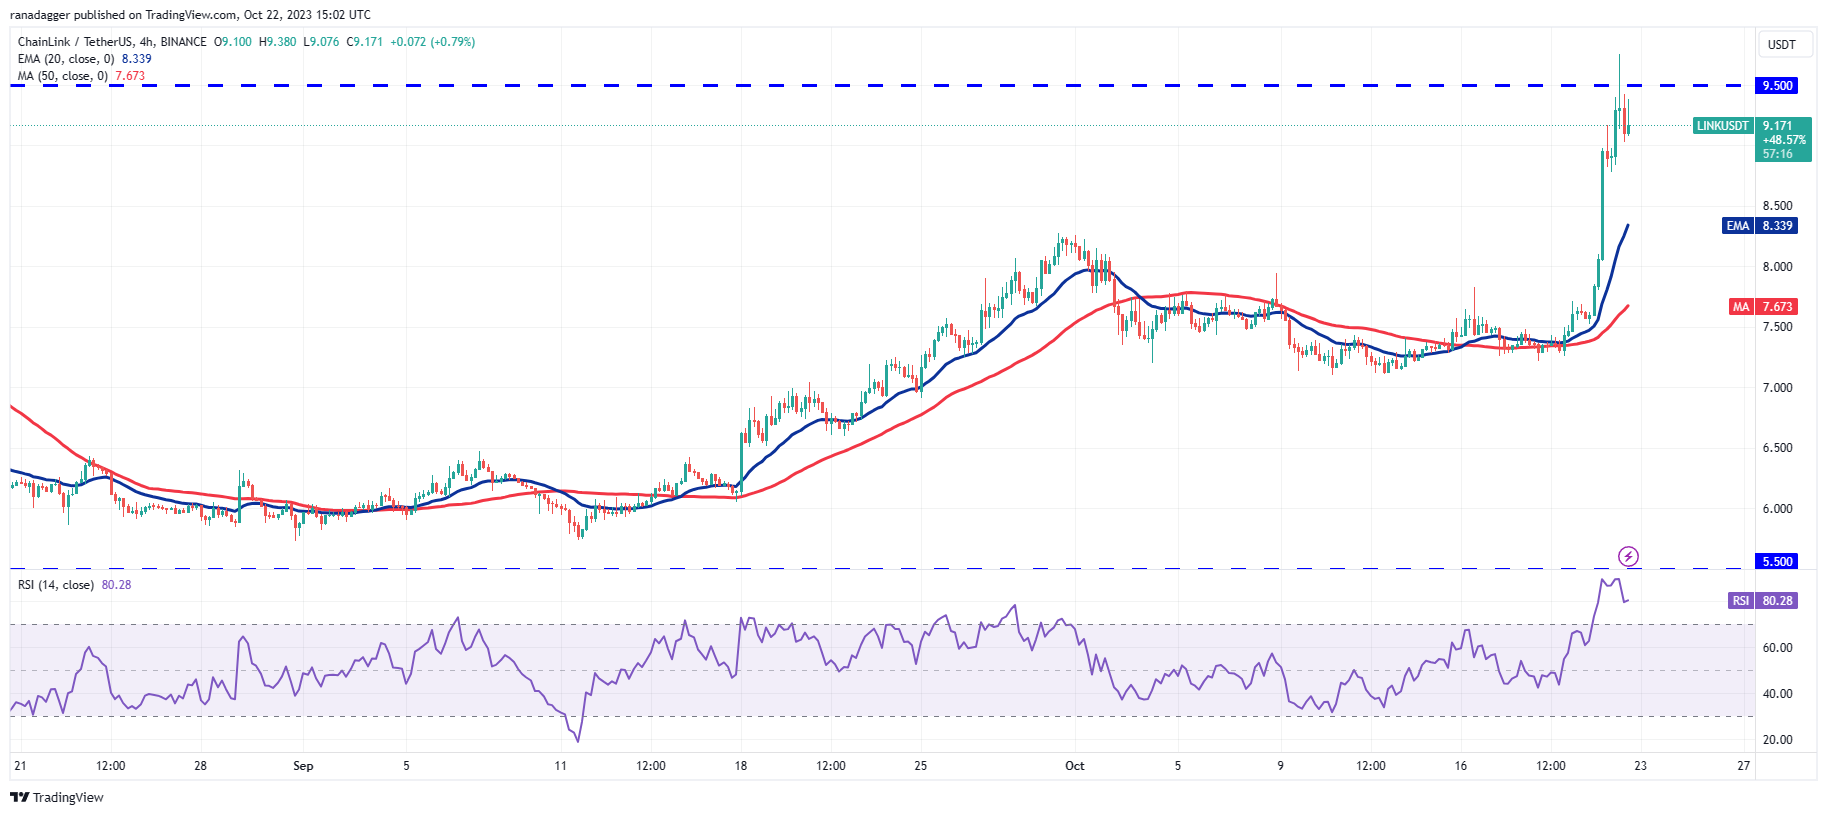
The pair experienced a significant rally from $7.50, which pushed the RSI deep into overbought territory on the 4-hour chart, suggesting that the rally may be overextended in the near term, leading to a possible pullback or consolidation.
The firm support on the downside is at $8.75 and then $8.50. A strong rebound from this zone will imply that the sentiment remains positive and that traders are buying on dips, which will increase the likelihood of a retest of $9.75.
Conversely, a drop below the 20-EMA will indicate that the bears are regaining control. The pair may then decline to $7.
Related: Lightning Network faces criticism from pro-XRP lawyer John Deaton
Aave price analysis
Aave (AAVE) surpassed the downtrend line on Oct. 21, invalidating the bearish descending triangle pattern. Typically, the failure of a negative setup initiates a bullish movement.
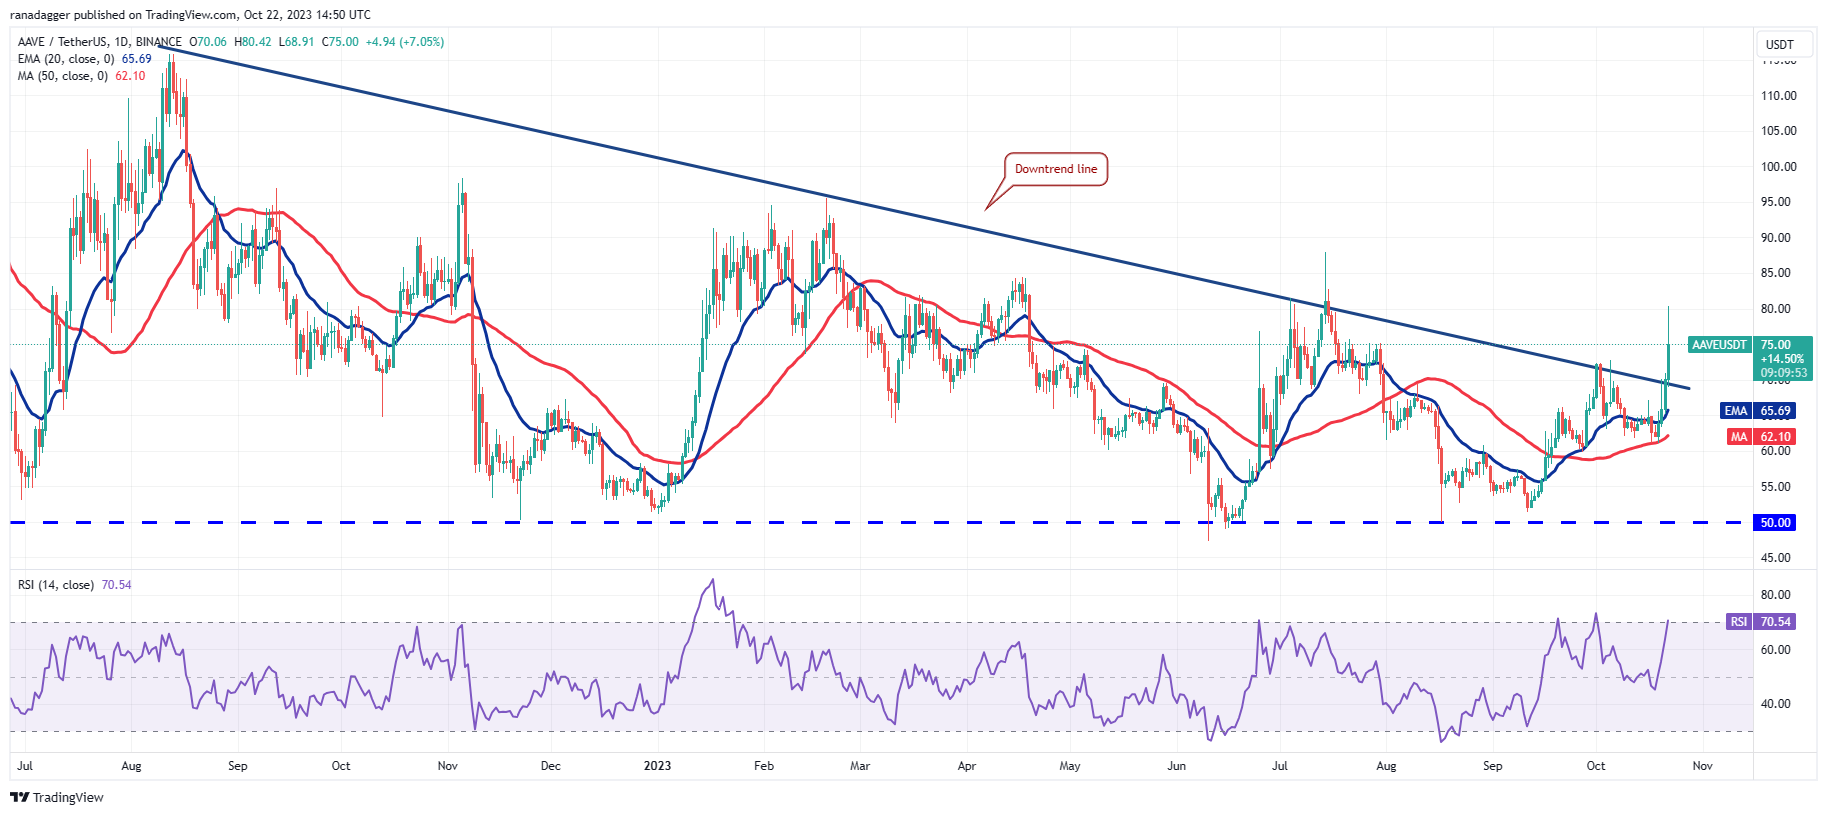
Both moving averages have started to trend upward, and the RSI is in the overbought range, indicating that bulls are at an advantage. If the price remains above the downtrend line, the AAVE/USDT pair may initially rise to $88 and then to $95.
To thwart this upward movement, bears must quickly pull the price back below the downtrend line. This could catch some aggressive bulls by surprise and initiate a correction towards the moving averages. A drop below the 50-day simple moving average ($62) would signal a return of bearish control.
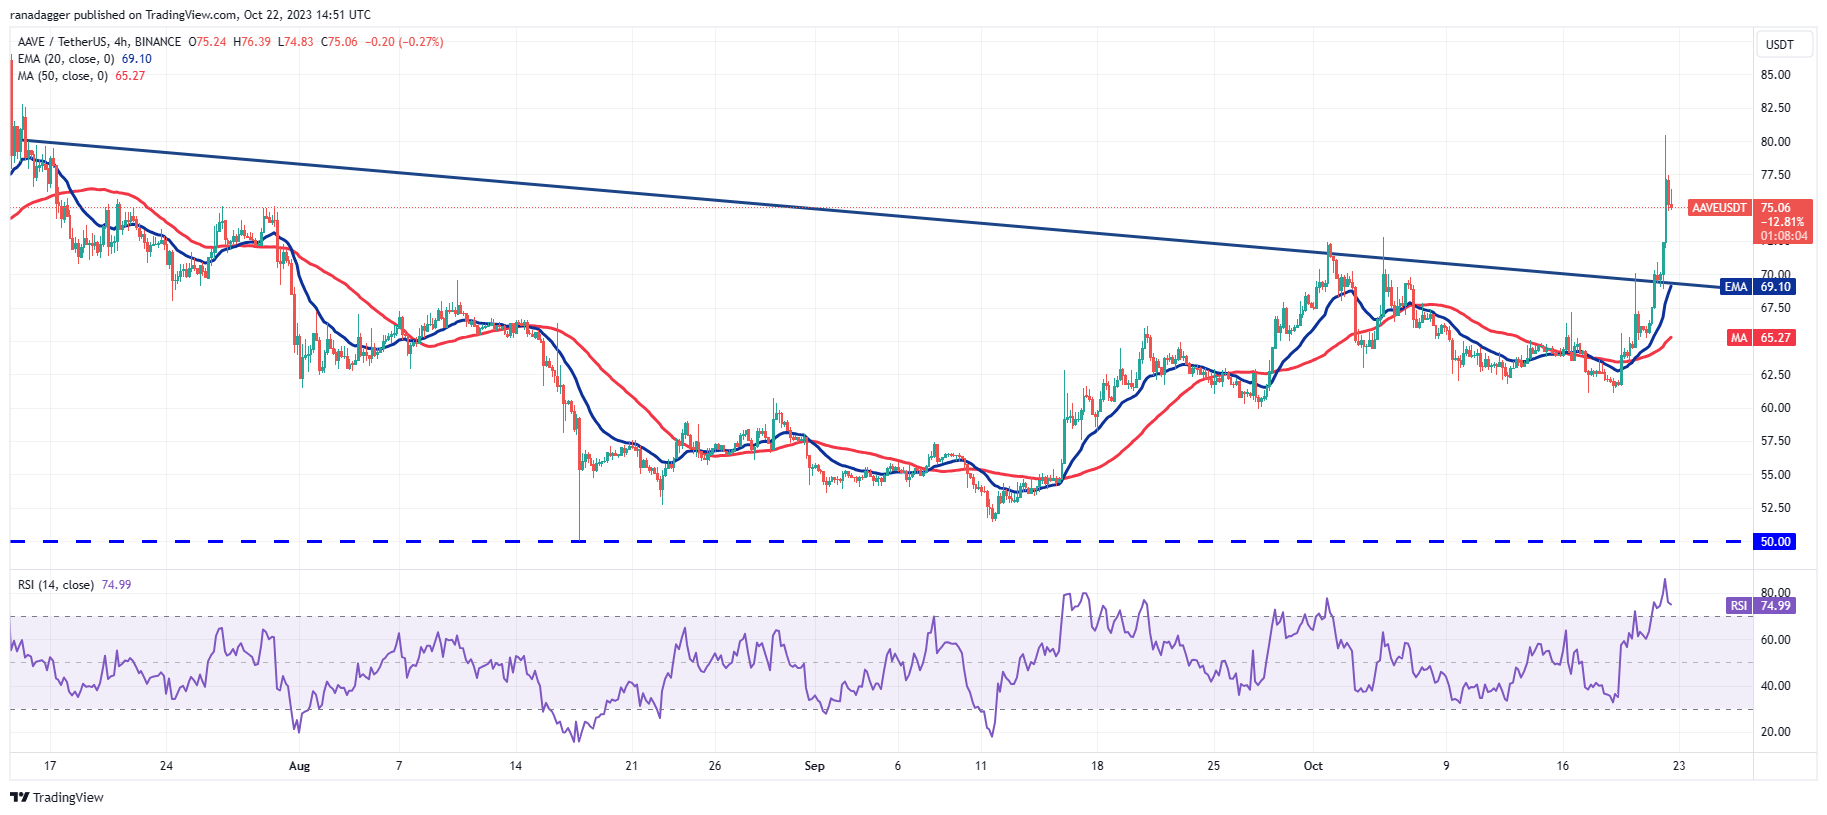
The 4-hour chart illustrates that bears attempted to halt the relief rally at the downtrend line, but bulls did not relinquish much ground. The momentum has increased, and the pair is on its way toward $88.
A minor concern in the short term is that the RSI has surged into the overbought area, suggesting a potential consolidation or correction. The first support on the way down is at $72. Bears will need to pull the price below the downtrend line to trap the bulls.
Stacks price analysis
Stacks (STX) has surged sharply in recent days, indicating that bulls are attempting to initiate a new uptrend.
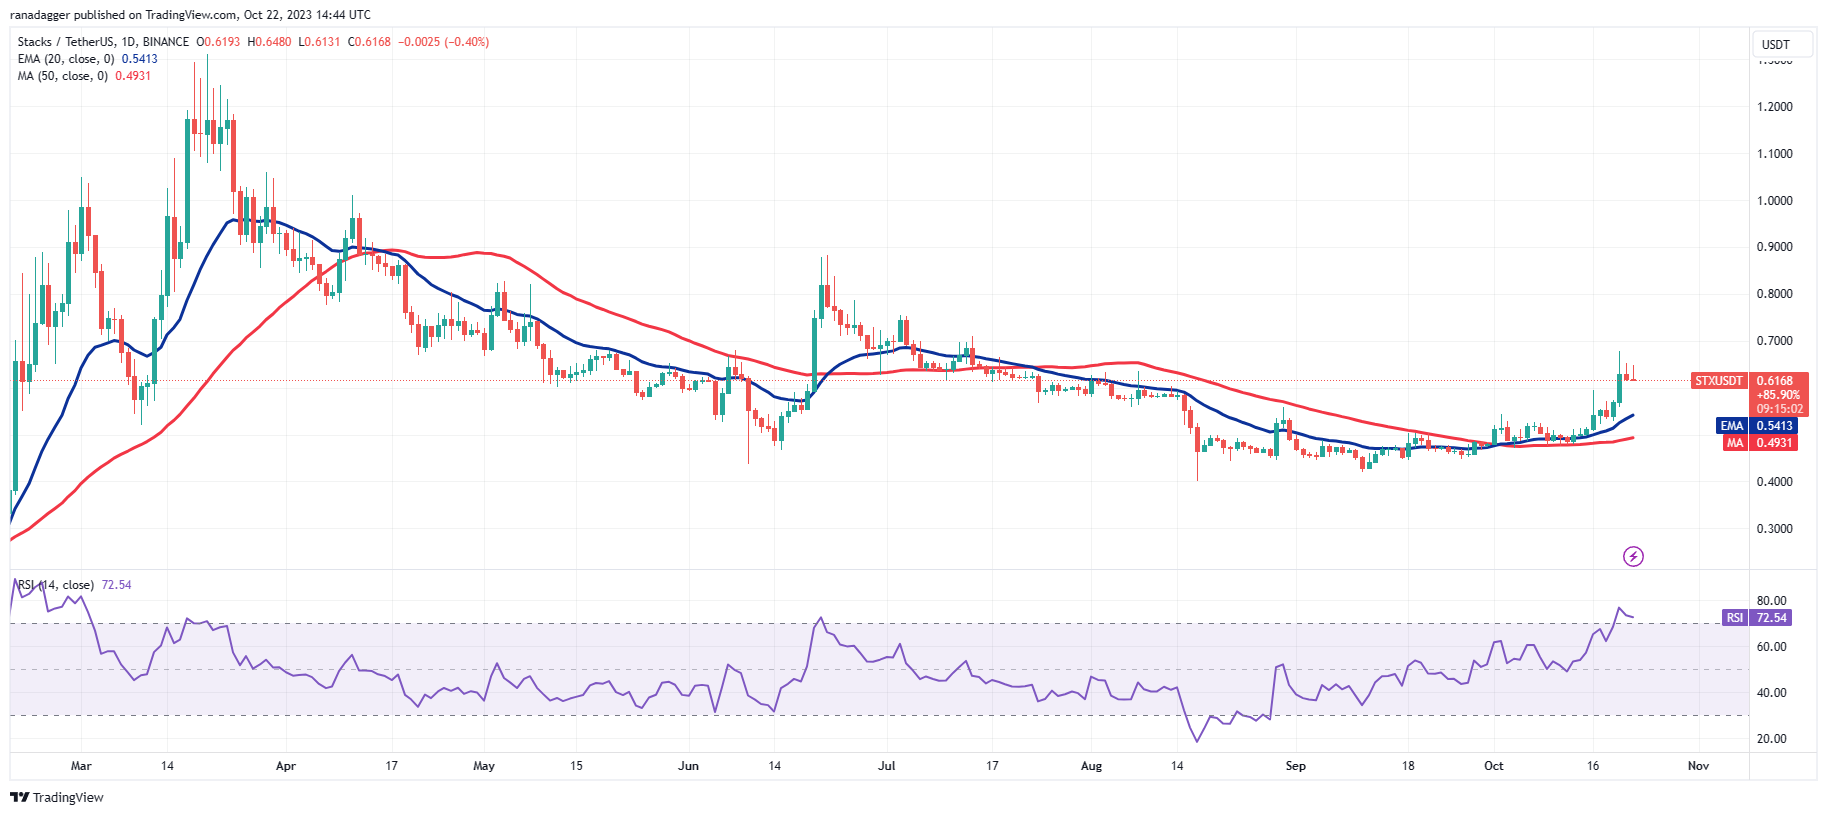
The bullish crossover on the moving averages indicates that bulls hold an advantage. In the short term, the overbought levels on the RSI suggest a minor correction or consolidation could be on the horizon. The initial support on the downside is the 20-day EMA ($0.54).
If the price rebounds from this level, it will signal a shift in sentiment from selling on rallies to buying on dips, thereby increasing the chances of continued upward movement. The STX/USDT pair could initially rise to $0.80 and subsequently to $0.90.
This optimistic outlook will be invalidated in the near term if the price declines and falls below the 20-day EMA.
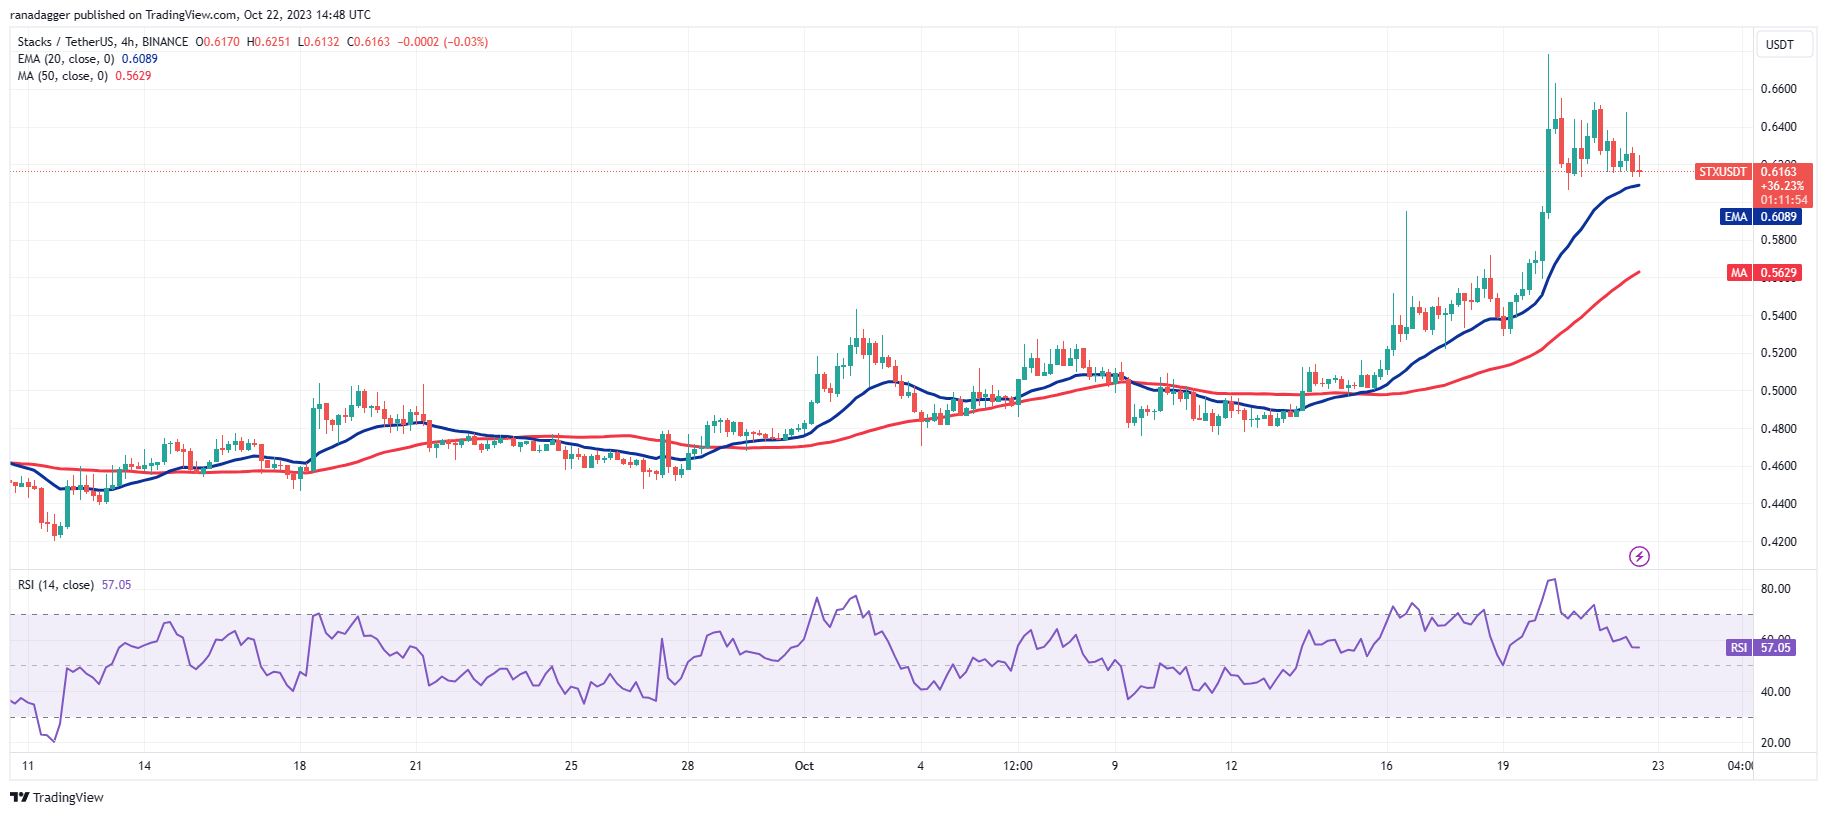
The price has been consolidating within a narrow range between $0.61 and $0.65, as seen in the 4-hour chart. This is a positive indication, showing that bulls are not rushing to exit, anticipating another upward movement. If buyers push the price above $0.65, the pair will attempt a rally to $0.68 and then to $0.75.
Conversely, if the price declines and breaks below the 20-EMA, it will indicate profit-taking by short-term traders. The pair may then drop to the 50-SMA.
This article does not contain investment advice or recommendations. Every investment and trading move involves risk, and readers should conduct their own research when making a decision.