Disclaimer: Information found on CryptoreNews is those of writers quoted. It does not represent the opinions of CryptoreNews on whether to sell, buy or hold any investments. You are advised to conduct your own research before making any investment decisions. Use provided information at your own risk.
CryptoreNews covers fintech, blockchain and Bitcoin bringing you the latest crypto news and analyses on the future of money.
Bitcoin price prepares for a significant shift as ADA, XLM, AAVE, and CFX show upward momentum.
The extended weekend has not resulted in any significant movement in Bitcoin (BTC) prices, which remain confined within a progressively narrowing range. Bitcoin is poised to establish a third consecutive Doji candlestick formation on the weekly chart, indicating uncertainty among both bulls and bears regarding the forthcoming directional shift.
Bitcoin is not the only cryptocurrency experiencing range-bound trading. On April 7, Jurrien Timmer, the global macro director at Fidelity Investments, tweeted that the S&P 500 Index has been trapped in a range for the last nine months, suggesting that a breakout is imminent “sooner or later.”
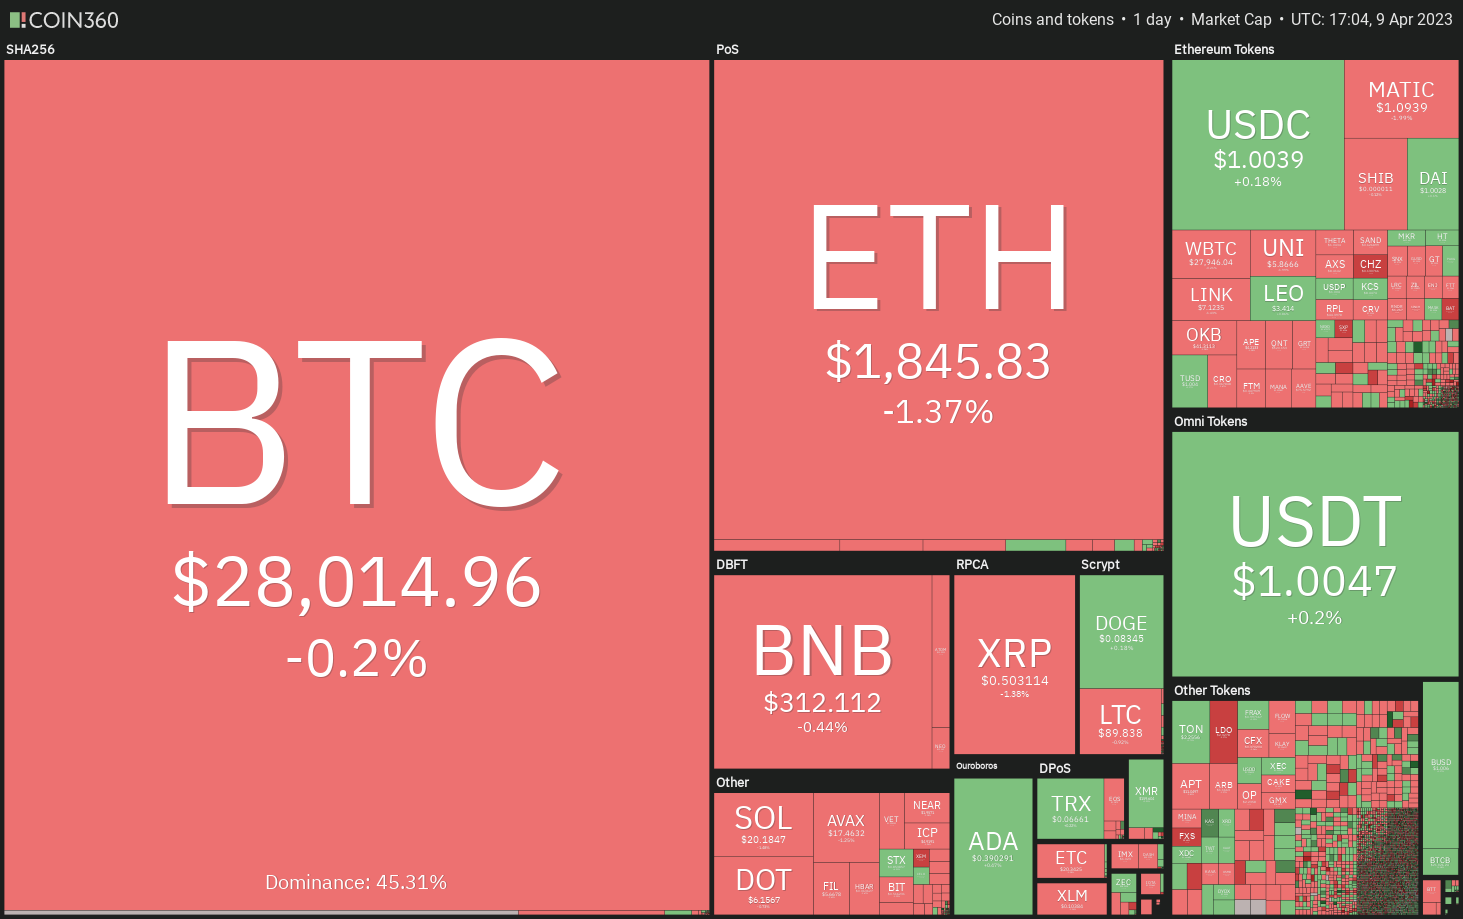 Crypto market data daily view. Source:Coin360
Bitcoin’s inability to surpass the $30,000 mark has led to profit-taking in various altcoins, although some have experienced only minor pullbacks. This behavior indicates that traders are maintaining their positions in anticipation of a potential upward movement.
Let’s analyze the charts of selected altcoins that could initiate an uptrend if Bitcoin breaks out to the upside. What resistance levels must be surpassed for these five cryptocurrencies to turn bullish?
Bitcoin price analysis
Bitcoin has been trading within a narrow range for the past two days, reflecting indecision among market participants. Typically, such tight ranges precede an increase in volatility.
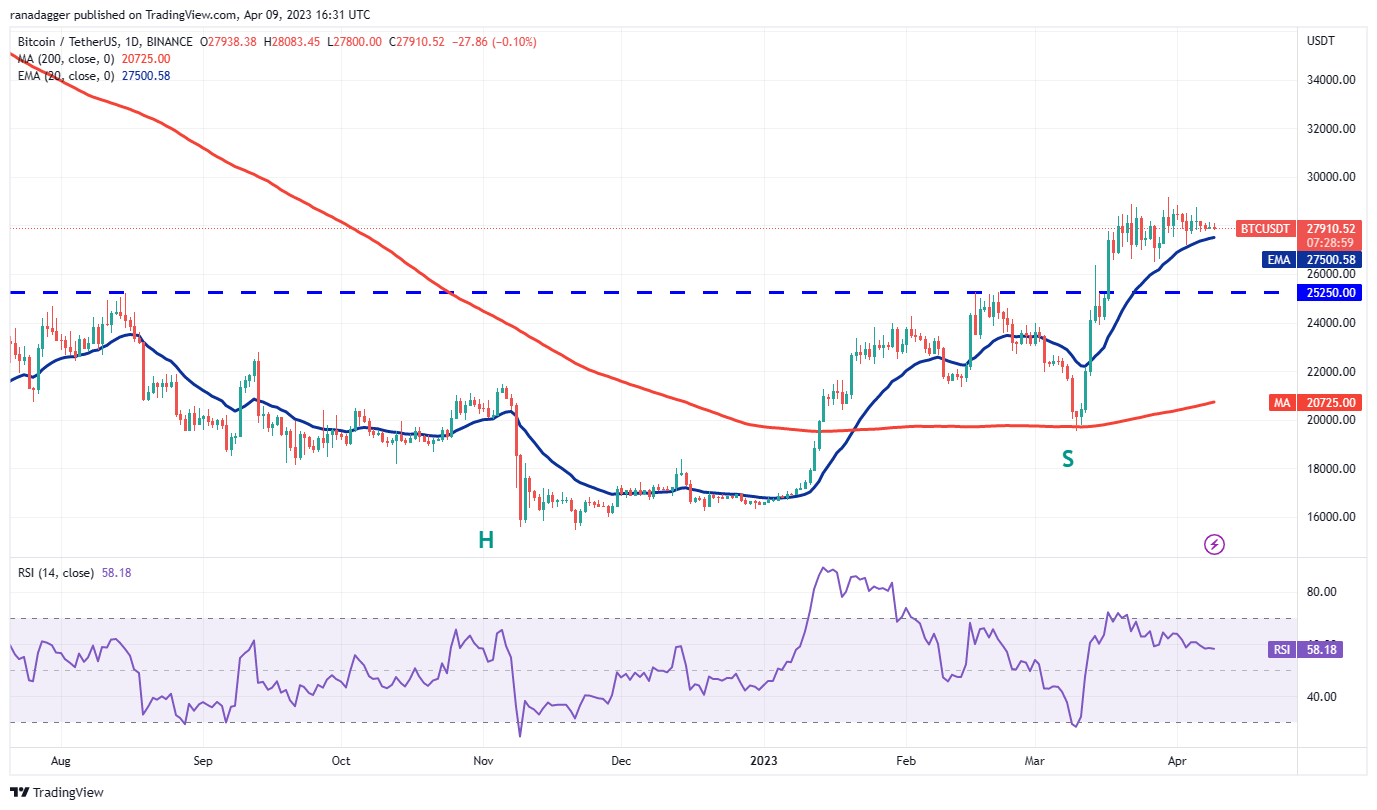 BTC/USDT daily chart. Source: TradingView
The 20-day exponential moving average ($27,500) is stabilizing, and the relative strength index (RSI) has been gradually declining toward the midpoint. This indicates a balance between supply and demand.
If the price falls below the 20-day EMA, it may trigger several short-term stop losses, potentially causing the BTC/USDT pair to drop to the breakout level of $25,250.
On the other hand, if the price bounces back from the 20-day EMA with strength, it will suggest that market sentiment remains positive and traders are buying on dips. A rise above $29,200 could improve the chances of a rally to $30,000 and subsequently to $32,500.
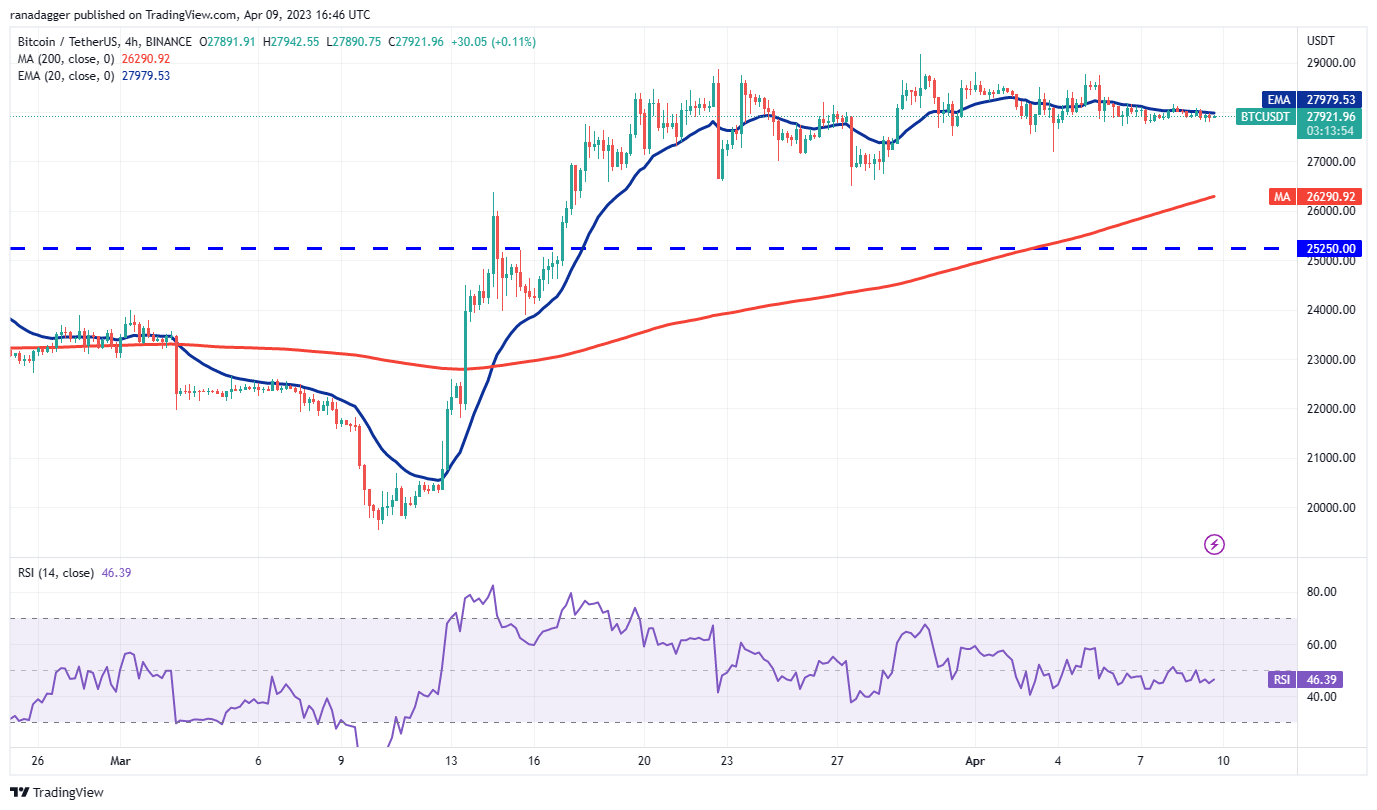 BTC/USDT 4-hour chart. Source: TradingView
The 20-EMA is also stabilizing on the four-hour chart, with the RSI positioned just below the midpoint. This does not provide a definitive advantage to either bulls or bears. This uncertainty is unlikely to persist for long, and a directional move could commence soon. However, predicting the direction of the breakout remains challenging.
Thus, it is advisable to wait for the breakout to occur before making directional bets. The key levels to monitor are $29,200 on the upside and $26,500 on the downside. A breach of either level could initiate a short-term trending movement.
Cardano price analysis
The bulls are preventing Cardano (ADA) from falling below the 20-day EMA ($0.37), indicating demand at lower price levels.
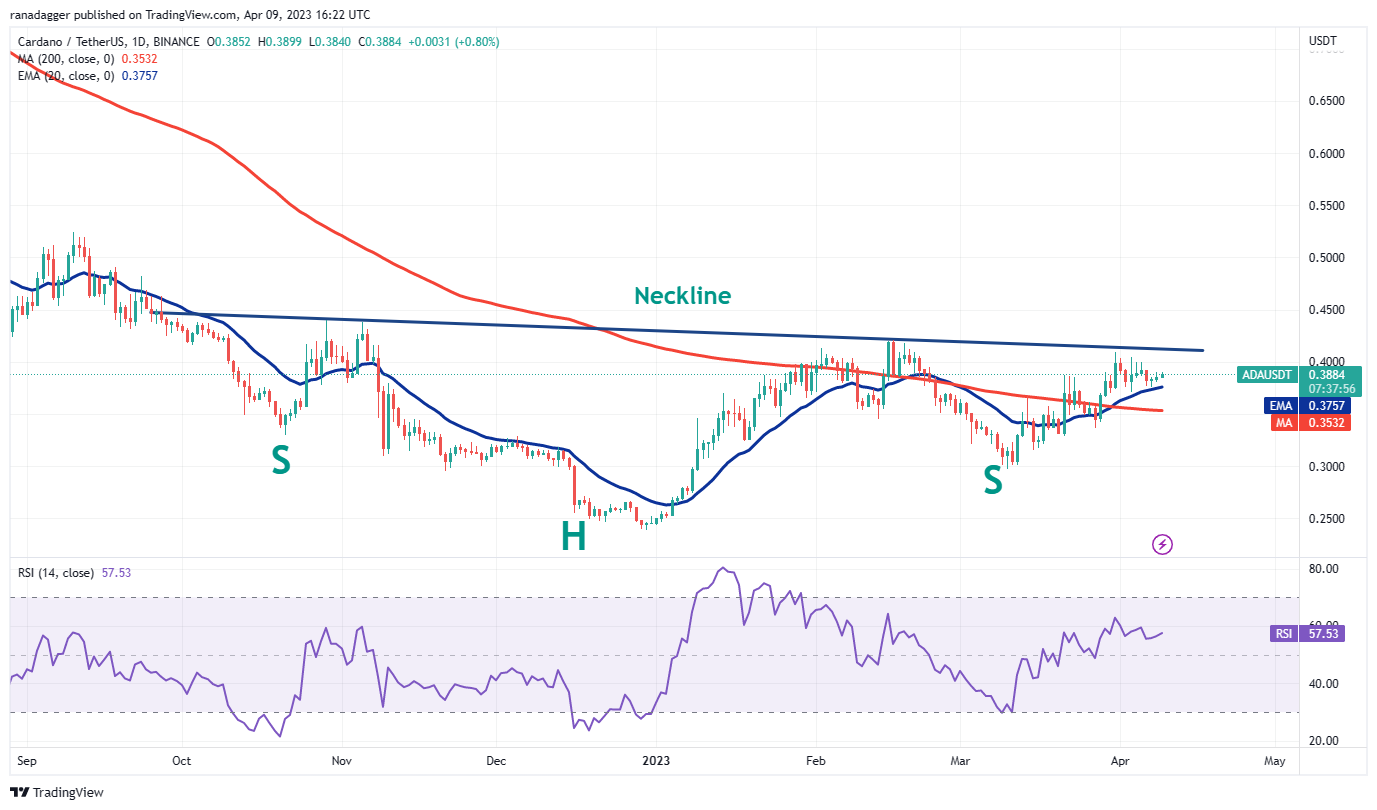 ADA/USDT daily chart. Source: TradingView
The upward-sloping 20-day EMA and the RSI in the positive zone suggest that the path of least resistance is upward. The ADA/USDT pair may first rise to the neckline of the inverse head-and-shoulders pattern. A breakout and close above this resistance will indicate a potential trend reversal. The pair could then advance toward the pattern target of $0.60.
If the bears aim to thwart the upward movement, they must quickly pull the price back below the 20-day EMA. The pair may then decline to the 200-day simple moving average ($0.35) and subsequently to $0.30.
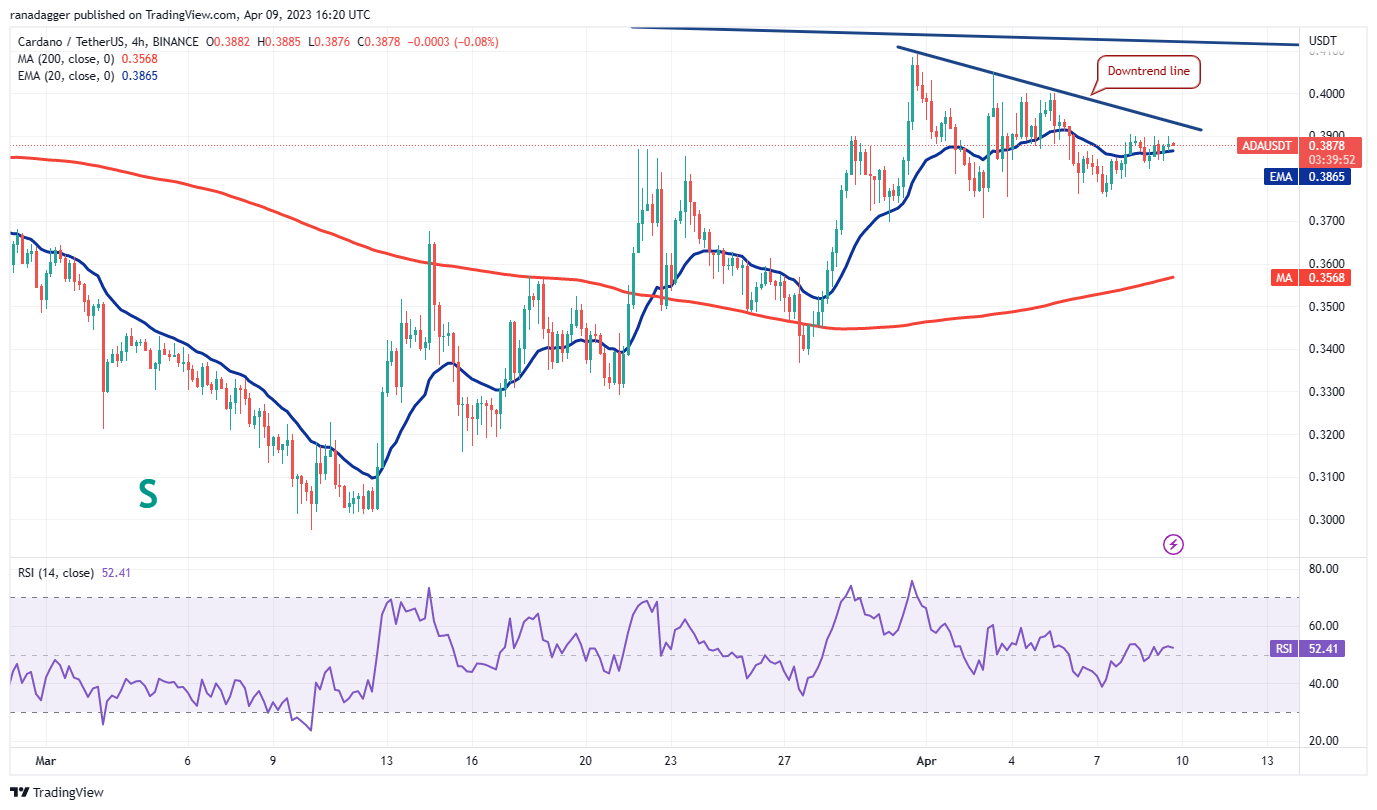 ADA/USDT 4-hour chart. Source: TradingView
The four-hour chart indicates that the bulls have managed to push the price above the 20-EMA and will next attempt to overcome the resistance at the downtrend line. If successful, it will suggest that the pullback may be concluding. The pair may then rise to the neckline, where the bears are expected to mount a strong defense.
Conversely, if the price encounters resistance at the downtrend line, it will indicate that bears are active at higher levels. Selling pressure could intensify below $0.37, potentially causing the pair to drop to the 200-SMA.
Stellar price analysis
Stellar (XLM) has retreated from the overhead resistance of $0.12, and the price is approaching the 20-day EMA ($0.10). The bulls are likely to buy the dips toward the 20-day EMA.
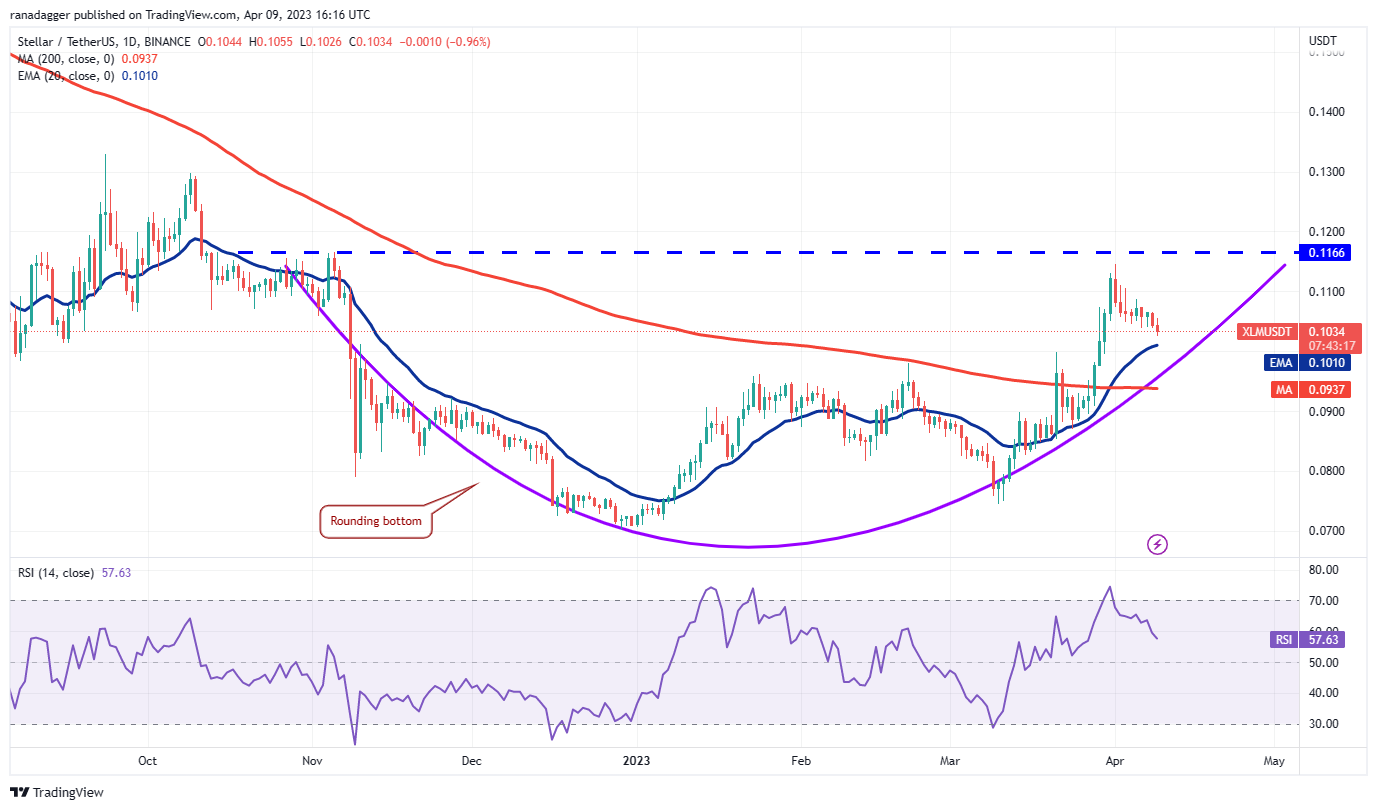 XLM/USDT daily chart. Source: TradingView
Related Posts
If the price rebounds from the 20-day EMA, the bulls will again attempt to overcome the overhead resistance. If they succeed, the XLM/USDT pair will complete a bullish rounding bottom pattern, signaling the potential onset of a new upward movement. The pair may first rise to $0.15 and subsequently target the pattern goal of $0.17.
In contrast, if the price declines and breaks below the 20-day EMA, it will indicate that bulls are losing control. The pair may then fall to the 200-day SMA ($0.09). This level is crucial for the bulls, as a breakdown could lead to a drop to $0.07.
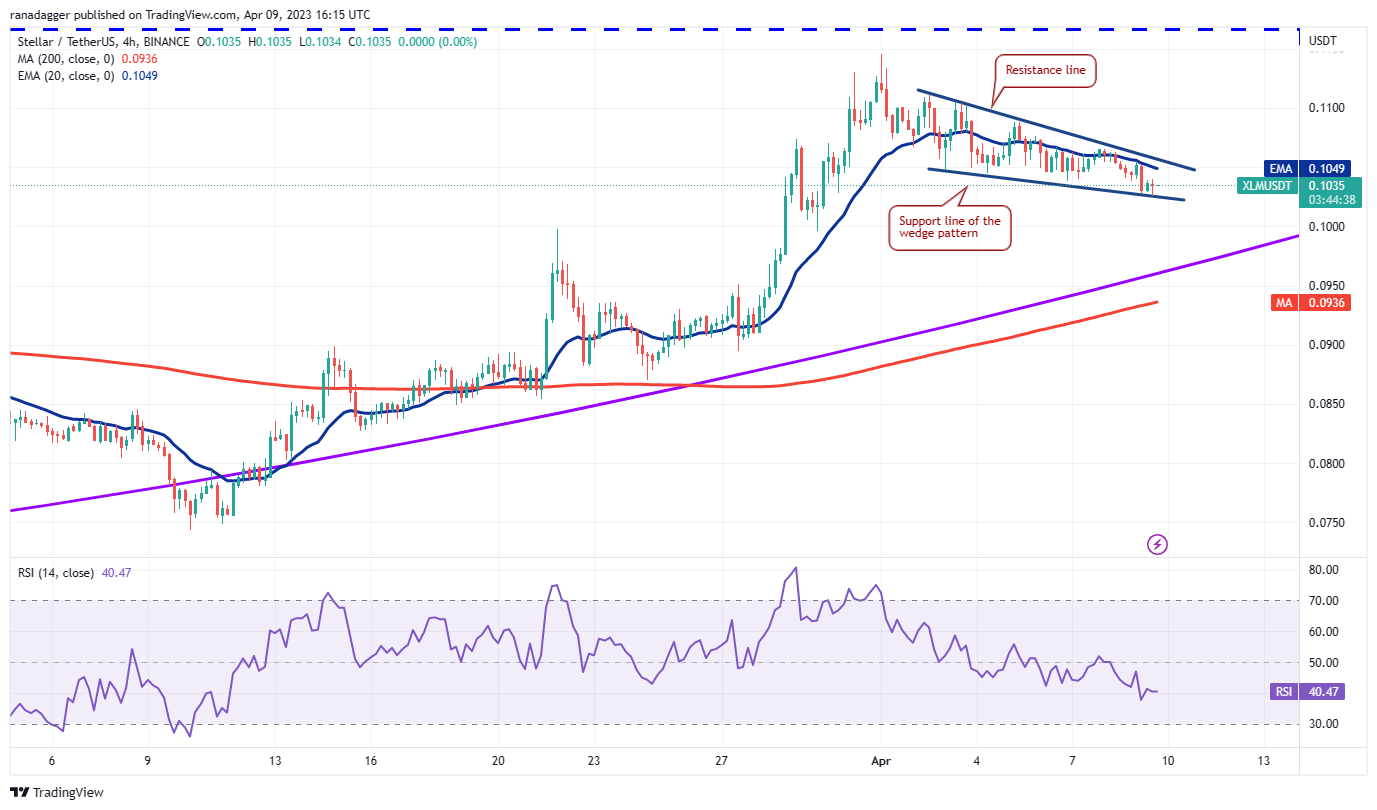 XLM/USDT 4-hour chart. Source: TradingView
The four-hour chart reveals that the pair is correcting within a falling wedge pattern. The price has rebounded off the support line, and the bulls will next try to push the pair above the wedge. If they succeed, the pair could rally to $0.11 and then to $0.12.
On the flip side, if the price declines and falls below the support line, it will suggest that selling pressure has intensified. There is minor support at $0.10, but if that level fails, the decline could extend to the 200-SMA.
Related: SushiSwap approval bug leads to $3.3 million exploit
Aave price analysis
Aave (AAVE) has declined from the overhead resistance of $82, indicating that bears are strongly defending this level. They have pushed the price below the immediate support at the 20-day EMA ($75).
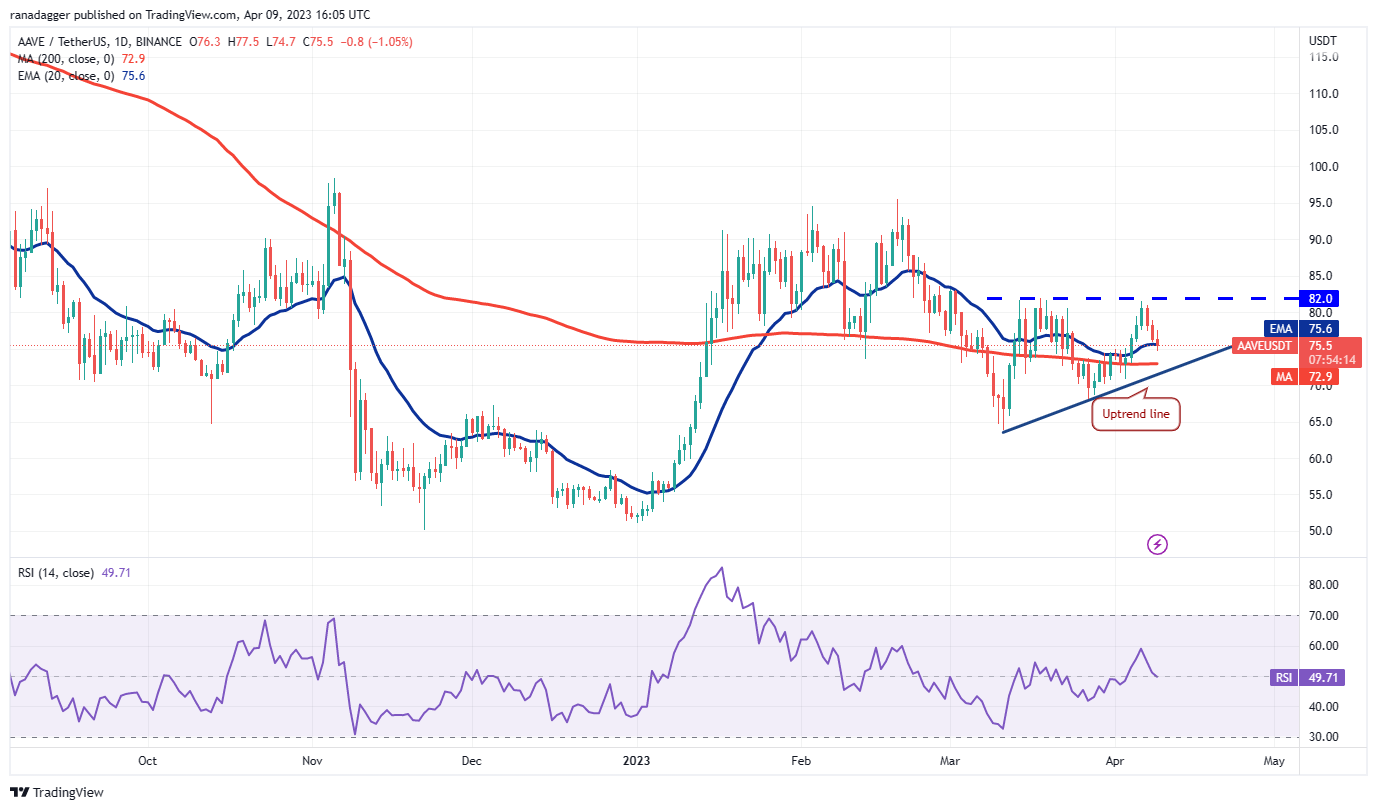 AAVE/USDT daily chart. Source: TradingView
The AAVE/USDT pair may next slide to the 200-day SMA ($73), which is near the uptrend line. Buyers are likely to defend this level vigorously. If the price rebounds from the uptrend line and breaks above the 20-day EMA, the pair could reach $82.
If bulls surpass this barrier, the pair will complete an ascending triangle pattern, which has a target objective of $100. This bullish outlook will be invalidated if the price continues to decline and breaks below the uptrend line. The pair may then fall to $68 and subsequently to $64.
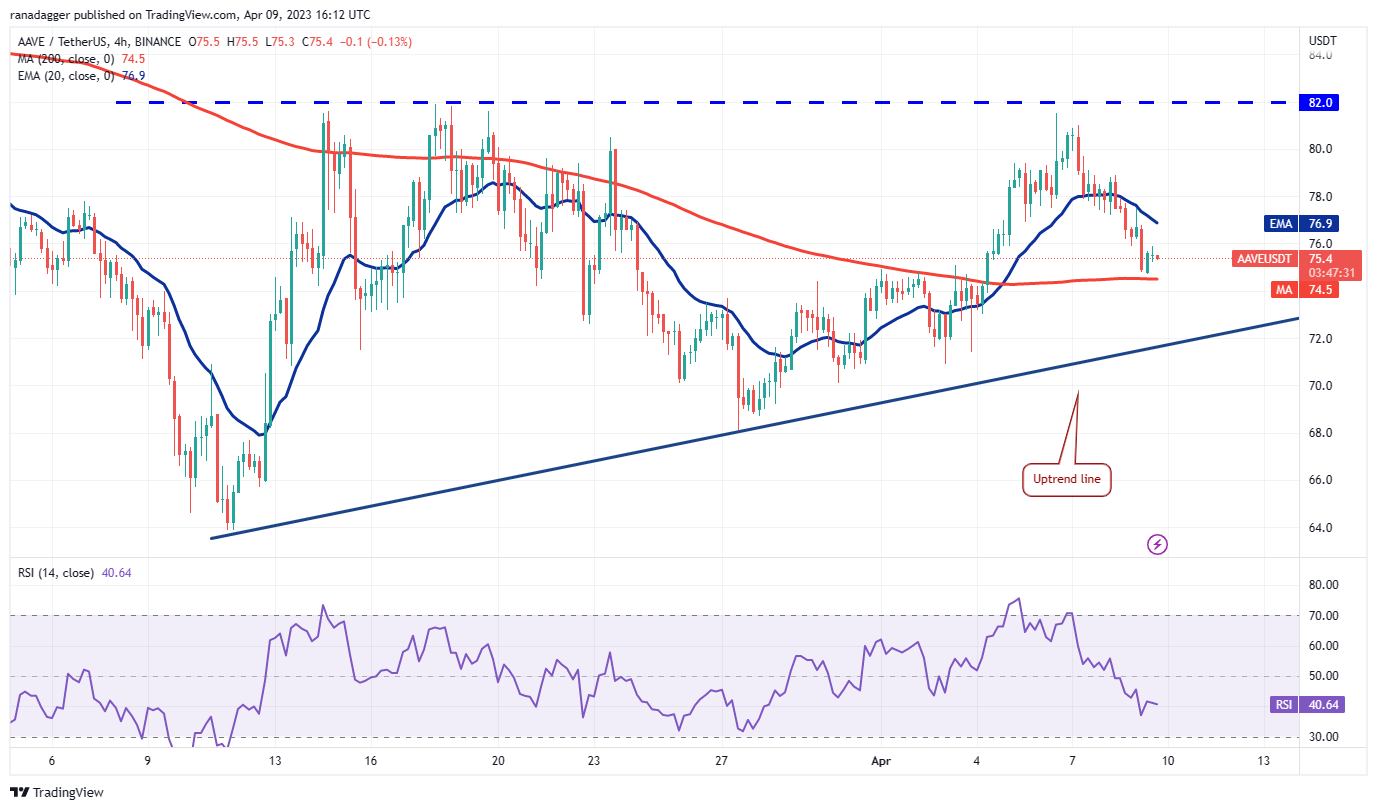 AAVE/USDT 4-hour chart. Source: TradingView
The bears have driven the price down to the 200-SMA on the four-hour chart. The 20-EMA has begun to decline, and the RSI is in negative territory, indicating that bears currently hold the advantage.
If the 200-SMA fails to hold, the pair could decline further toward the uptrend line. This is a critical level for the bulls to defend, as a breakdown below it would further empower the bears.
On the upside, a breakout above the 20-EMA would be the first indication that bulls are regaining strength. The pair may then rise to the overhead resistance at $82.
CFX price analysis
Conflux (CFX) has been undergoing a corrective phase for several days, but a slight positive is that the bulls are attempting to defend the 20-day EMA ($0.36).
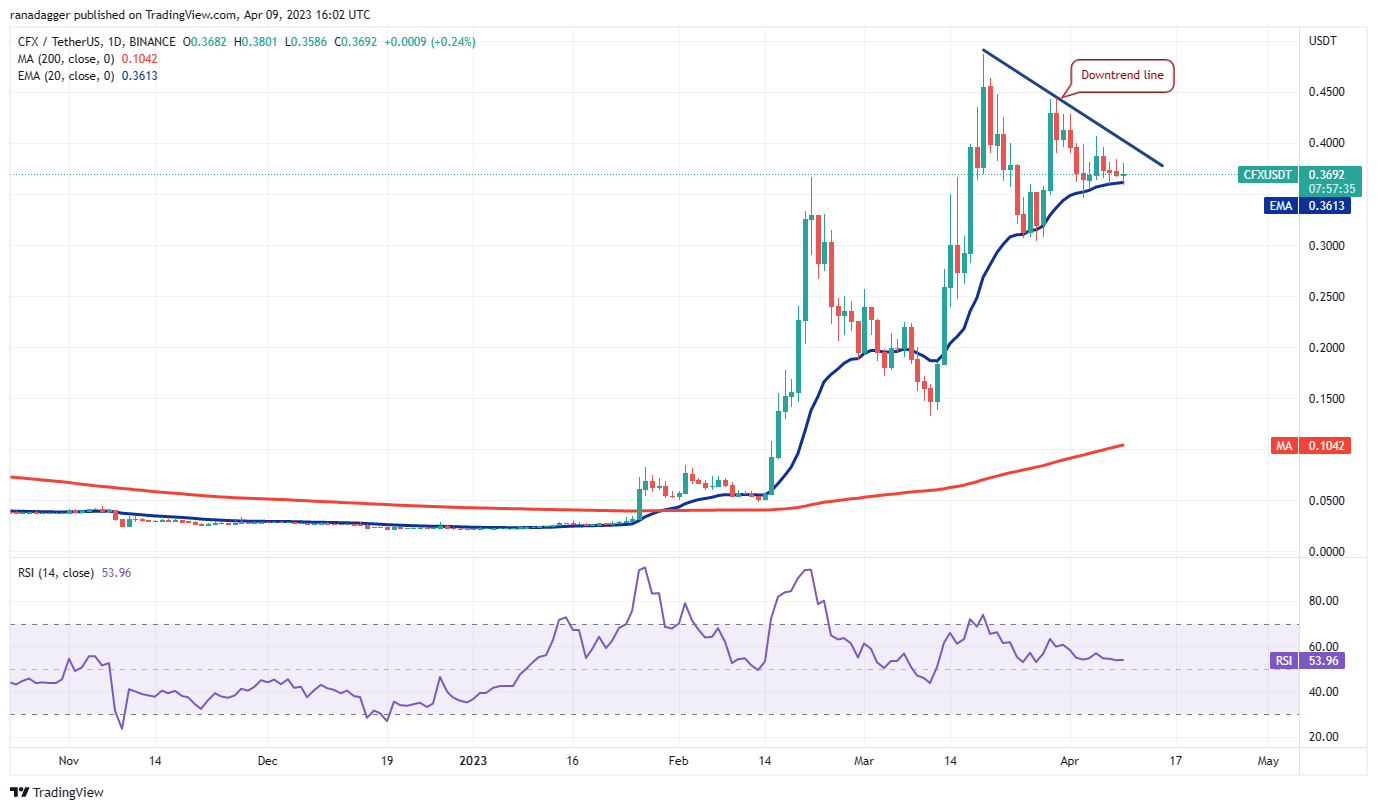 CFX/USDT daily chart. Source: TradingView
If the price rebounds from the current level, the CFX/USDT pair could reach the downtrend line. This is a significant level for the bears to protect, as a breakout above it could pave the way for a potential rally to $0.44 and then $0.49.
Conversely, if the price drops and remains below the 20-day EMA, it will indicate that bulls may be exiting the market. This could lead to increased selling pressure, driving the price toward the next support at $0.30. The bulls are expected to buy the dips at this level.
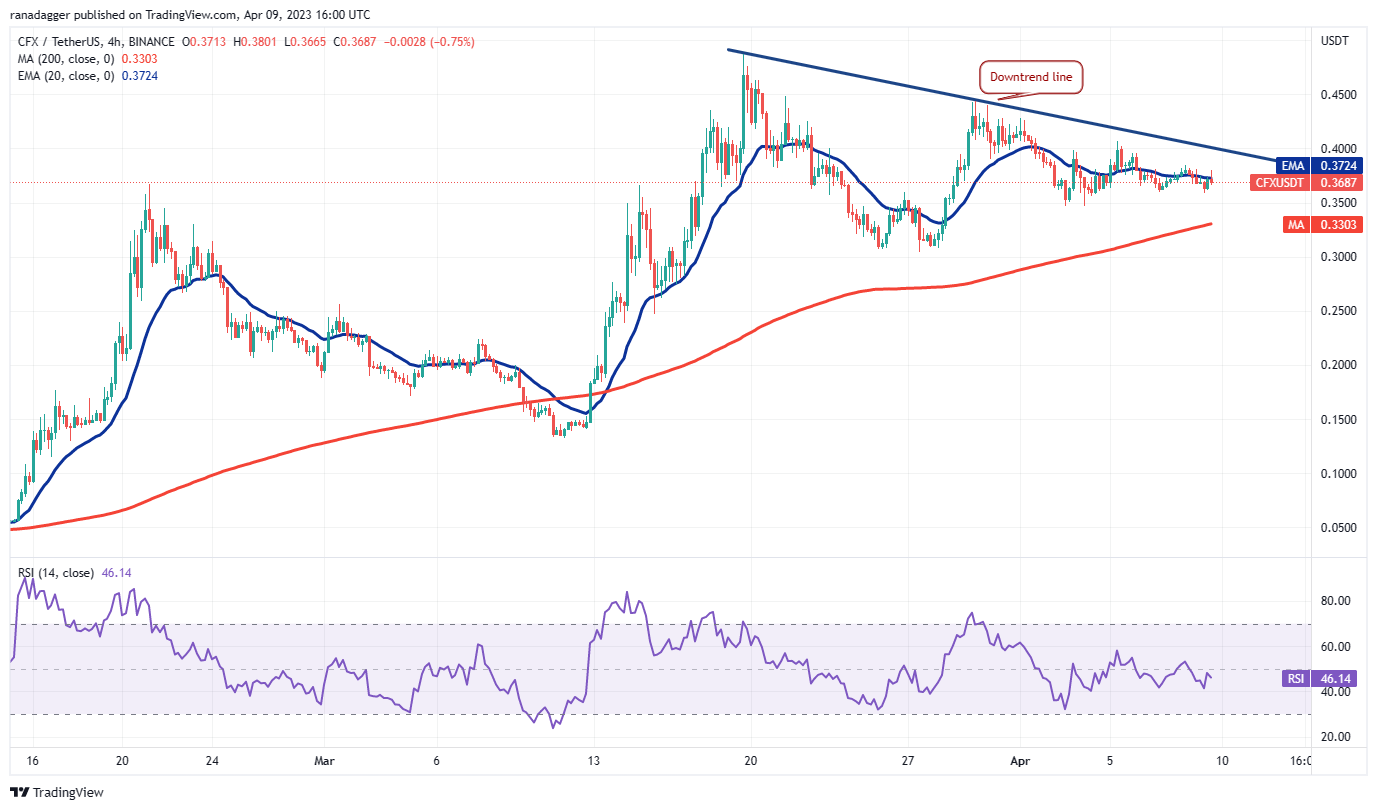 CFX/USDT 4-hour chart. Source: TradingView
The four-hour chart indicates that bears are attempting to keep the price below the 20-EMA. This could pull the pair down to the 200-SMA, which is likely to serve as a significant support level.
If the price bounces off this level, the bulls will again try to push the price toward the downtrend line. This is a crucial level to monitor, as a breakout above it will signal that bulls are re-entering the market.
On the downside, a break and close below the $0.30 support could lead to further selling, pushing the price down to $0.25.
The views, thoughts and opinions expressed here are the authors’ alone and do not necessarily reflect or represent the views and opinions of Cointelegraph.
This article does not contain investment advice or recommendations. Every investment and trading move involves risk, and readers should conduct their own research when making a decision.