Disclaimer: Information found on CryptoreNews is those of writers quoted. It does not represent the opinions of CryptoreNews on whether to sell, buy or hold any investments. You are advised to conduct your own research before making any investment decisions. Use provided information at your own risk.
CryptoreNews covers fintech, blockchain and Bitcoin bringing you the latest crypto news and analyses on the future of money.

- RNDR has undergone a notable price shift, with bulls reversing the previous bearish trend.
- Intraday resistance for Render is identified at $1.98, while support is positioned at $1.78.
- RNDR’s price rose by 6.89% over the last 24 hours, reaching $1.95.
The cryptocurrency Render Token (RNDR) has recently seen a considerable price shift in the market. At the beginning of the day, the Render Token market exhibited a bearish signal, suggesting a bear dominance. However, this changed during the late morning as bulls exerted pressure on the market, leading to a reversal in the RNDR price.
The bulls in the Render Token market have effectively established an intraday resistance level at $1.98, while the support level is set at $1.78. In the last 24 hours, the price of the Render token has increased by 6.89%. Currently, the RNDR token is trading at $1.95.
The trading volume for Render has surged significantly by 63.81%, reaching $97,806,558, indicating that the price is likely to continue its movement in the upcoming hours. Additionally, the market capitalization of RNDR has risen by 7.14%, reaching $709,844,845, reflecting the increasing strength and interest in the market.
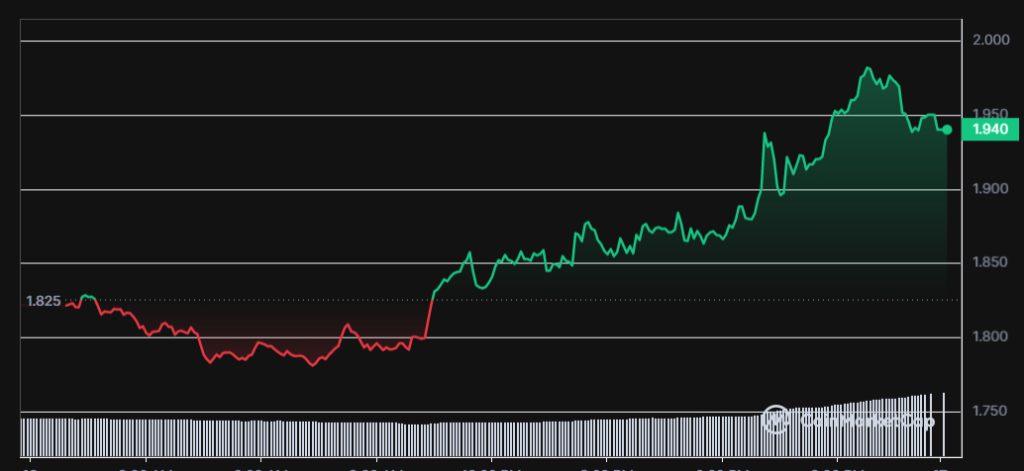 RNDR/USD 24-hour price chart (Source: CoinMarketCap)
4-Hour RNDR Technical Analysis
Related Posts
The MACD line is positioned above its signal line and is in positive territory, with a reading of 0.024, suggesting that the bullish trend in Render is likely to persist in the near term. Meanwhile, the histogram remains in positive territory, indicating that buyers are in control of the market, which enhances the potential for the bull rally.
With a Relative Strength Index of 63.81 and on the rise, RNDR’s positive momentum may be sustained or even strengthened soon. Should the RSI exceed 70, it could indicate that the market has become overbought, signaling a potential downturn or consolidation.
The bullish sentiment in the Render market is further supported by the Chaikin Money Flow (CMF), which is currently above the “0” level. This movement suggests that the bullish sentiment in the Render market may persist in the hours to come.
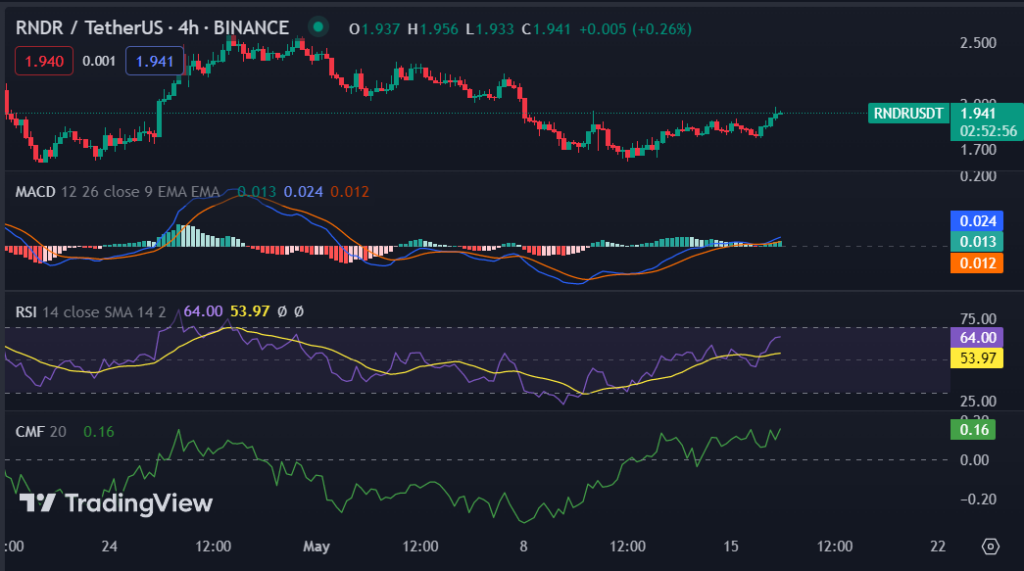 RNDR/USD 4-hour price chart (Source: TradingView)
With the prevailing bullish sentiment in the market and the support and resistance levels established by the bulls, RNDR’s price has been on an upward trajectory over the past 24 hours.
Recommended For You:
Render Token (RNDR) Price Prediction 2023