Disclaimer: Information found on CryptoreNews is those of writers quoted. It does not represent the opinions of CryptoreNews on whether to sell, buy or hold any investments. You are advised to conduct your own research before making any investment decisions. Use provided information at your own risk.
CryptoreNews covers fintech, blockchain and Bitcoin bringing you the latest crypto news and analyses on the future of money.
The 25 basis point increase in interest rates by the Federal Reserve on July 26, along with the following remarks from Fed Chair Jerome Powell, did not succeed in pushing Bitcoin (BTC) beyond its current range. This indicates that the event lacked any unexpected elements and that the results had already been factored into market prices.
The cryptocurrency markets maintained their subdued performance on July 28 after the United States Personal Consumption Expenditures (PCE) Index figures came in below analysts’ forecasts. The PCE is the Fed’s favored inflation gauge, making it a closely monitored metric by market participants.
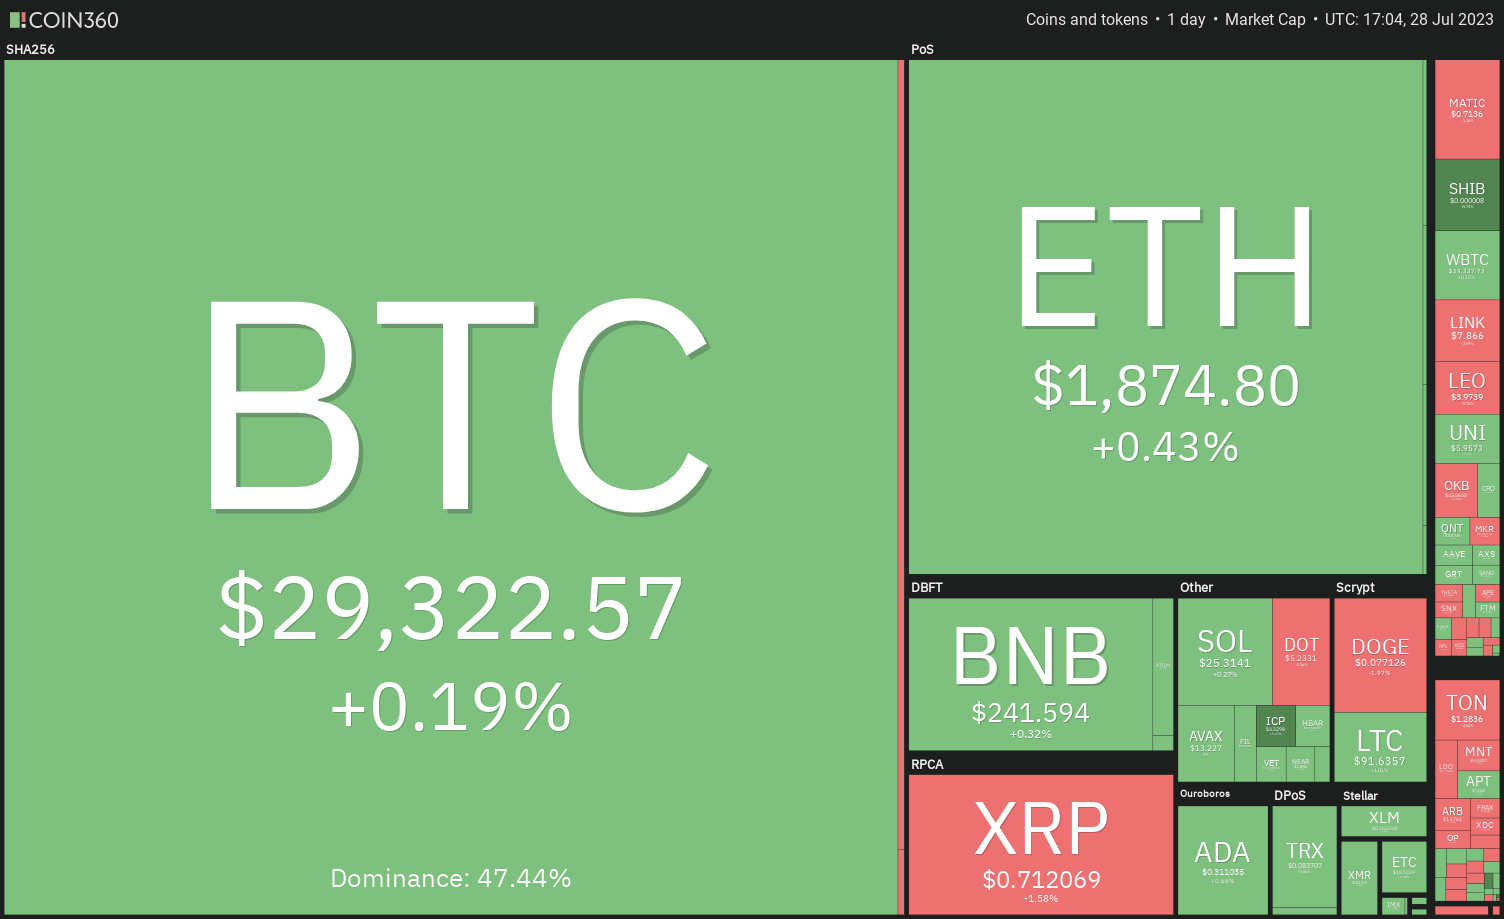 Daily cryptocurrency market performance. Source: Coin360
While the short-term price fluctuations have left traders uncertain, it is crucial to pay attention to the long-term narrative of cryptocurrencies. Geoff Kendrick, head of crypto research at Standard Chartered, shared with CNBC his prediction that Bitcoin could finish 2024 within the $100,000 to $120,000 range. He anticipates that Bitcoin will likely exhibit price trends similar to those observed in past halving cycles.
As Bitcoin continues to consolidate, might certain altcoins awaken from their dormancy?
Let’s analyze the charts of the top-10 cryptocurrencies to discover the insights.
Bitcoin price analysis
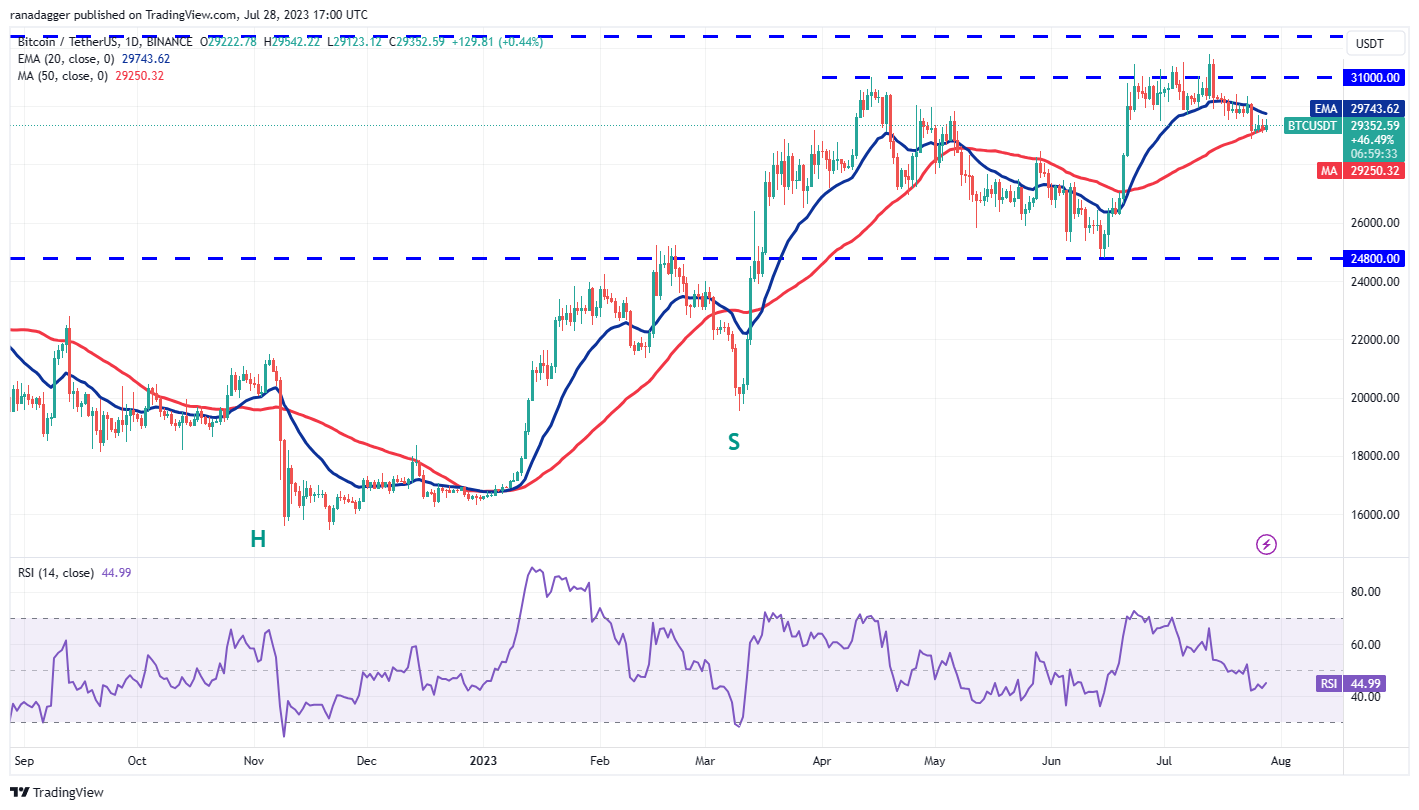
Bitcoin’s rebound from the 50-day simple moving average ($29,250) is losing momentum near the 20-day exponential moving average ($29,743), suggesting that sellers are emerging at higher price levels.
 BTC/USDT daily chart. Source: TradingView
The 20-day EMA has begun to decline, and the relative strength index (RSI) is positioned in the negative zone, indicating that bears have a slight advantage.
If the bears manage to drive the price below the immediate support level at $28,861, the BTC/USDT pair may initiate a downward trajectory towards $27,500 and subsequently to $26,000. Such a development would imply that the pair could prolong its confinement within the $24,800-to-$31,000 range for an extended period.
The key level to monitor on the upside is the 20-day EMA. If this resistance is surpassed, the pair may advance towards $31,000. The bears are expected to face a significant challenge in the $31,000-to-$32,400 area.
Ether price analysis
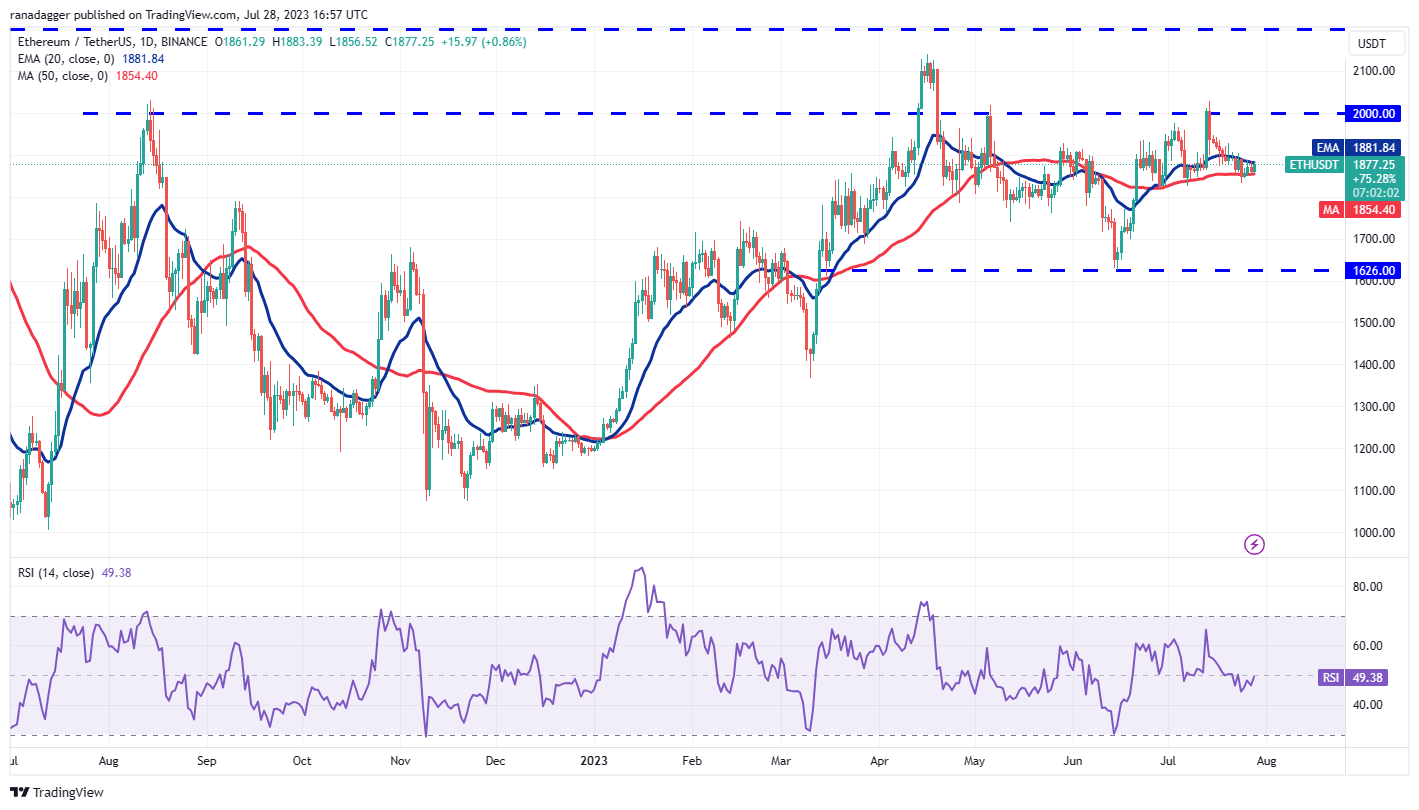
Ether (ETH) has been caught between the moving averages over the past few days. This indicates that bulls are stepping in to buy the dips at the 50-day SMA ($1,854), but they have not succeeded in pushing the price above the 20-day EMA ($1,881).
 ETH/USDT daily chart. Source: TradingView
This tight trading range is unlikely to persist for much longer and may soon resolve with a decisive breakout. If the bulls drive the price above the 20-day EMA, the ETH/USDT pair could rise to $1,930 and eventually reach $2,000.
On the flip side, if the price declines and falls below the 50-day SMA, it will indicate that the bears are gaining control. The pair may then fluctuate within the broad range of $1,626 to $2,000 for a while longer.
XRP price analysis
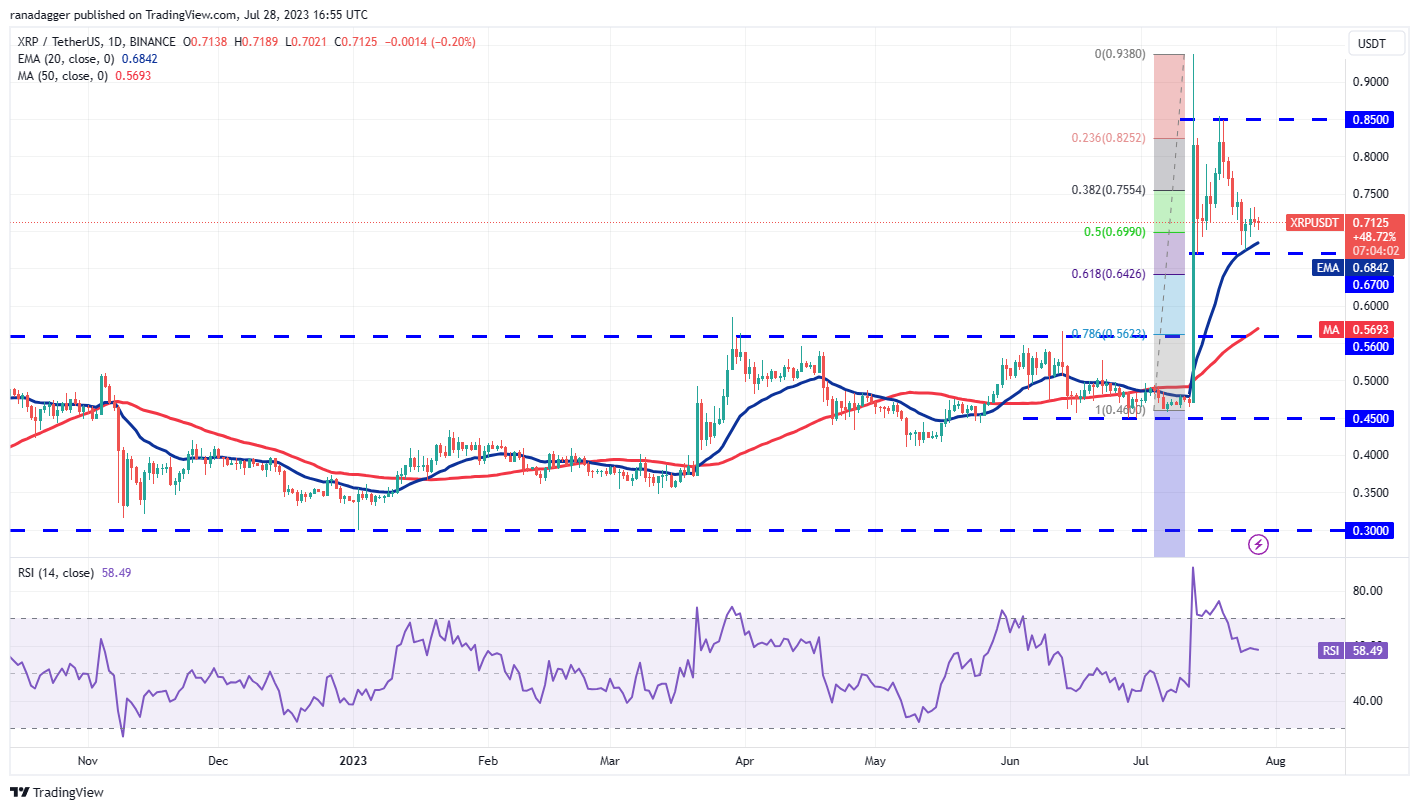
Following the significant increase on July 13, XRP (XRP) may now enter a consolidation phase. The limits of this range could be set at $0.67 and $0.85.
 XRP/USDT daily chart. Source: TradingView
The 20-day EMA ($0.68) is gradually trending upward, and the RSI is in the positive territory, suggesting that bulls have a slight upper hand. The XRP/USDT pair could ascend to $0.75, and if this level is breached, the rally could extend to $0.85.
Conversely, if the price declines and drops below $0.67, it will imply that bears have taken control. The pair could then plunge to the breakout level of $0.56, where buying interest is likely to emerge.
BNB price analysis
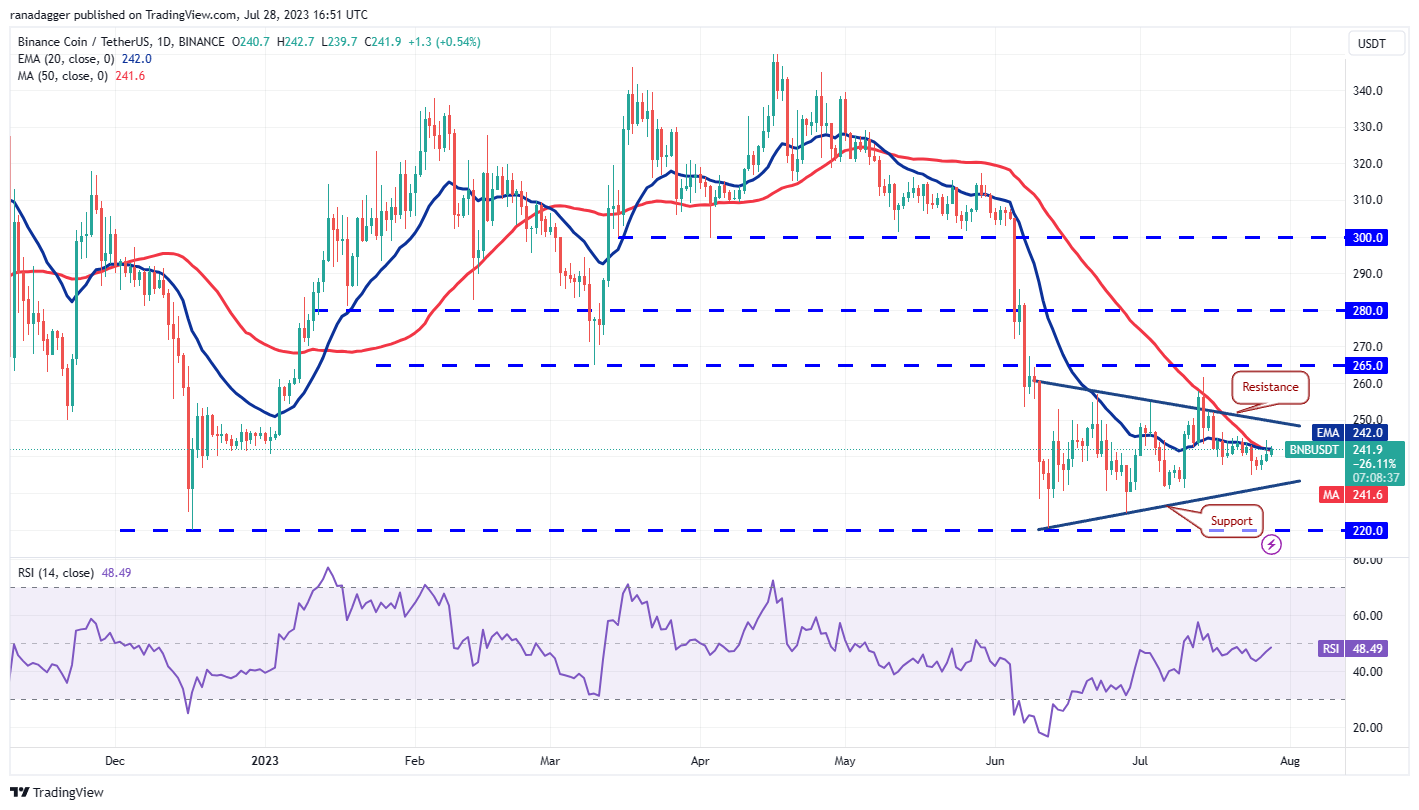
BNB’s (BNB) price movements have been erratic and volatile within the triangle, as both bulls and bears vie for dominance.
 BNB/USDT daily chart. Source: TradingView
If buyers succeed in pushing the price above the moving averages, the BNB/USDT pair could rise to the triangle’s resistance line. This level is critical for the bears to defend, as a breakout above it could send the price soaring to $265 and then to the target of $290.
Alternatively, if the price retraces from the current level, it will indicate that bears are maintaining their selling pressure. The pair could then fall to the support line. This level may attract buyers, but if they fail to generate a significant rebound, the pair may decline further and test the crucial support at $220.
Cardano price analysis
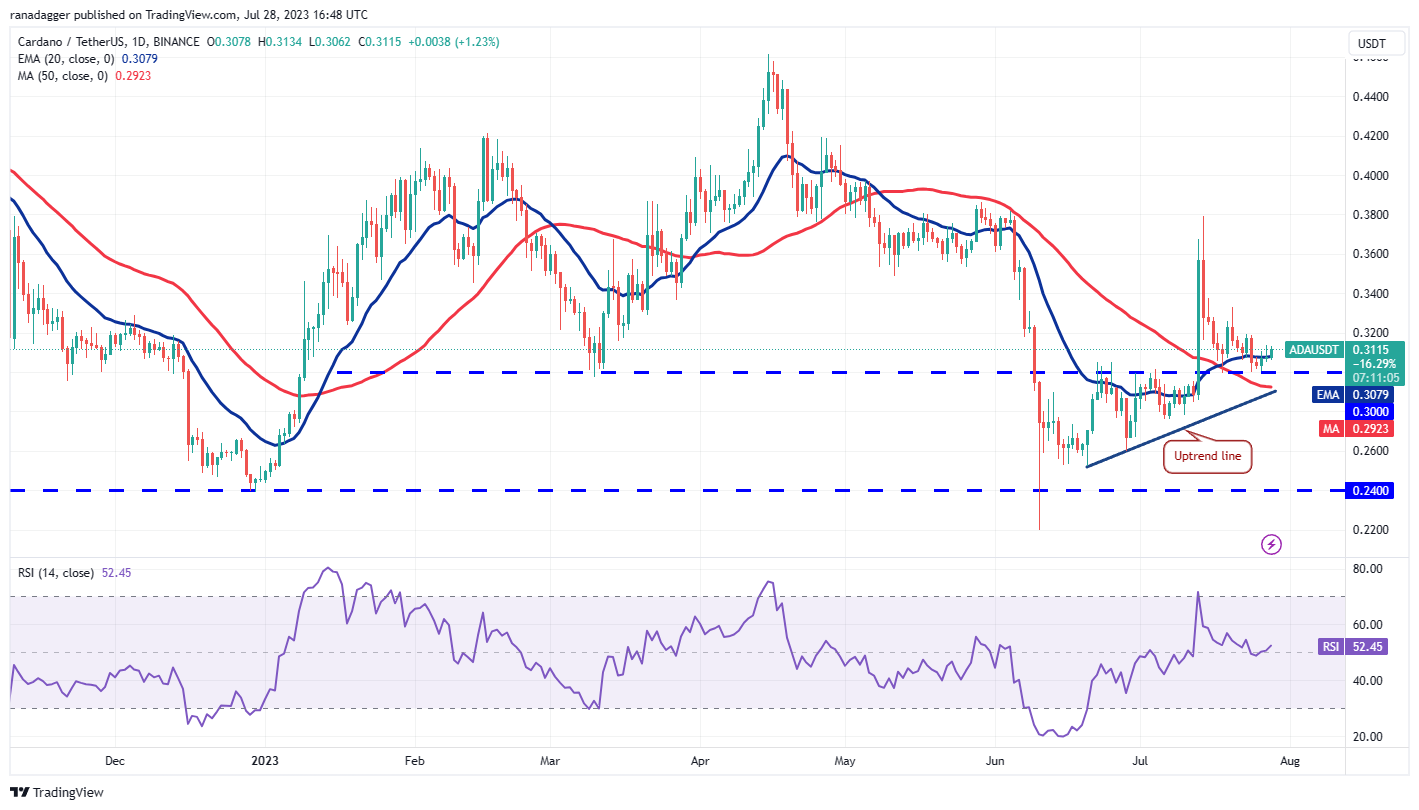
Cardano (ADA) bounced off the breakout level of $0.30 on July 26, implying that bulls are actively defending the support.
Related Posts
 ADA/USDT daily chart. Source: TradingView
The flat 20-day EMA ($0.30) and the RSI near the midpoint do not provide a clear advantage to either bulls or bears. If bulls manage to keep the price above the 20-day EMA, the ADA/USDT pair could advance towards the overhead resistance at $0.34. This level may serve as a formidable barrier, but if breached, the ADA/USDT pair could reach $0.38.
If bears aim to thwart the upward movement, they will need to quickly pull the price below the uptrend line. If they succeed, the pair may fall to $0.27 and then to $0.26.
Solana price analysis
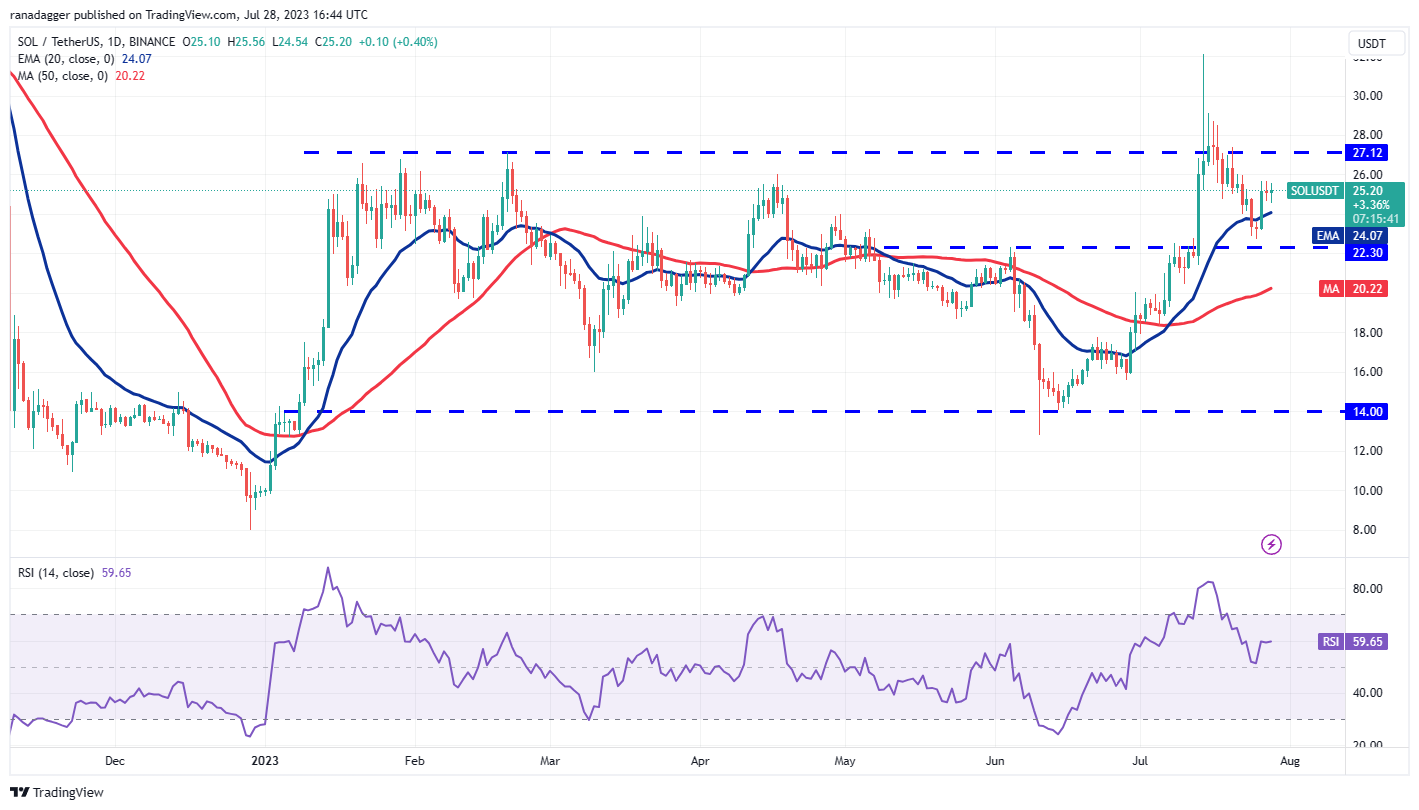
Solana (SOL) rebounded from the support level at $22.30 on July 25 and climbed above the 20-day EMA ($24.07) on July 26, signifying that the range-bound action is still in play.
 SOL/USDT daily chart. Source: TradingView
The rising 20-day EMA and the RSI in the positive zone indicate that buyers have the advantage. If the price bounces from the current level, the bulls will strive to push the SOL/USDT pair to the overhead resistance at $27.12. A close above this level could signal the onset of a new uptrend.
Conversely, a decline below the 20-day EMA could pull the price back to the significant support at $22.30. This is a crucial level to monitor, as a break below it could lead the pair to drop to the 50-day SMA ($20.22).
Dogecoin price analysis
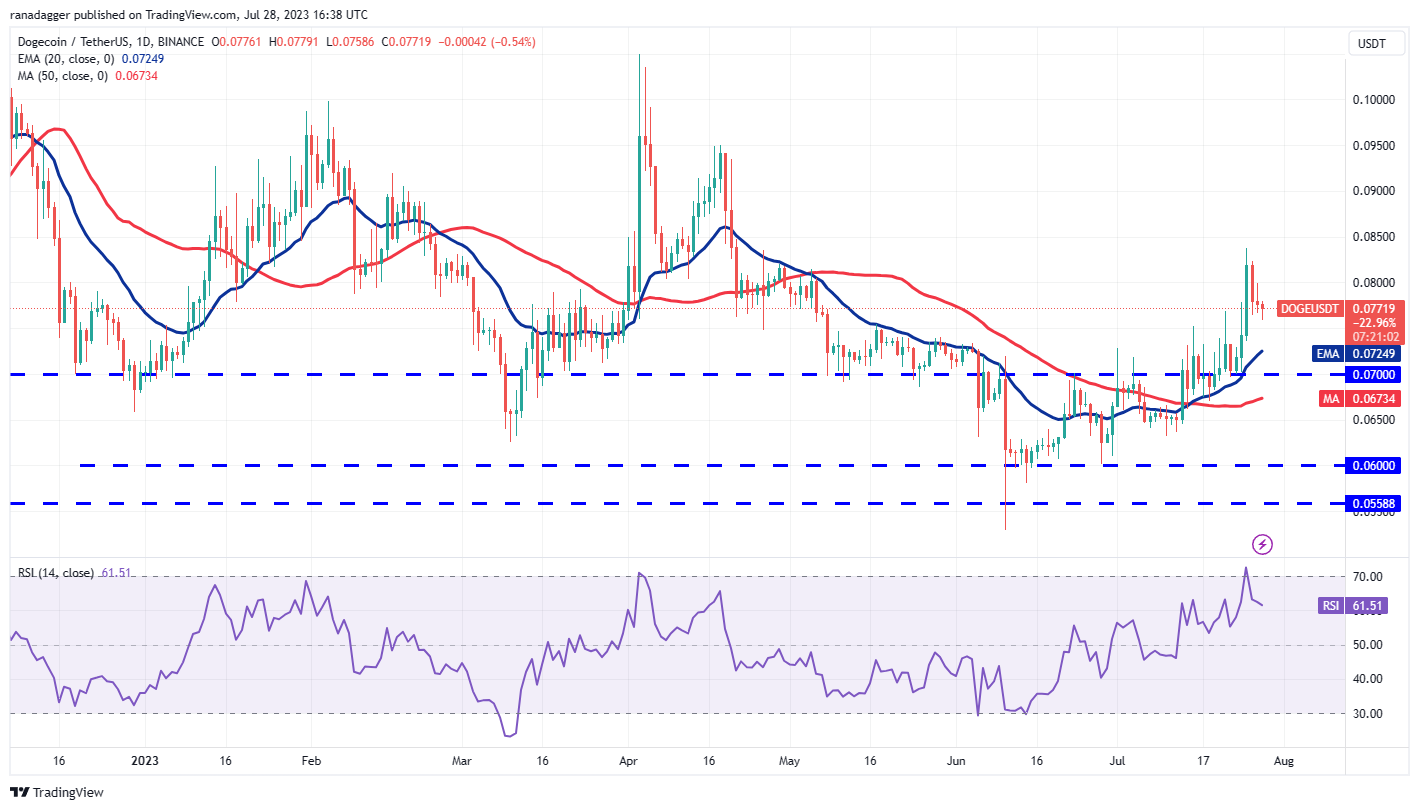
Dogecoin (DOGE) surged past the overhead resistance of $0.80 on July 25, but the bulls were unable to maintain the momentum. This indicates selling pressure at higher levels.
 DOGE/USDT daily chart. Source: TradingView
The bears drove the price back below the breakout level of $0.08 on July 26. The DOGE/USDT pair may slide to the 20-day EMA ($0.07), which is a crucial level to observe in the near term.
If the price rebounds from the 20-day EMA, it will indicate a positive sentiment shift, suggesting that traders are buying on dips. This would heighten the likelihood of a breakout above $0.08. If that occurs, the pair could surge towards $0.10. This optimistic outlook would be invalidated if the price continues to decline and falls below $0.07.
Related: French privacy watchdog questions Worldcoin’s data collection method: Report
Polygon price analysis
Polygon (MATIC) has been fluctuating between the moving averages for the past three days, indicating a state of indecision among bulls and bears.
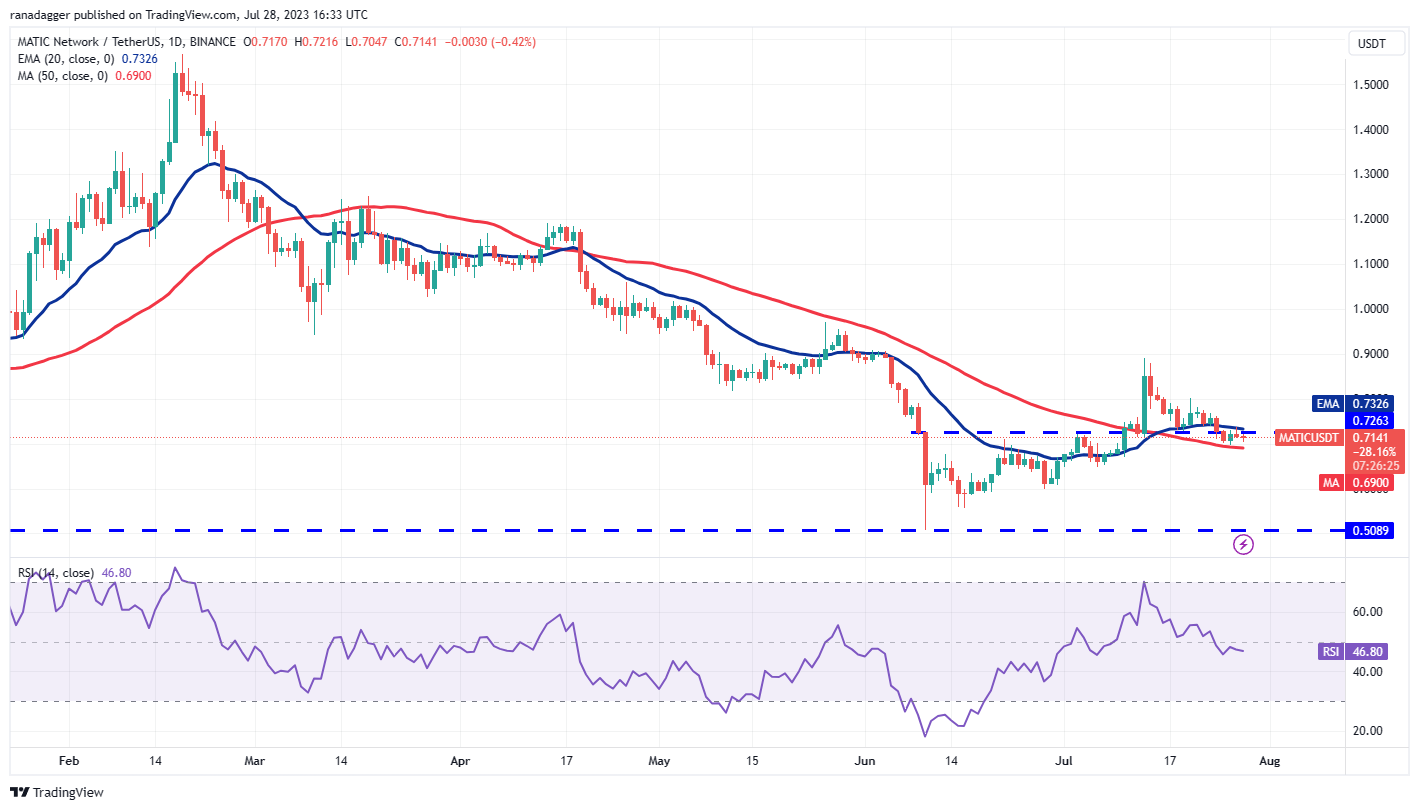 MATIC/USDT daily chart. Source: TradingView
If the price breaks below the 50-day SMA ($0.69), it will suggest that bears are regaining control. The MATIC/USDT pair could then decline to $0.65 and subsequently to the robust support at $0.60.
On the other hand, if the price increases and surpasses the 20-day EMA, it will indicate that bulls have overpowered bears. This could trigger a recovery towards $0.80 and eventually to $0.90.
Litecoin price analysis
Litecoin (LTC) is making an effort to recover, but the bulls are encountering significant resistance at the 20-day EMA ($92). This suggests that bears are active at elevated levels.
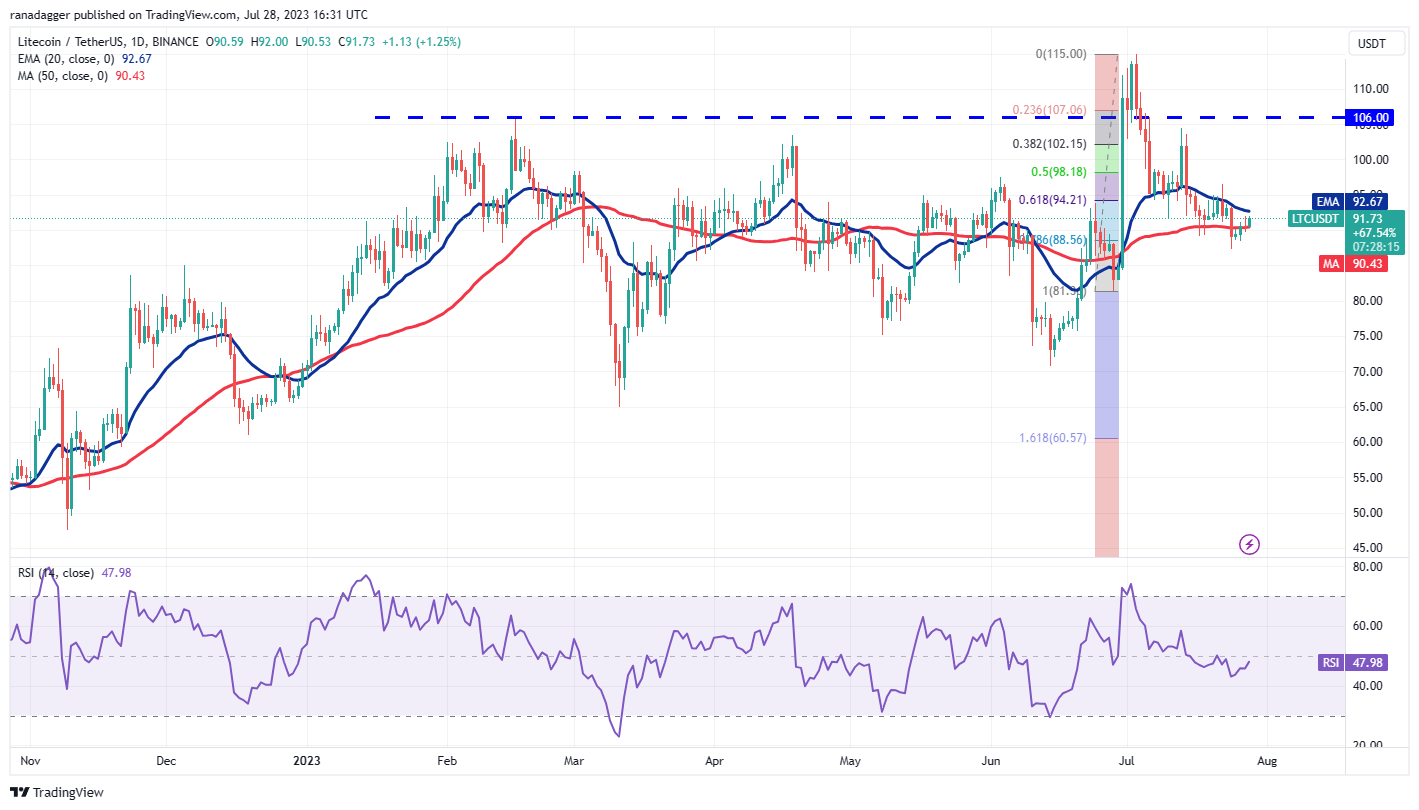 LTC/USDT daily chart. Source: TradingView
If the price retracts from the 20-day EMA and falls below $87, it will indicate a resumption of the downward trend. The LTC/USDT pair could then decrease to $81, where bulls may attempt to halt the decline.
Alternatively, if bulls push the price above the 20-day EMA, it will imply that selling pressure might be easing. There is minor resistance at $96, but if bulls overcome this level, the pair may climb towards $106.
Polkadot price analysis
The bulls have repeatedly failed to push Polkadot (DOT) above the 20-day EMA ($5.24) over the last three days, indicating that bears are selling during minor rallies.
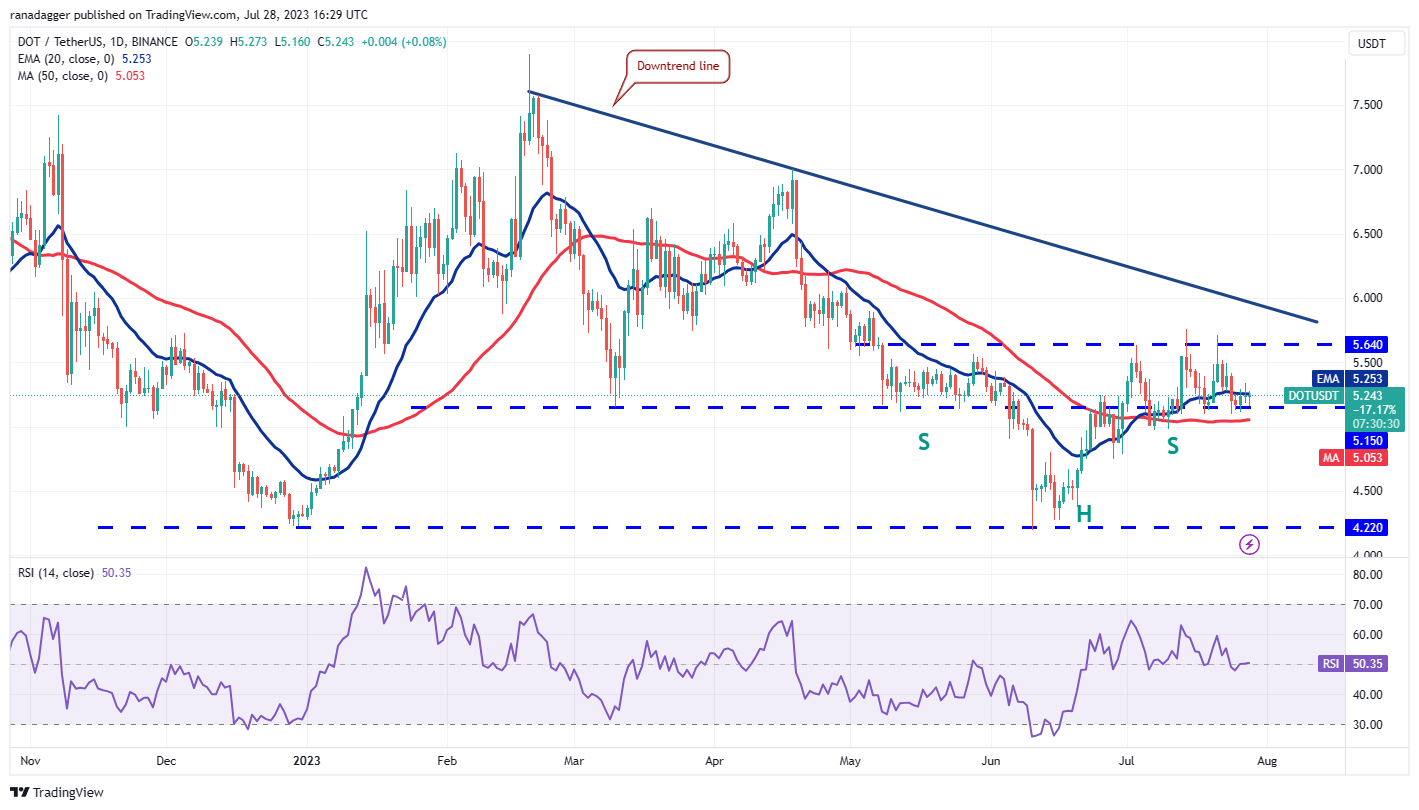 DOT/USDT daily chart. Source: TradingView
The bears will attempt to solidify their position further by driving the price below the 50-day SMA ($5.05). If they succeed, the DOT/USDT pair could plunge to the next support level at $4.74 and then to $4.65.
In contrast, if the price rises and breaks above the 20-day EMA, it will indicate robust buying interest at lower levels. This could keep the pair trading between the 50-day SMA and $5.64 for several more days.
This article does not include investment advice or recommendations. Every investment and trading move involves risk, and readers should conduct their own research when making decisions.