Disclaimer: Information found on CryptoreNews is those of writers quoted. It does not represent the opinions of CryptoreNews on whether to sell, buy or hold any investments. You are advised to conduct your own research before making any investment decisions. Use provided information at your own risk.
CryptoreNews covers fintech, blockchain and Bitcoin bringing you the latest crypto news and analyses on the future of money.
Arbitrum (ARB) has emerged as one of the top-performing cryptocurrencies following Ethereum’s long-awaited Shanghai upgrade.
Significantly, the ARB price increased by 4.28% to $1.36 on April 13, reaching its highest point in two weeks. This also represents an 18% rise from its low of $1.15 just a day prior, when the Shanghai upgrade allowed for staking withdrawals on Ethereum.
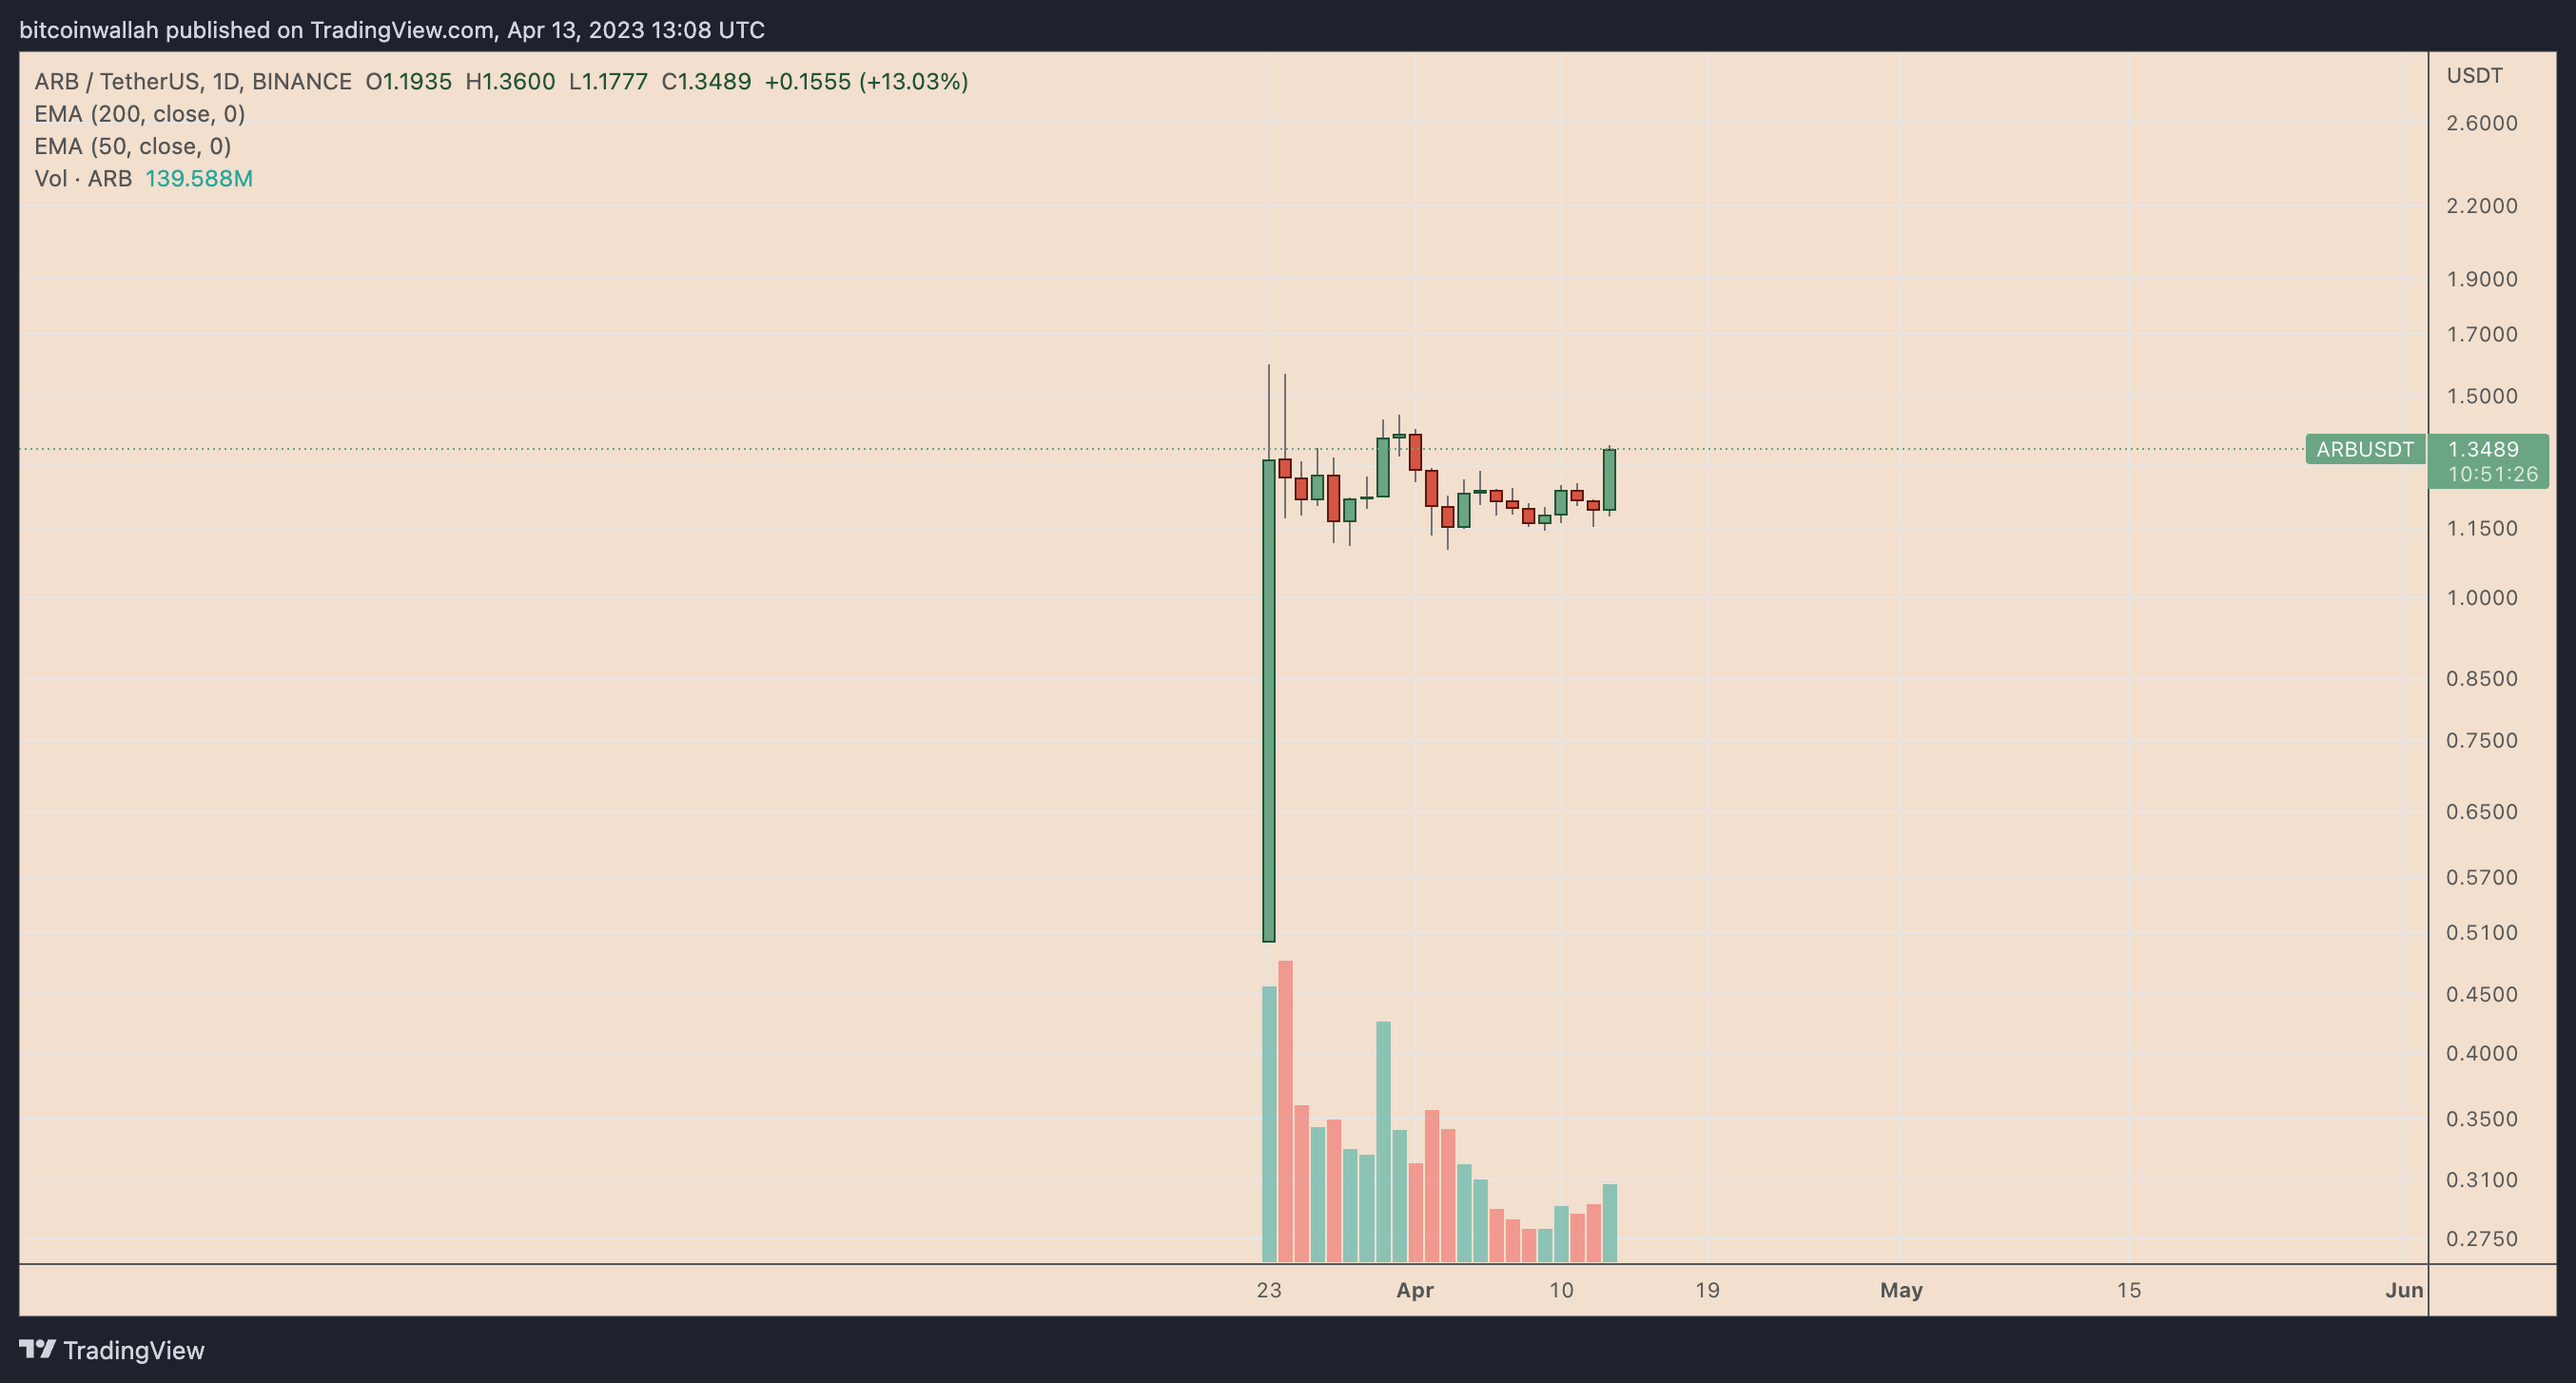 ARB/USDT daily price chart. Source: TradingView
To summarize, Arbitrum serves as an Ethereum layer-2 (L2) scaling solution designed to alleviate network transaction congestion and reduce transaction fees. Consequently, the market often views Ethereum’s expansion as advantageous for L2 chains.
Here are three factors that could contribute to ARB’s continued bullish momentum in Q2, potentially allowing it to revisit its record high of $1.60.
Increased utility for ARB
According to Messari, Arbitrum generated $2.5 million in profits through sequencing in March 2023.
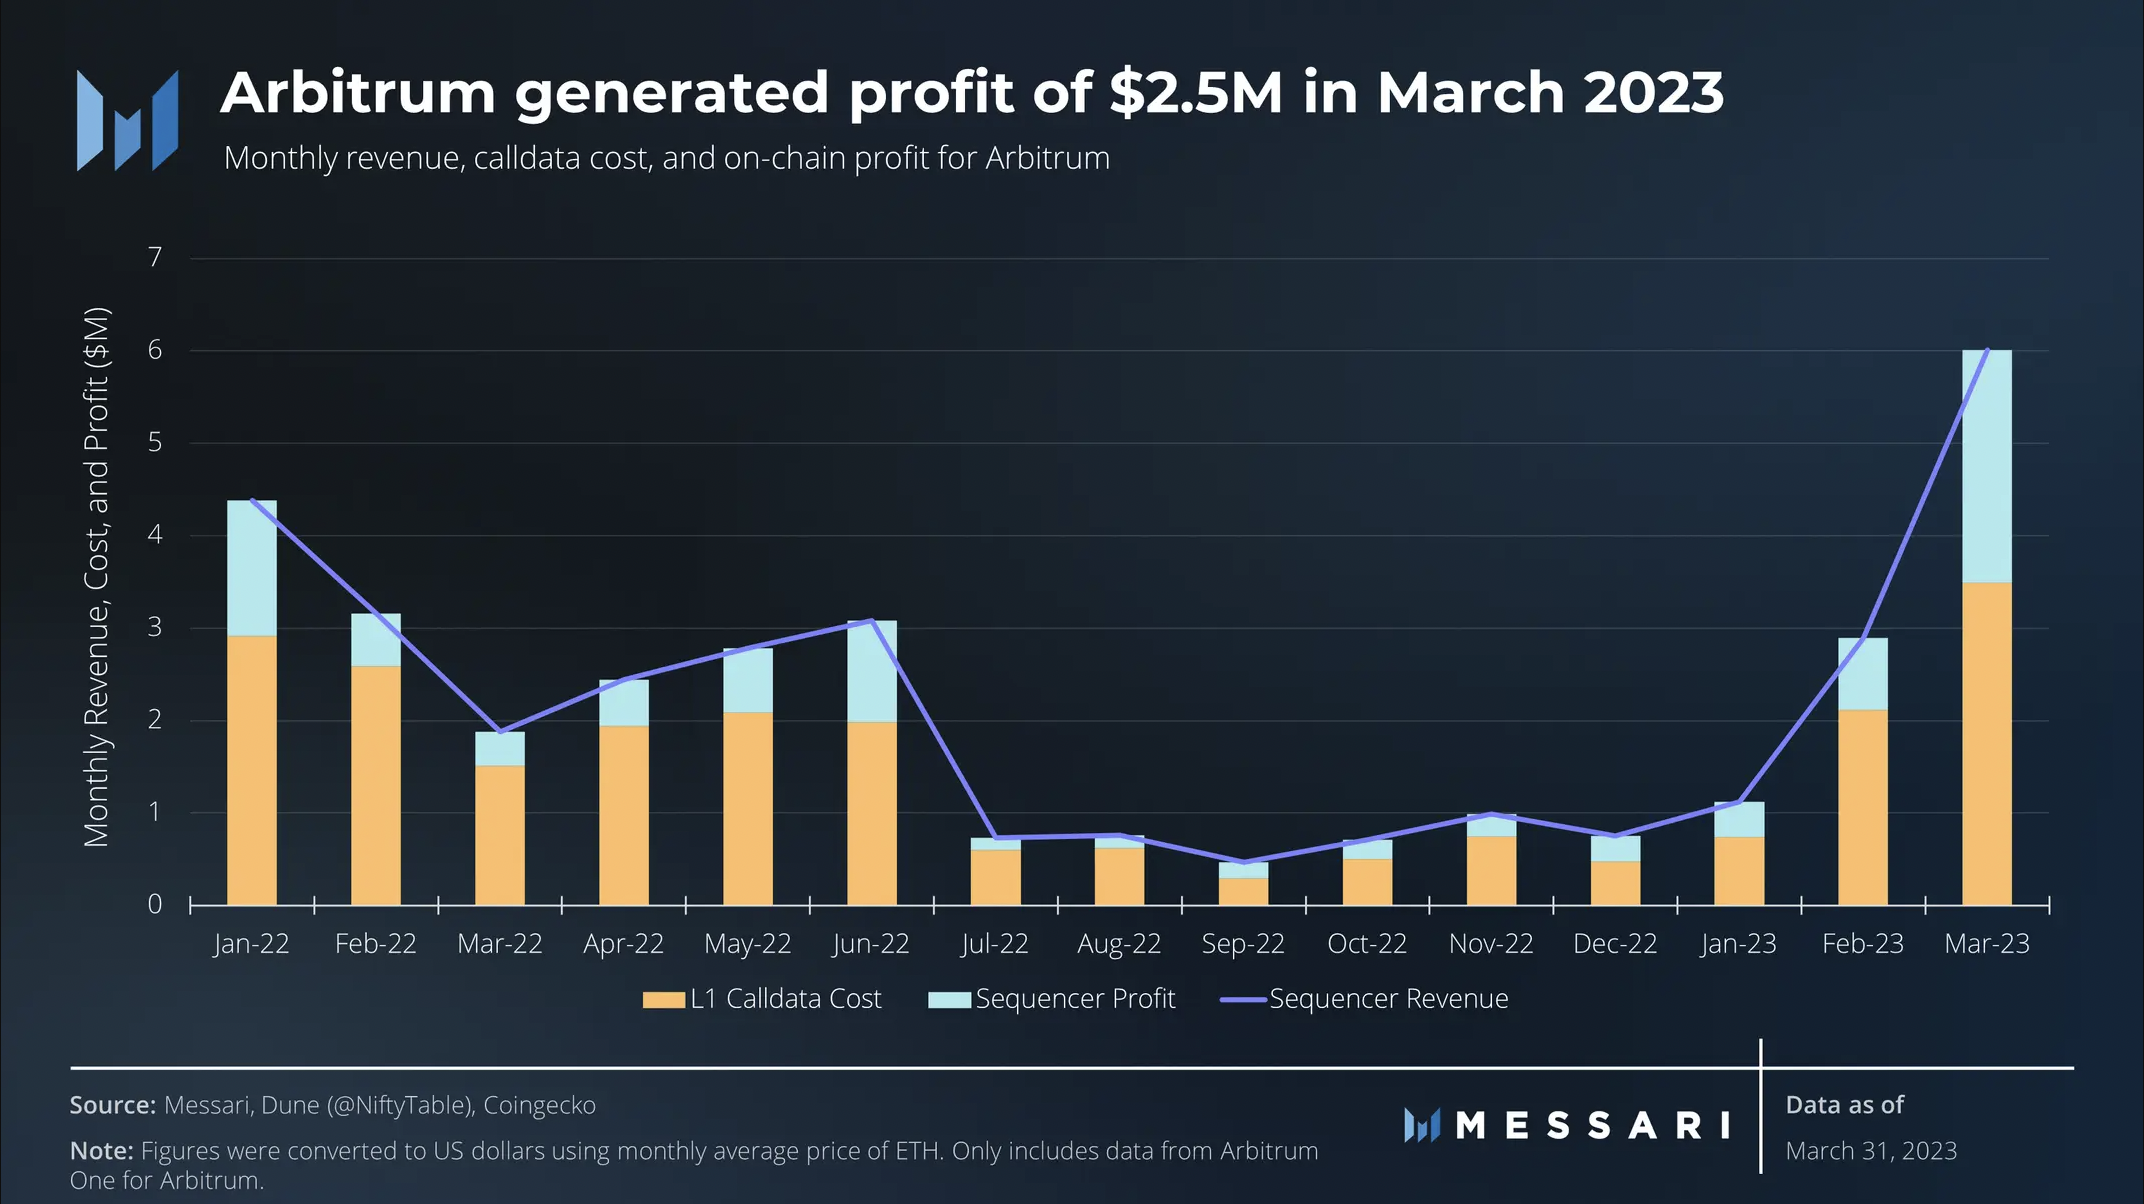 Arbitrum financial performance in 2023. Source: Messari
It is important to note that sequencer profits reflect the difference in fee revenue generated by the L2 chain versus the fee expenses paid to the base L1 chain—all calculated in Ethereum’s Ether (ETH) token, rather than ARB.
These profits will ultimately benefit Arbitrum’s community-managed DAO, known as ArbitrumDAO, as it evolves towards greater decentralization in the future.
Sequencers have the capability to create maximal extractable value (MEV) by organizing users’ transaction requests—a feature that is currently absent from Arbitrum.
However, Kunal Goel, a researcher at Messari, posits that ArbitrumDAO may monetize MEV by auctioning off the rights to produce blocks once decentralized sequencing is implemented. This could create new opportunities for ARB as a staking token.
"The DAO will likely mandate ARB staking for sequencers to align incentives economically and to facilitate slashing in cases of misbehavior, akin to validators in Proof-of-Stake networks," Goel remarked, adding:
"This will enhance the token’s value as users seek greater security from the protocol."
Capturing Optimism’s market share
Arbitrum has consistently outperformed its primary Ethereum L2 competitor, Optimism (OP), across nearly all key metrics throughout much of 2022 and 2023.
Related Posts
For example, in 2022, Arbitrum generated $22 million in sequencer revenue and $6 million in profits, while Optimism earned $18 million and $4 million in sequencer revenue and profits, respectively.
Likewise, in the first quarter of 2023, Arbitrum surpassed Optimism’s revenue by $4 million and profits by $3 million.
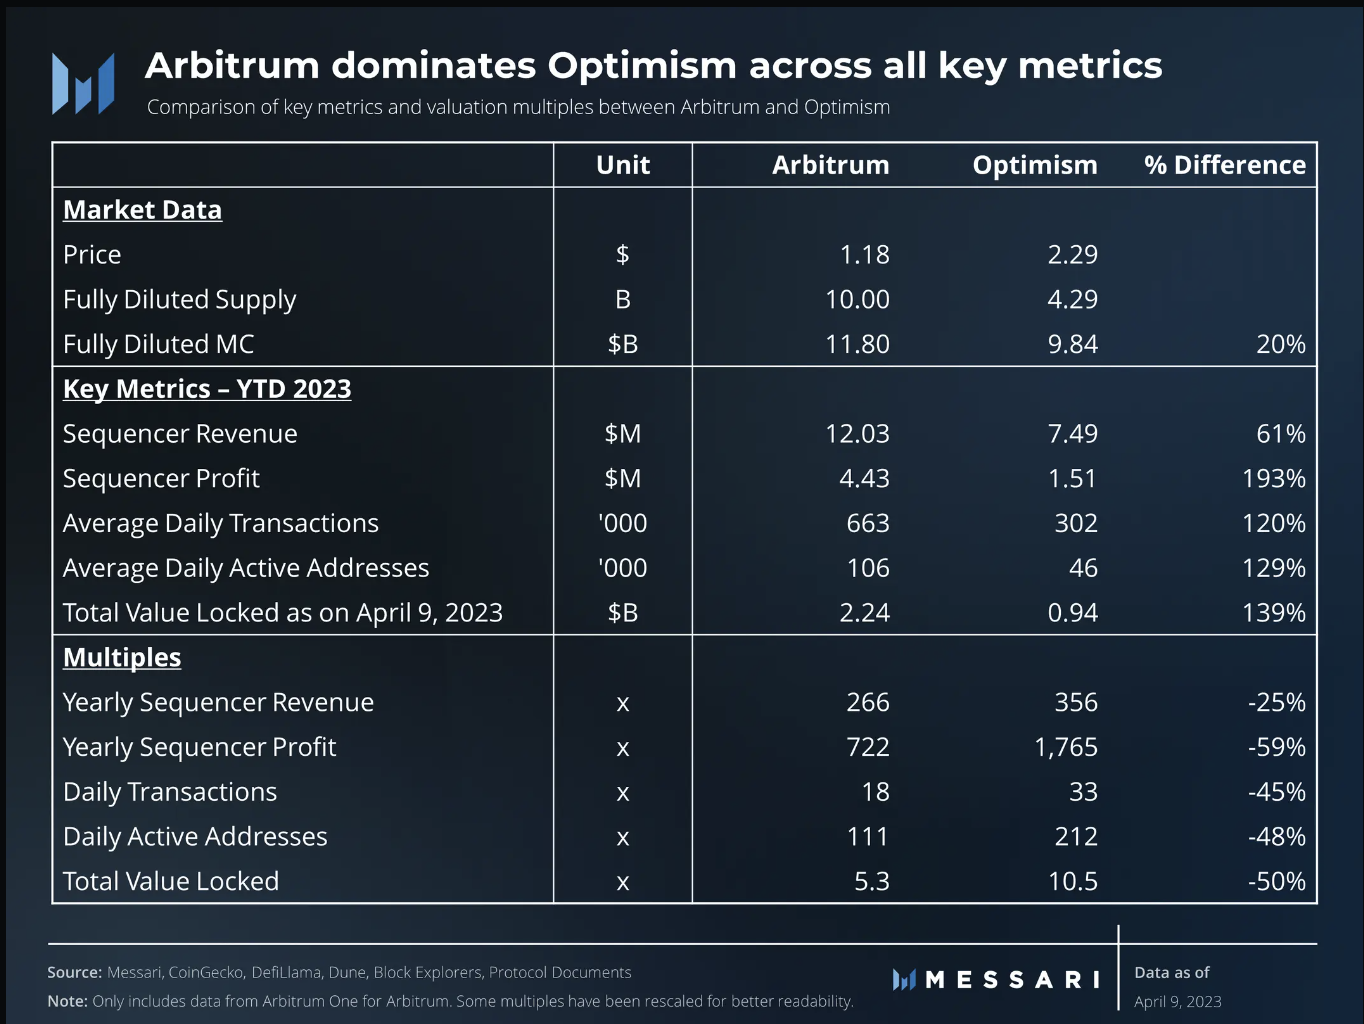 Arbitrum vs. Optimism key metrics. Source: Messari
Throughout most of 2022 and 2023, Arbitrum also maintained a higher total value locked (TVL), with its dominance increasing further following the ARB airdrop in March.
As of April 13, Arbitrum’s TVL stood at $2.27 billion, in contrast to Optimism’s $930 million.
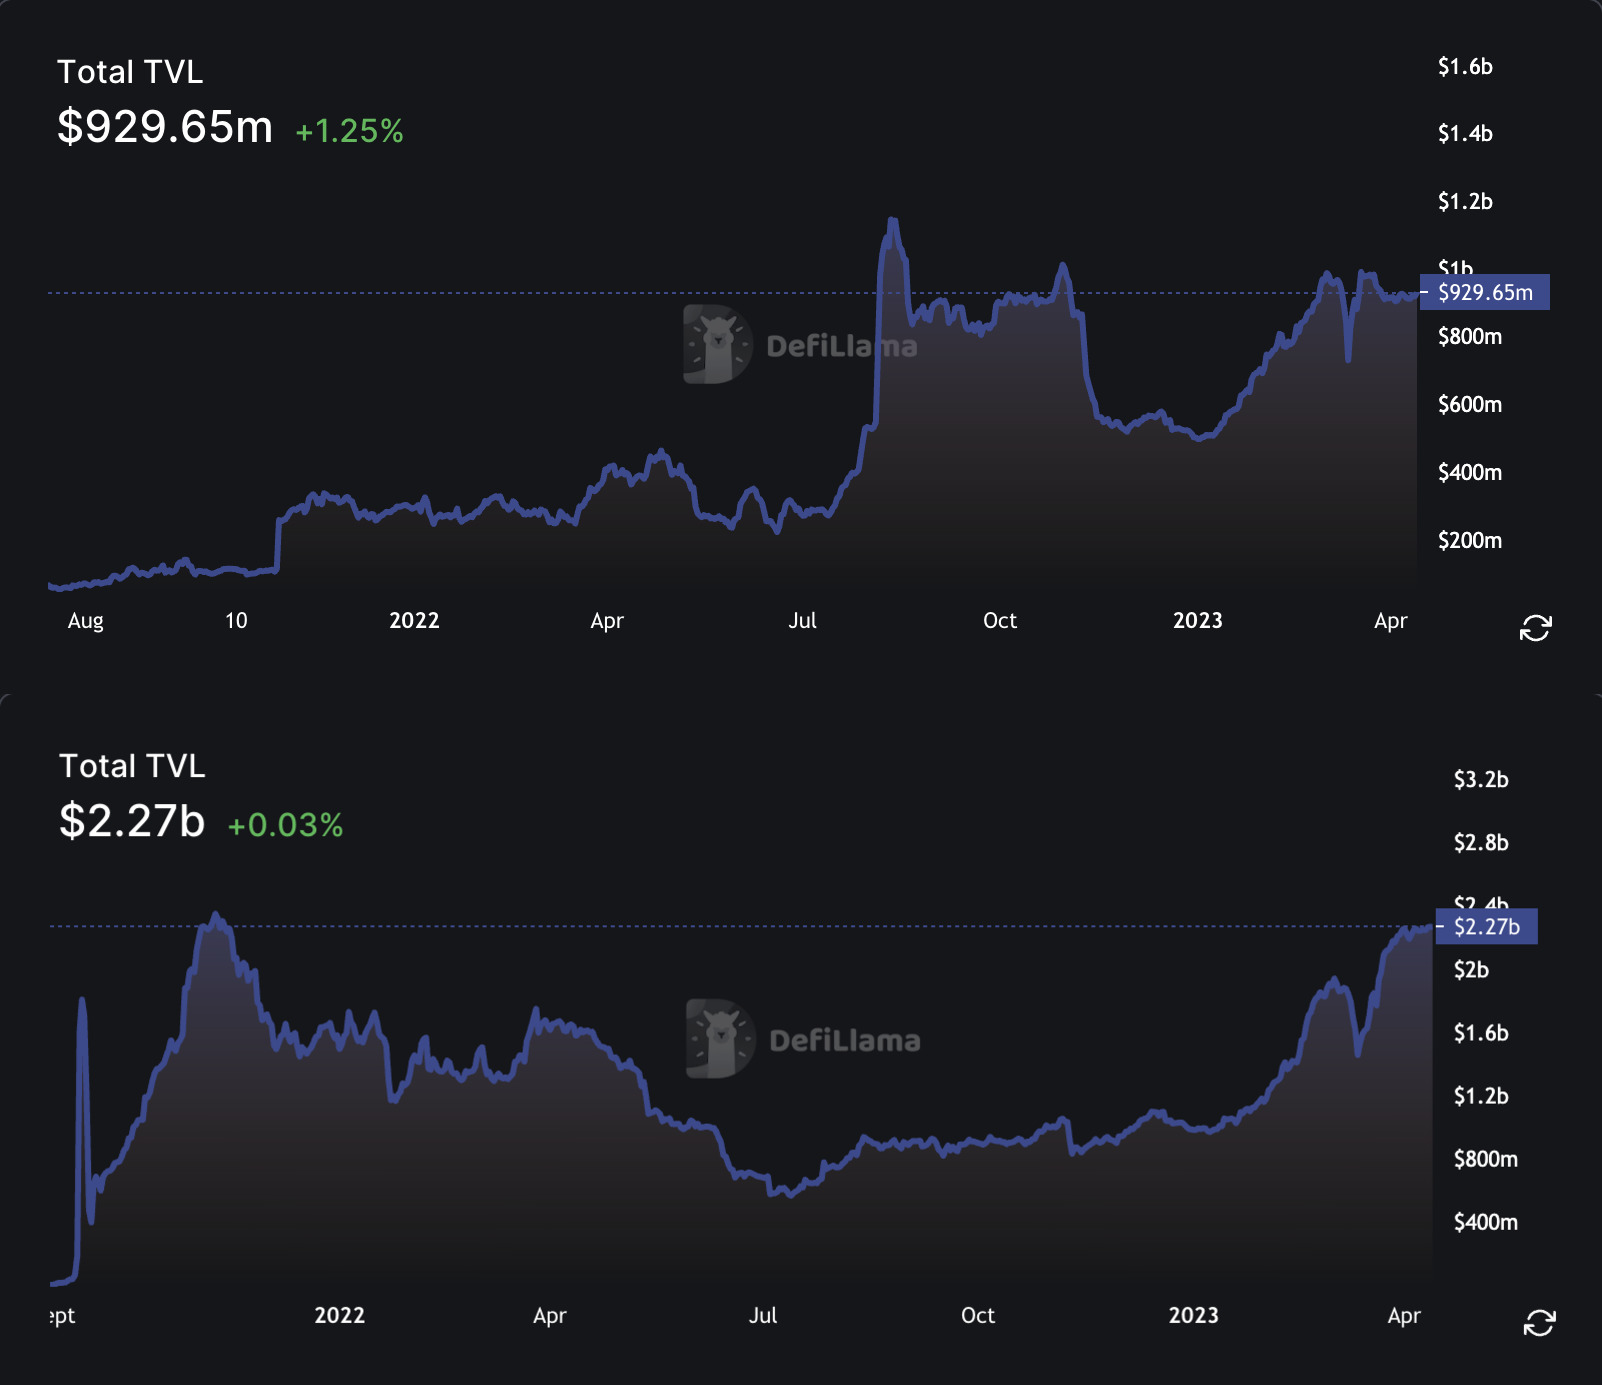 Optimism versus Arbitrum TVL. Source: Defi Llama
"At current market prices, ARB is trading at a discount compared to OP across all valuation multiples," Goel pointed out.
ARB price in descending triangle breakout
The ongoing surge in Arbitrum’s price has breached what seems to be a continuation pattern.
Related: ARB price to $2? Ethereum L2 rival Arbitrum will double in April, fractal suggests
Referred to as a descending triangle, this pattern occurs when the price consolidates between a declining trendline resistance and horizontal support. It resolves when the price breaks out of the range, following the direction of its preceding trend.
ARB has entered a similar breakout phase on April 13 after surpassing the upper trendline of its triangle with significant volumes.
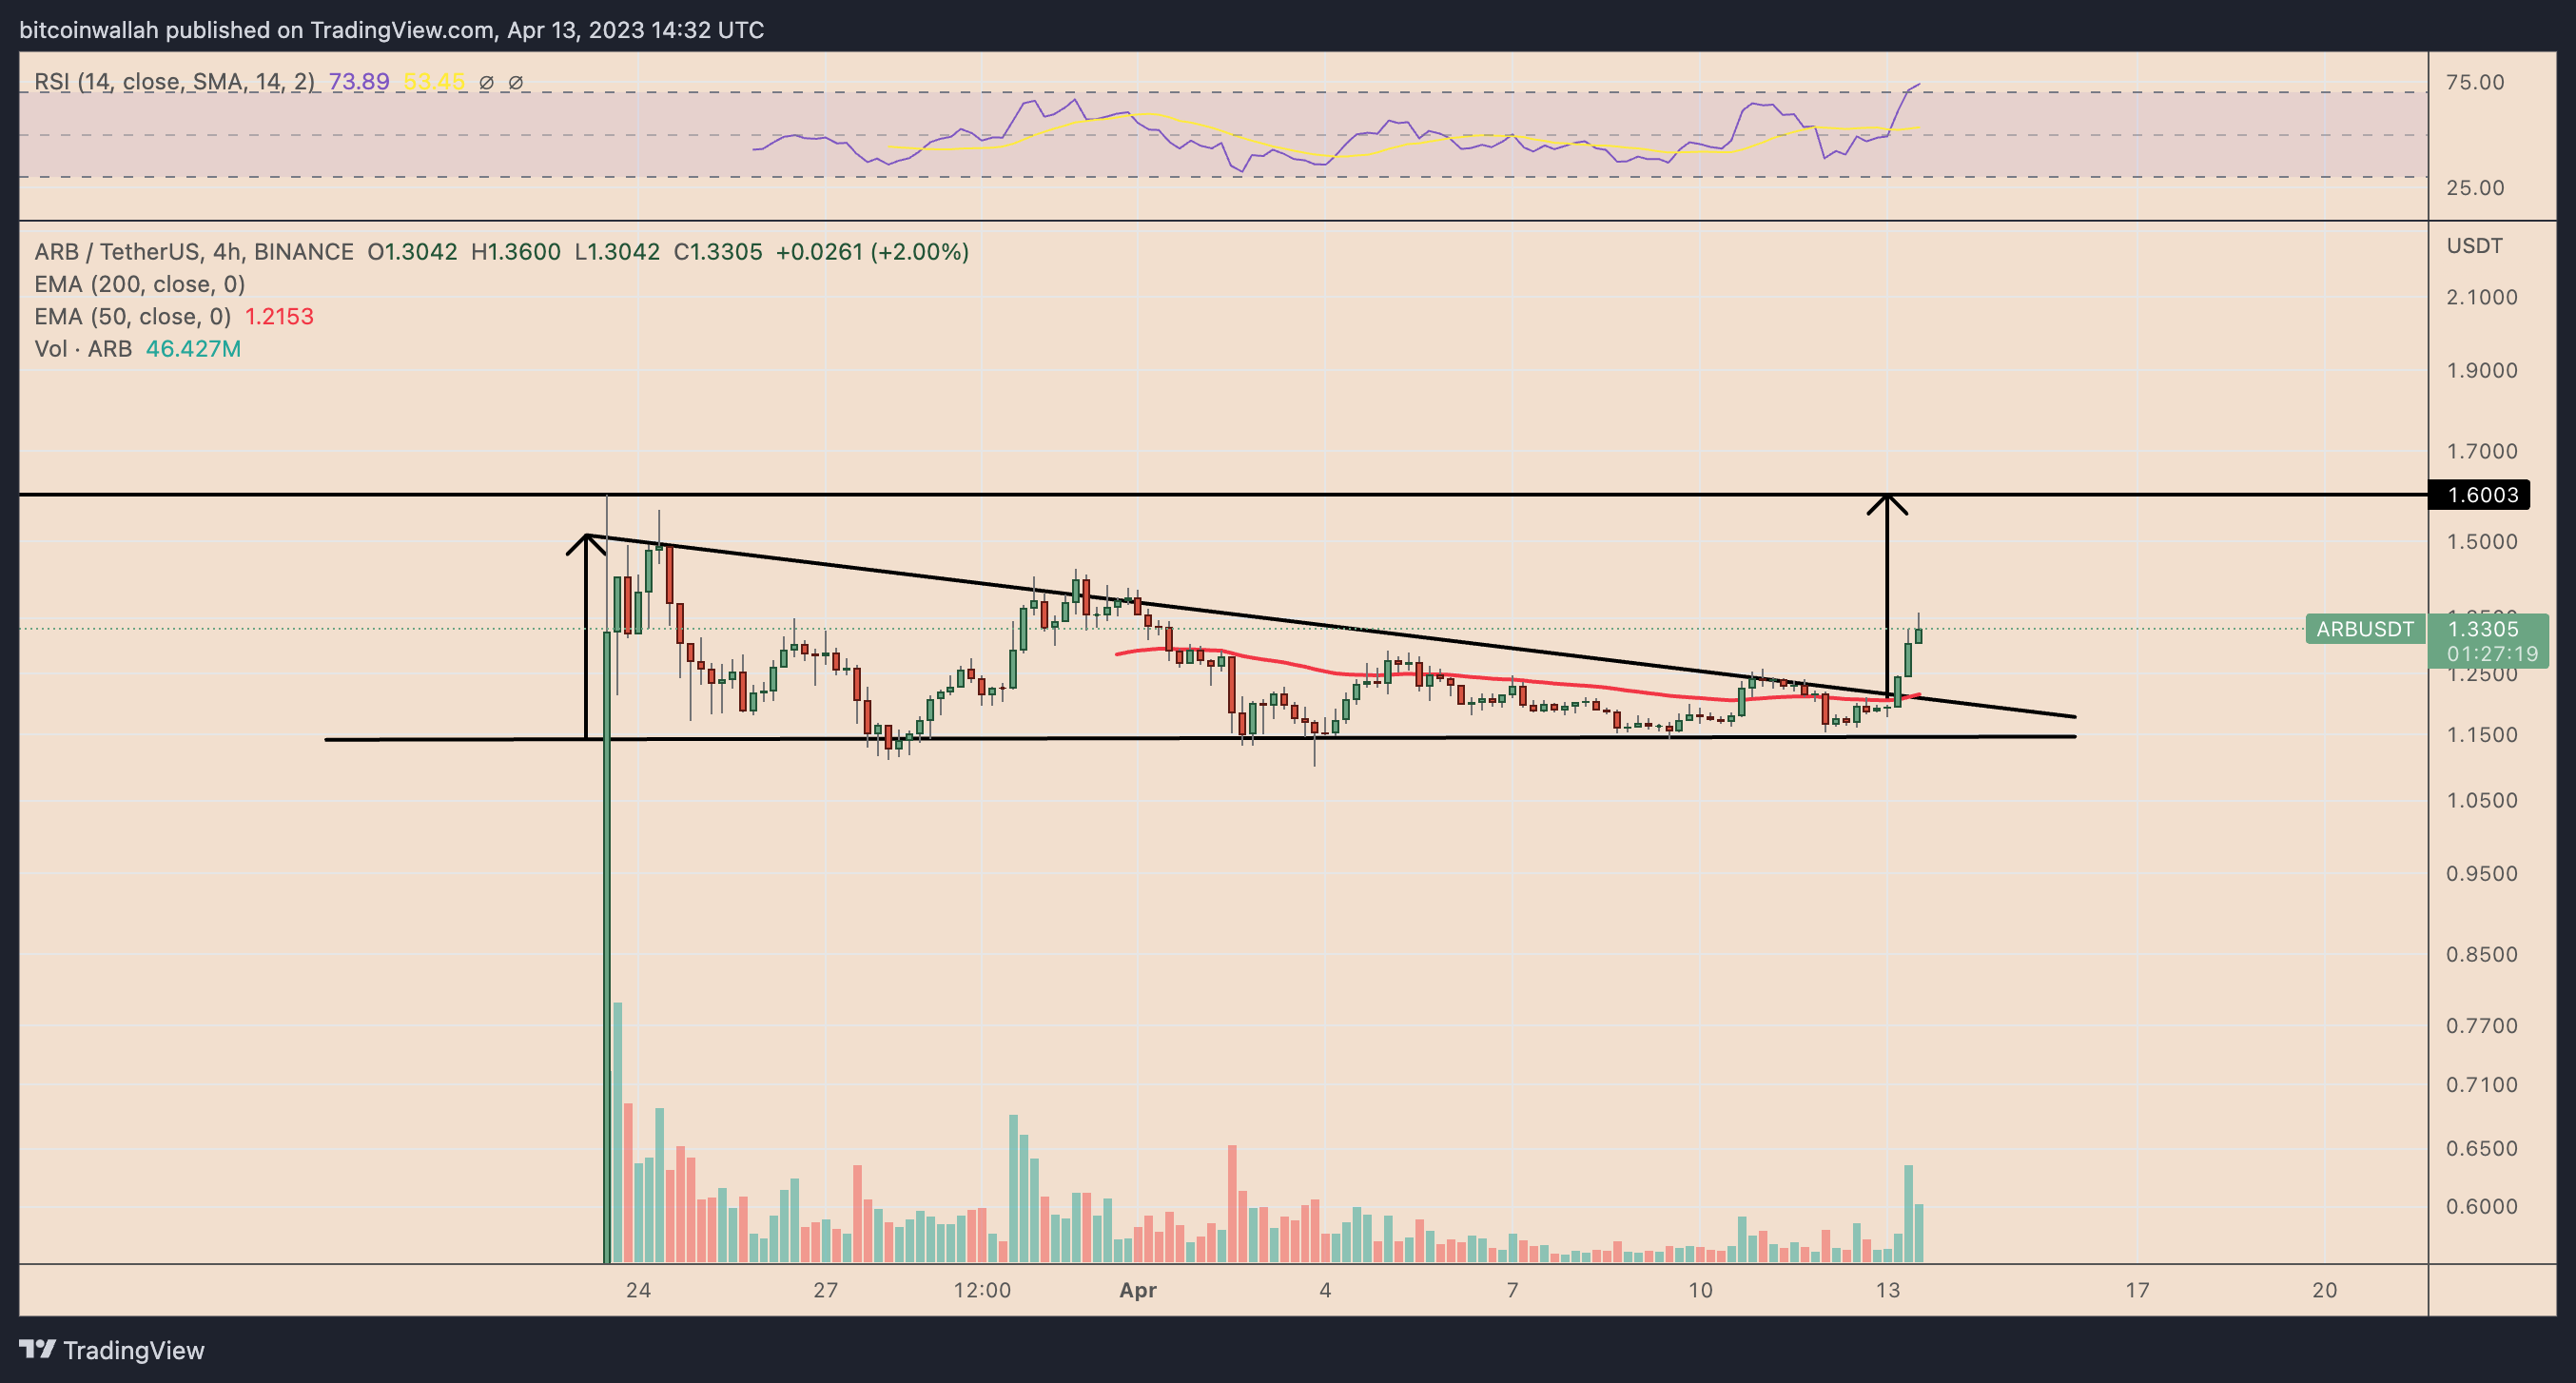 ARB/USD four-hour price chart. Source: TradingView
The ARB/USD pair is now aiming for $1.60 in Q2, a significant achievement, representing a 20% increase from the current price levels. This target is calculated by adding the maximum distance between the triangle’s trendlines to the breakout point.
Conversely, the ARB price may face a short-term correction due to its overbought relative strength index (RSI) on a four-hour chart. In this scenario, the triangle’s upper trendline may serve as the probable downside target at approximately $1.20.
This article does not contain investment advice or recommendations. Every investment and trading move involves risk, and readers should conduct their own research when making decisions.